
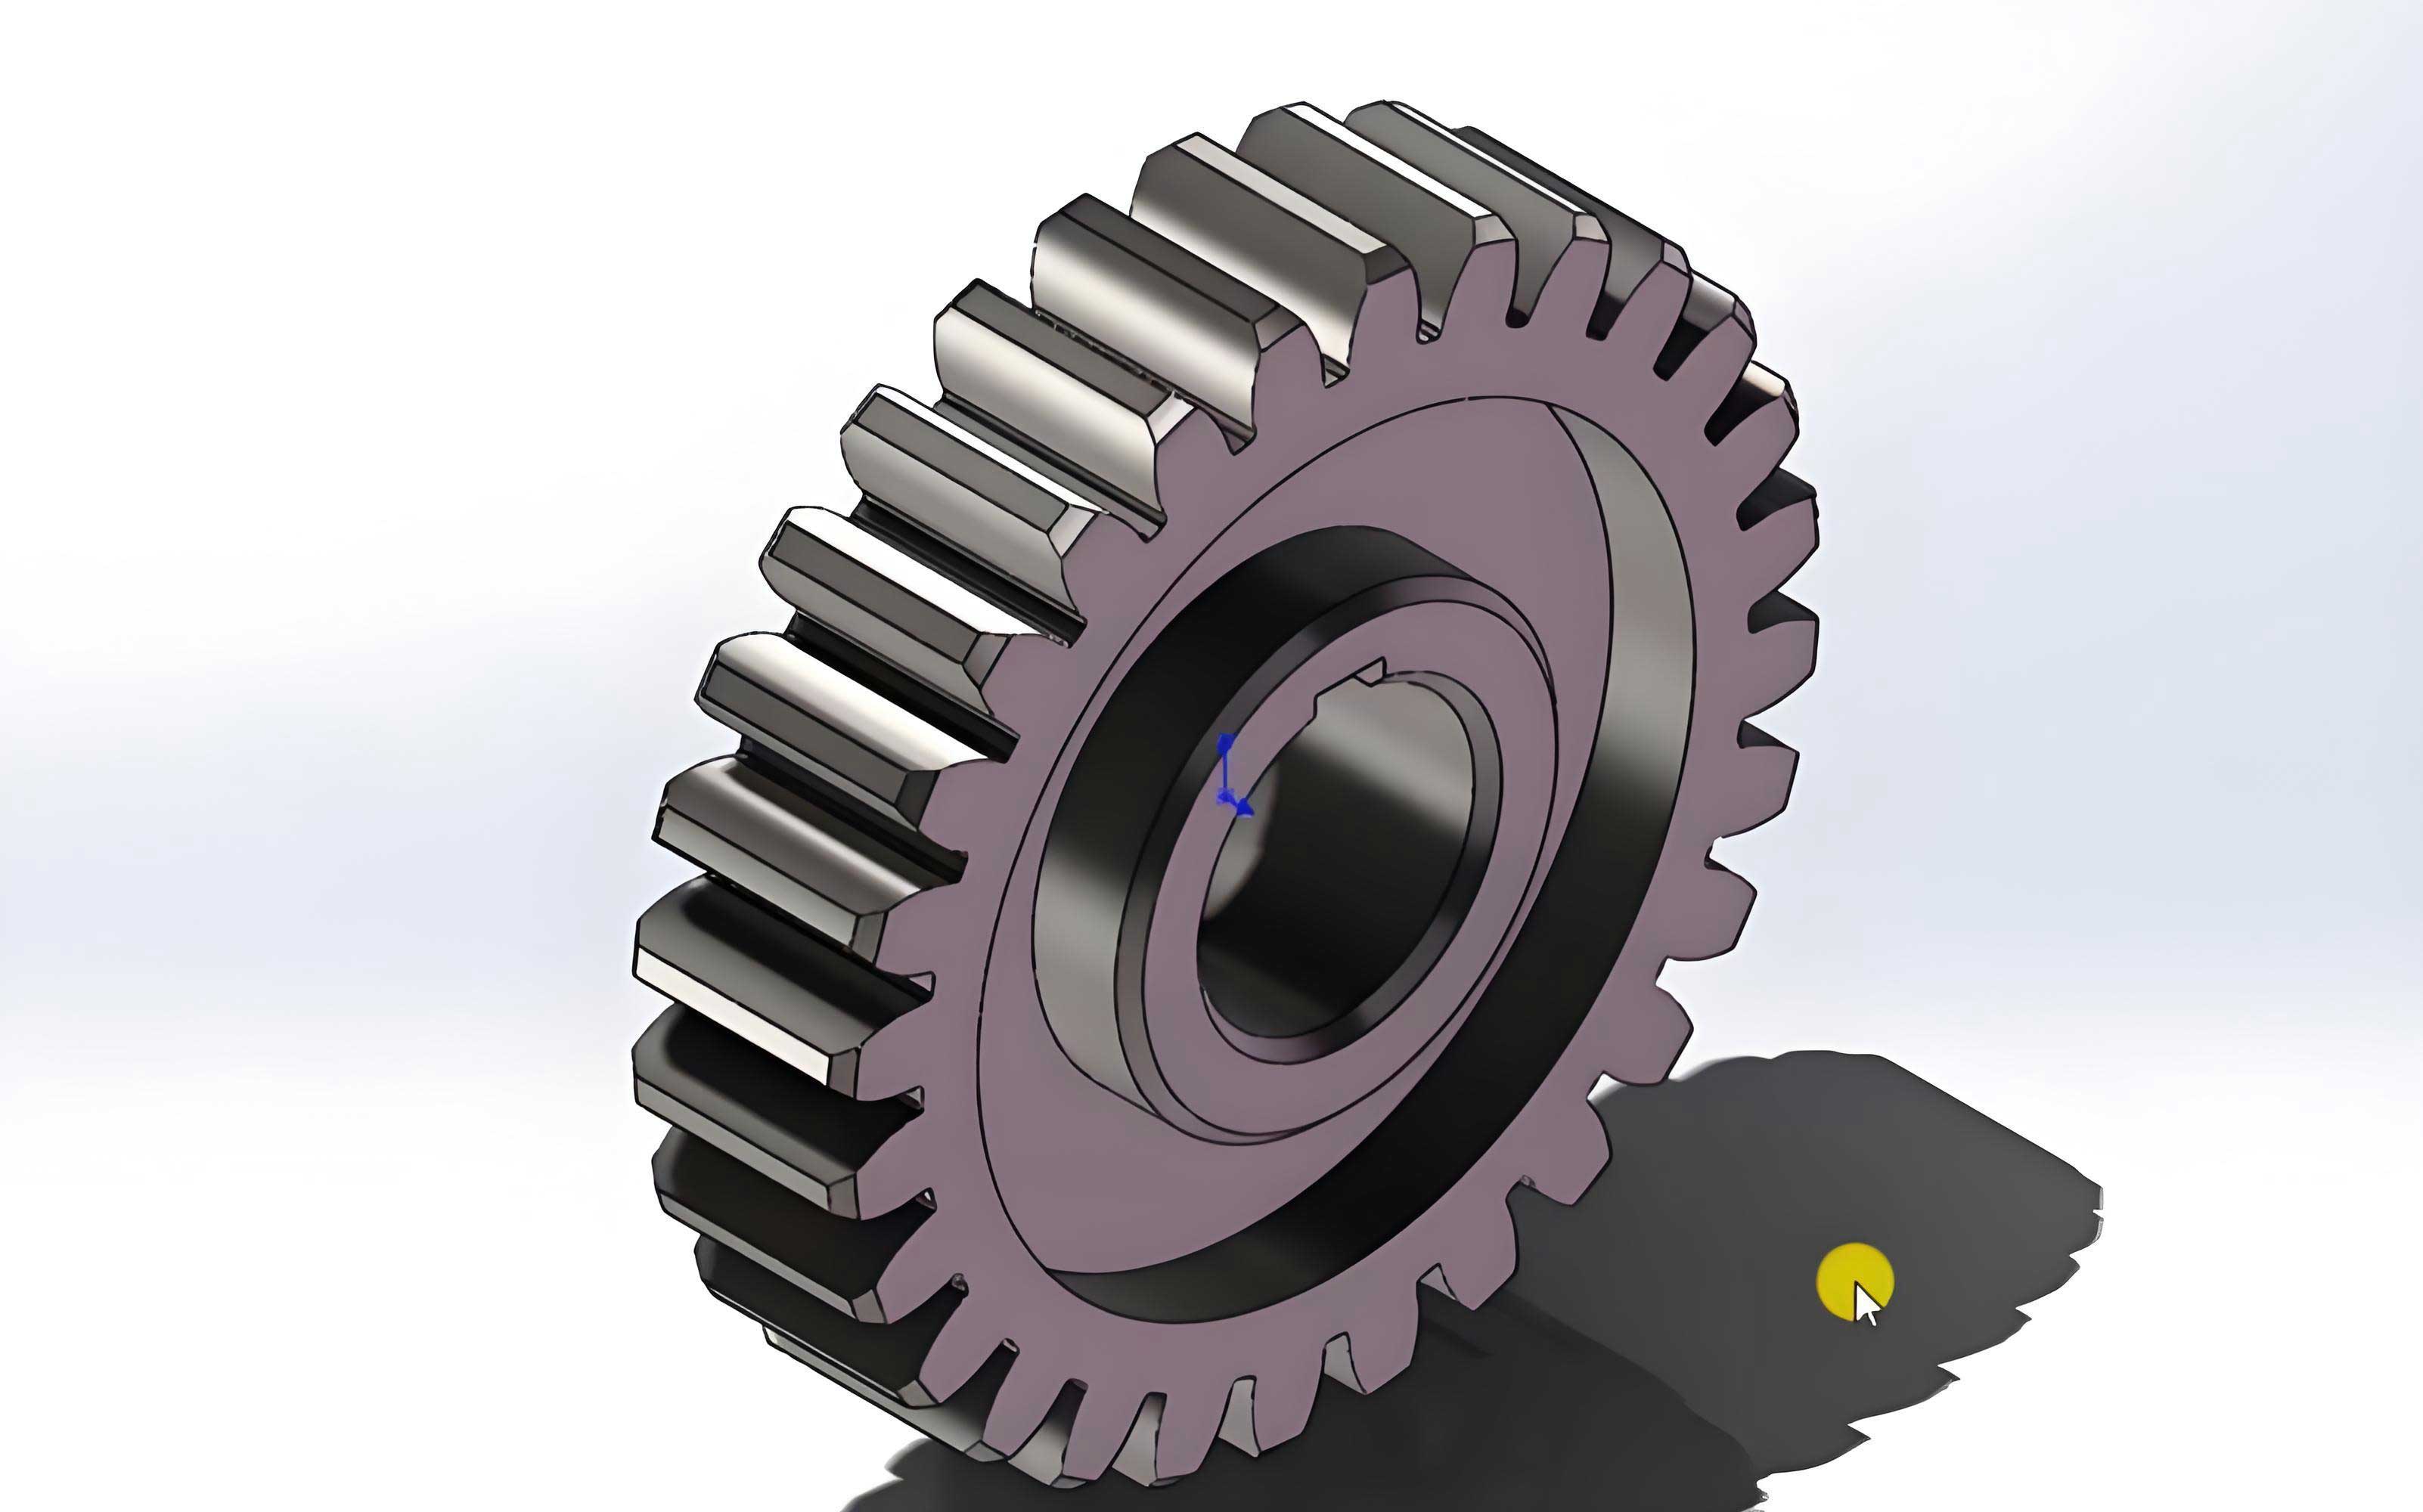
Surface integrity plays a decisive role in the service life and fatigue performance of mechanical components. For spur gears, the combination of surface micro-morphology and residual stress directly affects contact fatigue, bending fatigue, and wear resistance. In this work, I focus on a novel surface strengthening process for spur gears, namely double-roller ultrasonic rolling. The process integrates the principle of gear meshing with an ultrasonic vibration superimposed on the driving gear. Both torsional and longitudinal vibrations are introduced at the tool gear side, giving rise to repeated impacts on the tooth flank of the workpiece spur gear. These impacts lead to severe plastic deformation in the near-surface layer, which refines the grain structure, induces beneficial compressive residual stresses, and improves the surface finish.
I present a comprehensive numerical study on the surface integrity of a 40Cr spur gear processed by double-roller ultrasonic rolling. The main objective is to establish a reliable finite element model that accounts for the initial surface condition of the spur gear, including the measured surface topography, the micro-hardness gradient, and the pre-existing residual stress distribution. The model is then used to investigate the effects of spindle speed, load torque, vibration frequency, and torsional amplitude on the final surface micro-morphology and residual stress. Extensive experiments are carried out on a self-developed test platform to verify the numerical predictions. The work aims to provide a theoretical basis for the design and optimization of this emerging gear strengthening technology.
1. Introduction and Background
Gear transmission systems are widely used in high-speed railways, automotive drivetrains, aerospace mechanisms, and heavy machinery. The failure of spur gears often initiates at the surface or subsurface region due to high contact stresses and cyclic loading. Surface strengthening technologies such as shot peening, laser shock peening, deep rolling, and ultrasonic surface rolling have been developed to enhance the fatigue resistance of metallic components. Among these, ultrasonic surface rolling is particularly attractive because it can simultaneously reduce surface roughness and introduce deep compressive residual stresses. However, conventional ultrasonic surface rolling is mainly applicable to flat or cylindrical workpieces with simple geometry. The complex tooth flank of a spur gear makes it difficult to apply standard ultrasonic surface rolling tools.
To extend the advantages of ultrasonic surface rolling to gear-shaped components, a new process named double-roller gear ultrasonic rolling is proposed. In this process, the tool gear is connected to an ultrasonic transducer and a horn with helical grooves. The ultrasonic generator excites a longitudinal vibration, and the helical horn converts part of the longitudinal vibration into a torsional vibration. Thus, the tool gear possesses both axial (longitudinal) and circumferential (torsional) vibrations. When the tool gear meshes with the workpiece spur gear, the torsional vibration modulates the rotation speed, generating periodic impacts on the tooth flank. The longitudinal vibration produces a relative sliding motion along the face width direction. The combined action results in repeated extrusion and rubbing, which flattens micro-peaks, fills valleys, and creates a compressive residual stress layer.
Several studies have been conducted on conventional ultrasonic surface rolling, covering experimental investigations, analytical modeling, finite element simulation, and equipment development. For example, researchers have studied the effect of static load, spindle speed, feed rate, and vibration amplitude on the residual stress and roughness of titanium alloys, aluminum alloys, and gear steels. However, the double-roller gear ultrasonic rolling process is relatively new. The dynamic contact behavior between two meshing gears under ultrasonic vibration is complex, and the initial surface state of the spur gear significantly influences the final surface integrity. Therefore, a high-fidelity finite element model that incorporates the measured initial surface micro-morphology, hardness gradient, and residual stress is essential for accurate prediction of the process output.
2. Finite Element Model of Double-roller Ultrasonic Rolling for Spur Gears
I developed the finite element model using the commercial software ABAQUS. The model consists of a tool gear and a workpiece spur gear. The tool gear has 23 teeth, a module of 1.75 mm, a pressure angle of 20°, and a face width of 20 mm. The workpiece spur gear has 31 teeth with the same module and pressure angle. The material of the workpiece is 40Cr steel in the quenched and tempered condition. Its Young’s modulus is 206 GPa, Poisson’s ratio is 0.28, and density is 7800 kg/m³. The tool gear is made of 12Cr2Ni4A steel and is treated as a rigid body in the simulation to reduce computational cost, whereas the workpiece spur gear is modeled as a deformable body with elastic-plastic behavior.
2.1 Geometry and Mesh Development
To achieve a reasonable balance between accuracy and computational efficiency, the face width of the model is reduced from 20 mm to 2 mm. According to the Hertzian contact theory, the contact stress in spur gear meshing depends on the normal load per unit contact length. If the face width is scaled down by a factor of ten, the applied torque can be reduced by the same factor to maintain an equivalent contact stress. The Hertzian contact stress can be expressed as:
$$
\sigma_{H} = \sqrt{\frac{F_{n} \left( \frac{1}{\rho_1} \pm \frac{1}{\rho_2} \right)}{\pi L \left( \frac{1-\mu_1^2}{E_1} + \frac{1-\mu_2^2}{E_2} \right)}}
$$
where \( F_n \) is the normal contact force, \( \rho_1 \) and \( \rho_2 \) are the radii of curvature of the two gear profiles, \( L \) is the contact line length, \( E_1 \), \( E_2 \) are the elastic moduli, and \( \mu_1 \), \( \mu_2 \) are the Poisson ratios.
A local mesh refinement strategy is adopted in the workpiece spur gear. The region around the pitch circle is refined with a uniform element size of 10 μm × 10 μm. The refined area covers 0.26 mm in the face width direction and 1 mm in the profile direction. This region is intended for extracting surface micro-morphology and residual stress data. A transition zone with element sizes between 50 and 100 μm connects the refined zone to the coarser mesh. Along the tooth thickness direction, the mesh is graded such that the first six layers have a thickness of 20 μm, while the subsequent layers have a thickness of 50 μm. This layering enables the assignment of depth-dependent material properties and facilitates post-processing.
I implemented a Python script to automatically create node and element sets for each layer. This is essential because manual selection of thousands of elements would be tedious and error-prone. The Python script reads the node coordinates and element labels from the mesh data and groups them according to the depth range. The resulting element sets are used for assigning different yield strengths and initial residual stresses in each layer. The surface node set is used for extracting the deformed coordinates to reconstruct the surface topography.
2.2 Characterization of Initial Surface Integrity
One of the key contributions of this work is the inclusion of the actual initial surface condition of the spur gear in the finite element model. The initial surface micro-morphology of the workpiece tooth flank is measured with a white light interferometer before the ultrasonic rolling experiment. The measured height map has a lateral spacing of 0.5 μm, which is much smaller than the finite element mesh size of 10 μm. Therefore, the height data is first resampled to a regular grid with a spacing of 10 μm using interpolation in ConfoMap ST 6.2 software. The resampled height map preserves the main features of the original surface, including grinding marks and random roughness peaks.
To insert the roughness into the finite element geometry, I calculated the normal direction at each node on the ideal involute tooth flank. For a spur gear, the normal line at any point on the involute profile is tangent to the base circle. The base circle radius is computed as:
$$
r_{b} = \frac{m z}{2} \cos\left(\frac{\pi \alpha}{180^\circ}\right)
$$
where \( m \) is the module, \( z \) is the number of teeth, and \( \alpha \) is the pressure angle. The tangent slope \( k \) for a given point on the involute is obtained from the equations of the base circle and the tangent line:
$$
\begin{cases}
x^2 + y^2 = r_b^2 \\
kx – y – kx_0 + y_0 = 0
\end{cases}
$$
Solving the quadratic equation gives two possible slopes. The appropriate slope is selected according to the position of the node relative to the center of the gear. Once the normal direction is known, the measured height value is added along the normal vector to each node coordinate. Similarly, the resampled height data are used to shift the nodes in the refined region. This procedure generates a realistic rough surface in the finite element model.
The initial micro-hardness gradient is also measured experimentally. The Vickers hardness values are converted into yield strength values using the empirical relationship:
$$
\sigma_{s} = -20.0016 + 3.86 \times HV – 0.0016 \times HV^2
$$
where \( HV \) is the Vickers hardness number and \( \sigma_s \) is the yield strength in MPa. The measured hardness profile shows a slight variation in the near-surface layer. To incorporate this in the model, each element layer is assigned a different yield strength according to the measured hardness at the corresponding depth. The table below summarizes the measured hardness and the calculated yield strength at selected depths for the untreated spur gear.
| Depth (μm) | Vickers Hardness (HV0.025) | Yield Strength (MPa) |
|---|---|---|
| 0 | 309 | 765 |
| 20 | 304 | 752 |
| 40 | 297 | 733 |
| 60 | 294 | 724 |
| 80 | 301 | 744 |
| 100 | 305 | 755 |
| 150 | 298 | 736 |
| 200 | 296 | 730 |
| 300 | 292 | 718 |
The initial residual stress in the workpiece spur gear is measured using an X-ray diffraction instrument. The measurements are performed at several depths after electrolytic polishing. The measured residual stress profiles in the face width direction and the profile direction are different. The initial compressive residual stress near the surface ranges from -50 MPa to -120 MPa depending on the machining process. In the finite element model, these stresses are introduced as a predefined stress field. For each element layer, a constant initial stress value equal to the measured average in that depth range is specified. The initial stresses are applied only in the two directions parallel to the tooth flank; the normal stress component is set to zero because it cannot be measured reliably by X-ray diffraction.
2.3 Loading and Boundary Conditions
The tool gear is subjected to a combined rotational motion. The rotational angle \( \theta(t) \) is composed of a constant spindle rotation term and a sinusoidal torsional vibration term:
$$
\theta(t) = \frac{2\pi n}{60} t + \frac{2 A_{m}}{m z_1} \sin(2\pi f t)
$$
where \( n \) is the spindle speed in rpm, \( A_m \) is the torsional vibration amplitude expressed as a linear displacement at the pitch circle, \( m \) is the module, \( z_1 \) is the number of teeth of the tool gear, and \( f \) is the vibration frequency. This equation couples the steady rotation and the ultrasonic torsional oscillation into a single angular position vs. time curve. The derivative of the rotation angle gives a periodically varying angular velocity, which physically represents the impact and rubbing action on the workpiece tooth flank.
The workpiece spur gear is constrained to rotate about its axis but is free to rotate in response to the meshing forces. A constant load torque is applied to the workpiece gear in the direction opposite to the rotation. The contact between the tool gear and the workpiece spur gear is defined as surface-to-surface contact. The tool gear face is the master surface, and the workpiece face is the slave surface. The normal contact behavior uses hard contact, while the tangential behavior uses a penalty formulation with a friction coefficient of 0.1. The mesh and boundary conditions are illustrated conceptually in the following table.
| Component | Material | Element Type | Boundary/Load |
|---|---|---|---|
| Tool gear | 12Cr2Ni4A (rigid) | R3D4 | Rotation: θ(t) from Eq. (5) |
| Workpiece gear | 40Cr (elasto-plastic) | C3D8R | Rotation about Z, load torque applied |
Because the torsional vibration frequency is in the ultrasonic range (typically 15-30 kHz), a large number of cycles would be required to simulate a complete rotation of the gear. To reduce the computational time, only a short time window that corresponds to a few vibration cycles is simulated. The simulation time step is chosen to be small enough to capture the high-frequency oscillation. The explicit dynamic solver is used for the deformation analysis, followed by an implicit static step for springback and residual stress stabilization.
2.4 Data Processing Methods
After the simulation, the deformed coordinates of the nodes on the tooth flank are extracted. Since the workpiece gear rotates during the analysis, the coordinates must be transformed back to the original reference frame before the surface micro-morphology can be evaluated. For a spur gear, the rotation occurs in the plane perpendicular to the gear axis. The rotation angle \( \alpha \) between the original and deformed configurations is computed from the positions of two reference nodes:
$$
\cos\alpha = \frac{b^2 + c^2 – a^2}{2bc}
$$
where \( a \) is the distance between the original and deformed positions of a node, and \( b \), \( c \) are the distances from the gear center to the original and deformed positions, respectively. The deformed coordinates are then rotated by \( -\alpha \) to align them with the original gear frame. The height of the rough surface is calculated as the distance from each rotated node to the underlying smooth involute profile. A local curve is fitted to the neighboring smooth nodes, and the perpendicular distance is taken as the roughness height.
For the extraction of the surface micro-morphology, it is necessary to separate the roughness component from the waviness and form components. I implemented a Gaussian filter according to the ISO 16610 standard. The two-dimensional Gaussian weighting function for the areal filter is given by:
$$
s(x,y) = \frac{1}{\alpha^2 \lambda_c^2} \exp\left[-\frac{\pi}{\alpha \lambda_c^2}\left(x^2 + y^2\right)\right], \quad -\frac{L_c \lambda_c}{2} \leq x, y \leq \frac{L_c \lambda_c}{2}
$$
where \( \lambda_c \) is the cutoff wavelength, \( L_c \) is the truncation constant, and \( \alpha = \sqrt{\ln 2 / \pi} \). The filtered mean surface is obtained by convolving the height map with this kernel. Because the convolution is only defined in the interior, the edges are handled by the line-symmetric reflection method. I wrote a Python script to perform the convolution efficiently and verified the filter against commercial software. The results match well, with a difference in the arithmetic mean height \( Sa \) of less than 0.04 μm.
The residual stress extracted from the finite element model is originally expressed in the global Cartesian coordinate system. However, the experimental X-ray diffraction measurement provides stress components in a local coordinate system attached to the gear tooth surface. To compare the simulation with the experiment, a coordinate transformation is required. The local coordinate system is constructed from the element nodes: one axis is tangent to the profile direction, another axis is along the face width direction, and the third axis is normal to the surface. The transformation matrix \( \beta \) is built from the direction cosines between the global and local axes:
$$
\beta =
\begin{bmatrix}
l_1 & m_1 & n_1 \\
l_2 & m_2 & n_2 \\
l_3 & m_3 & n_3
\end{bmatrix}
$$
where \( l_i, m_i, n_i \) are the cosines of the angles between the local axis \( i \) and the global \( x, y, z \) axes. The stress tensor in the local coordinate system is then computed as:
$$
\sigma’ = \beta \sigma \beta^{T}
$$
This transformation is essential for accurately comparing the simulated profile-direction residual stress with the measured value. Without the transformation, the surface residual stress in the profile direction is underestimated by about 20%.
3. Simulation Results and Parametric Study
Using the established finite element model, I conducted a series of simulations to investigate the influence of process parameters on the surface integrity of the spur gear. The baseline parameters were a spindle speed of 30 rpm, a load torque of 40 N·m, a vibration frequency of 20 kHz, and a torsional amplitude of 2 μm. Single-factor variations were performed as listed in the following table.
| Case | Spindle speed (rpm) | Load torque (N·m) | Frequency (kHz) | Torsional amplitude (μm) |
|---|---|---|---|---|
| S1M1F2A4 | 30 | 40 | 20 | 2.0 |
| S2M1F2A4 | 60 | 40 | 20 | 2.0 |
| S3M1F2A4 | 90 | 40 | 20 | 2.0 |
| S4M1F2A4 | 120 | 40 | 20 | 2.0 |
| S1M2F2A4 | 30 | 80 | 20 | 2.0 |
| S1M3F2A4 | 30 | 120 | 20 | 2.0 |
| S1M4F2A4 | 30 | 160 | 20 | 2.0 |
| S1M1F1A4 | 30 | 40 | 15 | 2.0 |
| S1M1F3A4 | 30 | 40 | 25 | 2.0 |
| S1M1F4A4 | 30 | 40 | 30 | 2.0 |
| S1M1F2A1 | 30 | 40 | 20 | 0.5 |
| S1M1F2A2 | 30 | 40 | 20 | 1.0 |
| S1M1F2A3 | 30 | 40 | 20 | 1.5 |
3.1 Effect on Surface Micro-morphology
The surface roughness parameters are extracted from the simulated surface after Gaussian filtering. The main parameters are the arithmetic mean height \( Sa \), the root mean square height \( Sq \), the maximum peak height \( Sp \), the maximum valley depth \( Sv \), and the total height \( Sz \). Additionally, the skewness \( Ssk \) and kurtosis \( Sku \) are computed to characterize the shape of the height distribution.
The effect of load torque on the surface micro-morphology of the spur gear is shown in the following table. As the torque increases from 40 N·m to 160 N·m, \( Sa \) first decreases from 0.193 μm to 0.121 μm at 80 N·m, then increases to 0.135 μm at 120 N·m and further to 0.175 μm at 160 N·m. The initial surface \( Sa \) of the spur gear before processing is 0.484 μm. The improvement is largest at 80 N·m, where the roughness is reduced by 75%. However, excessive torque causes a large global plastic deformation, which increases the height deviation relative to the mean plane and thus deteriorates the roughness.
| Torque (N·m) | Sa (μm) | Sq (μm) | Sp (μm) | Sv (μm) |
|---|---|---|---|---|
| Initial | 0.484 | 0.623 | 2.10 | -2.30 |
| 40 | 0.193 | 0.270 | 0.82 | -1.20 |
| 80 | 0.121 | 0.180 | 0.51 | -0.90 |
| 120 | 0.135 | 0.194 | 0.45 | -0.85 |
| 160 | 0.175 | 0.240 | 0.60 | -1.10 |
The spindle speed has a relatively moderate effect on the surface roughness. With the same torque and vibration parameters, increasing the speed from 30 rpm to 120 rpm reduces \( Sa \) from 0.193 μm to 0.166 μm. The higher speed leads to more contact passes over the same area in a given time, which helps to flatten the remaining peaks. However, the effect gradually saturates.
The vibration frequency also influences the roughness. At 15 kHz, \( Sa \) is 0.197 μm; at 20 kHz, 0.193 μm; at 25 kHz, 0.173 μm; and at 30 kHz, 0.183 μm. The best improvement is observed at 25 kHz, indicating that there is an optimal frequency range for the spur gear material and load conditions.
The torsional amplitude variation from 0.5 μm to 2.0 μm results in \( Sa \) values between 0.189 μm and 0.198 μm. The effect is small within this range because the amplitude is small compared to the tooth deflection and the overall rotation. The vibration contribution is partially averaged out over the rotation cycle.
3.2 Effect on Residual Stress
The residual stress distribution in the spur gear after processing is extracted along the tooth thickness direction. The two in-plane stress components are considered: the profile-direction stress \( \sigma_x \) and the face-width-direction stress \( \sigma_z \). The following table summarizes the surface residual stress values for different load torques.
| Torque (N·m) | σx surface (MPa) | σz surface (MPa) | Max compressive (MPa) | Depth of max (μm) |
|---|---|---|---|---|
| 40 | -427.0 | -323.4 | -427.0 | 0 |
| 80 | -142.4 | -452.3 | -452.3 | 20 |
| 120 | -72.4 | -673.3 | -673.3 | 50 |
| 160 | -454.4 | -788.1 | -788.1 | 60 |
It is interesting to note that the profile-direction stress \( \sigma_x \) does not monotonically increase with torque. This may be due to the redistribution of plastic flow along the tooth profile and the formation of surface waviness at higher loads. In contrast, the face-width stress \( \sigma_z \) increases consistently with torque, reaching a surface value of -788.1 MPa at 160 N·m. The maximum compressive stress also increases and shifts to a deeper location, which is beneficial for improving the fatigue life of the spur gear.
The effect of spindle speed on residual stress is shown below. The surface \( \sigma_x \) decreases from -427.0 MPa at 30 rpm to about -380 MPa at 60 and 90 rpm, then increases to -454.4 MPa at 120 rpm. The surface \( \sigma_z \) increases from -323.4 MPa at 30 rpm to -491.5 MPa at 120 rpm. The residual stress layer depth increases slightly with speed because more impacts are accumulated over the same number of vibration cycles.
| Speed (rpm) | σx surface (MPa) | σz surface (MPa) | Residual layer depth (μm) |
|---|---|---|---|
| 30 | -427.0 | -323.4 | 80 |
| 60 | -381.5 | -440.0 | 100 |
| 90 | -378.2 | -455.1 | 110 |
| 120 | -454.4 | -491.5 | 120 |
The vibration frequency has a positive effect on the profile-direction residual stress. When the frequency is increased from 15 kHz to 25 kHz, the surface \( \sigma_x \) increases from about -381 MPa to -482 MPa, while \( \sigma_z \) increases from -440 MPa to -472 MPa. A further increase to 30 kHz slightly reduces \( \sigma_z \) to -472 MPa. The optimal frequency for residual stress generation in the simulated spur gear is around 25 kHz.
The torsional amplitude shows a minor influence on residual stress. In the range of 0.5 to 2.0 μm, the surface \( \sigma_x \) varies between -452.3 and -459.6 MPa, and \( \sigma_z \) between -453.3 and -454.4 MPa. The small amplitude variation does not significantly change the overall contact force because the static torque dominates the load.
4. Experimental Investigation of Spur Gear Ultrasonic Rolling
To validate the finite element model and to obtain the actual process response, I designed and built a test platform for double-roller gear ultrasonic rolling. The platform consists of a tool gear drive system, a workpiece gear loading system, a lubrication system, and a software control unit. The tool gear is driven by a servo motor through an ultrasonic transducer and a helical-slotted horn. The ultrasonic generator produces an electrical signal at a frequency of about 19401 Hz. The amplitude of the longitudinal and torsional vibrations is measured using a laser vibrometer at the tool gear face. The measured peak-to-peak values are summarized in the following table.
| Ultrasonic power (%) | Longitudinal amplitude (μm) | Torsional amplitude (μm) | Frequency (Hz) |
|---|---|---|---|
| 10 | 0.469 | 0.218 | 19401 |
| 20 | 0.582 | 0.346 | 19401 |
| 30 | 0.855 | 0.492 | 19401 |
| 40 | 1.099 | 0.762 | 19401 |
| 50 | 1.369 | 0.831 | 19401 |
| 60 | 1.865 | 0.978 | 19401 |
| 70 | 1.909 | 0.944 | 19401 |
| 80 | 1.936 | 0.931 | 19401 |
| 90 | 1.946 | 0.895 | 19401 |
| 99 | 1.925 | 0.891 | 19401 |
I conducted 14 groups of single-factor experiments on spur gear specimens that were manufactured either by hobbing or by grinding. The workpiece gear is always the larger gear made of 40Cr steel. The tool gear is the smaller gear made of 12Cr2Ni4A steel. The experimental parameters include spindle speed, load torque, ultrasonic power, and processing time. The surface integrity parameters before and after processing are measured using a white light interferometer for surface morphology, a Vickers micro-hardness tester for hardness gradient, and an X-ray diffractometer for residual stress.
4.1 Hardness Gradient
Vickers micro-hardness measurements are performed on a polished cross-section of the spur gear tooth. The load is 25 gf and the dwell time is 12 s. The hardness profile along the tooth thickness direction is obtained with a spacing of 10 μm in the near-surface region. The result shows that the untreated hardness is approximately 300 HV0.025. After ultrasonic rolling with a spindle speed of 30 rpm, torque of 40 N·m, power of 30%, and duration of 10 min, the hardness is increased by about 40 HV0.025. The largest improvement occurs at a depth of 60 μm, where the hardness changes from 294.1 HV0.025 to 367.1 HV0.025, an increase of 24.89%. The hardness profile after processing exhibits a gradient decreasing from the surface to the core, which is desirable for gear applications.
4.2 Surface Micro-morphology
The surface micro-morphology of the spur gear is measured at three locations along the tooth profile: near the tip, at the pitch circle, and near the root. For the hobbed spur gear, the initial surface exhibits clear cutter marks with intermittent “cliff-like” features and deep valleys. After processing, the roughness at the pitch circle is reduced from Sa = 0.696 μm to Sa = 0.205 μm, an improvement of 70.54%. However, at the root region, the improvement is negligible. For the ground spur gear, the initial surface has a typical grinding texture with Sa values between 0.313 and 0.497 μm. The best improvement is observed near the tooth tip, where Sa is reduced from 0.388 μm to 0.179 μm. The surface becomes almost mirror-like, although some deep pits remain unfilled.
The following table compares the measured and simulated surface roughness \( Sa \) for different load torques. All specimens used in the validation are ground spur gears with an initial \( Sa \) of about 0.497 μm.
| Torque (N·m) | Simulated Sa (μm) | Measured Sa (μm) | Relative error (%) |
|---|---|---|---|
| Initial | 0.484 | 0.497 | 2.62 |
| 30 | 0.227 | 0.221 | 2.71 |
| 40 | 0.194 | 0.198 | 2.02 |
| 50 | 0.164 | 0.166 | 1.20 |
| 60 | 0.137 | 0.144 | 4.86 |
The simulated surface morphologies are in good agreement with the measured ones. Both show that the initial grinding peaks are flattened and the shallow valleys are partially filled. The deep grooves remain visible after processing, which is consistent with the experimental observation.
4.3 Residual Stress
The surface residual stress is measured by X-ray diffraction at three points along the face width direction. The measured values are averaged to account for possible edge effects. The results for different process parameters are summarized below.
For the ground spur gear, the initial surface residual stress is about -115 MPa. After processing with 60 N·m torque, the residual stress becomes -503.7 MPa, which is 4.37 times higher in magnitude. For the hobbed spur gear, the initial stress is about -259 MPa. After processing with 70% ultrasonic power, the stress reaches -595.8 MPa, an improvement of 2.30 times. The residual stress also increases with processing time. When the time is increased from 5 min to 40 min, the surface compressive stress increases from about -500 MPa to -572.7 MPa.
To validate the finite element predictions, I compared the simulated and measured residual stress profiles for different load torques. The following table lists the surface values of \( \sigma_z \) and \( \sigma_x \).
| Torque (N·m) | σz sim (MPa) | σz exp (MPa) | Error (%) | σx sim (MPa) | σx exp (MPa) | Error (%) |
|---|---|---|---|---|---|---|
| 30 | -440.0 | -428.6 | 2.66 | -381.5 | -387.2 | 1.47 |
| 40 | -455.1 | -467.2 | 2.60 | -425.3 | -408.4 | 4.15 |
| 50 | -477.9 | -494.7 | 3.40 | -433.4 | -410.0 | 5.71 |
| 60 | -489.2 | -503.7 | 2.88 | -404.0 | -381.0 | 6.03 |
The overall relative errors are below 7%, which confirms the accuracy of the finite element model. The simulated residual stress distributions along the depth direction also show good consistency with the measured profiles. The small deviations can be attributed to the uncertainty in the electrolytic polishing depth and the variation of material properties in the actual spur gear.
5. Discussion
The double-roller ultrasonic rolling process is a promising method for improving the surface integrity of spur gears. The finite element model developed in this work provides a detailed insight into the deformation and stress evolution during the process. The inclusion of the initial surface roughness and the depth-dependent mechanical properties is crucial for accurate prediction. The initial hardness gradient influences the plastic deformation distribution, while the initial residual stress affects the final equilibrium of the residual stress field.
The parametric study reveals that the load torque is the most important parameter for controlling the residual stress layer depth and the maximum compressive residual stress. However, excessive torque can lead to an increase in surface roughness due to macro-scale plastic deformation. Therefore, an optimal torque exists that balances roughness reduction and residual stress enhancement. The spindle speed mainly affects the number of impacts and the contact frequency; a higher speed generally improves the surface finish but may slightly reduce the profile-direction surface residual stress. The vibration frequency has an optimal value around 25 kHz for the present spur gear geometry. The torsional amplitude has a smaller influence in the tested range.
The experimental results confirm that the process is capable of producing a hardened surface layer with high compressive residual stresses and a low surface roughness. The hardness improvement is attributed to severe plastic deformation and grain refinement. The surface residual stress improvement is favorable for suppressing fatigue crack initiation and propagation. The reduction of surface roughness reduces stress concentration and improves the contact behavior of the spur gear.
6. Conclusions and Outlook
In this work, I have performed a comprehensive numerical and experimental study on the surface integrity of a 40Cr spur gear generated by double-roller gear ultrasonic rolling. The following conclusions can be drawn:
(1) A high-precision finite element model for predicting the surface integrity of a spur gear after double-roller ultrasonic rolling was established. The model incorporates the measured initial surface micro-morphology, micro-hardness gradient, and residual stress distribution. The use of Python scripts for automated pre-processing and post-processing significantly improves the efficiency and accuracy of the analysis.
(2) The load torque has the most significant effect on the residual stress and surface roughness. With an increase in torque, the compressive residual stress and the depth of the hardened layer generally increase, but the surface roughness first decreases and then increases. The optimal torque for the tested spur gear is around 80 N·m for surface finish and higher for deeper residual stress.
(3) The spindle speed has a moderate effect on the surface roughness and the face-width residual stress. Higher speeds improve the roughness and increase the face-width compressive stress, while the profile-direction stress shows a non-monotonic trend.
(4) The vibration frequency affects the residual stress and roughness in a non-linear manner. The best frequency in the tested range is 25 kHz. The torsional amplitude has a minor influence within the range of 0.5-2 μm.
(5) Experimental validation shows that the finite element model can accurately predict the surface roughness and residual stress after double-roller ultrasonic rolling. The relative errors are below 5% for surface roughness and below 7% for surface residual stress.
The present work provides a solid foundation for further investigations on the double-roller ultrasonic rolling process. Future studies should focus on the evolution of grain size and dislocation density, the effect of longitudinal vibration on the surface texture, and the extension of the model to helical gears, bevel gears, and other complex gear geometries. The development of process databases and machine-learning-based prediction models will further facilitate the practical application of this technology.