
Keywords: spur gear; time-varying meshing stiffness; compound fault; dynamic response; statistical index.
Gear drives are widely employed in industrial machinery, vehicles, marine systems and aerospace equipment because of their simple construction, accurate transmission, high load capacity and long service life. Among gear transmission systems, the spur gear is probably the most fundamental and most frequently considered configuration. In my research, I concentrated on the dynamic modelling and feature analysis of a spur gear system with crack-pitting compound faults. My objective was to improve the calculation of time-varying meshing stiffness (TVMS) for a healthy spur gear, then extend the method to cracked gears, pitted gears and finally to gears with combined crack-pitting damage. I also established an 8-degree-of-freedom spur gear-rotor model so that the dynamic responses caused by these compound faults could be studied in both the time domain and frequency domain. Statistical indicators were then introduced to characterize the severity of different fault combinations.
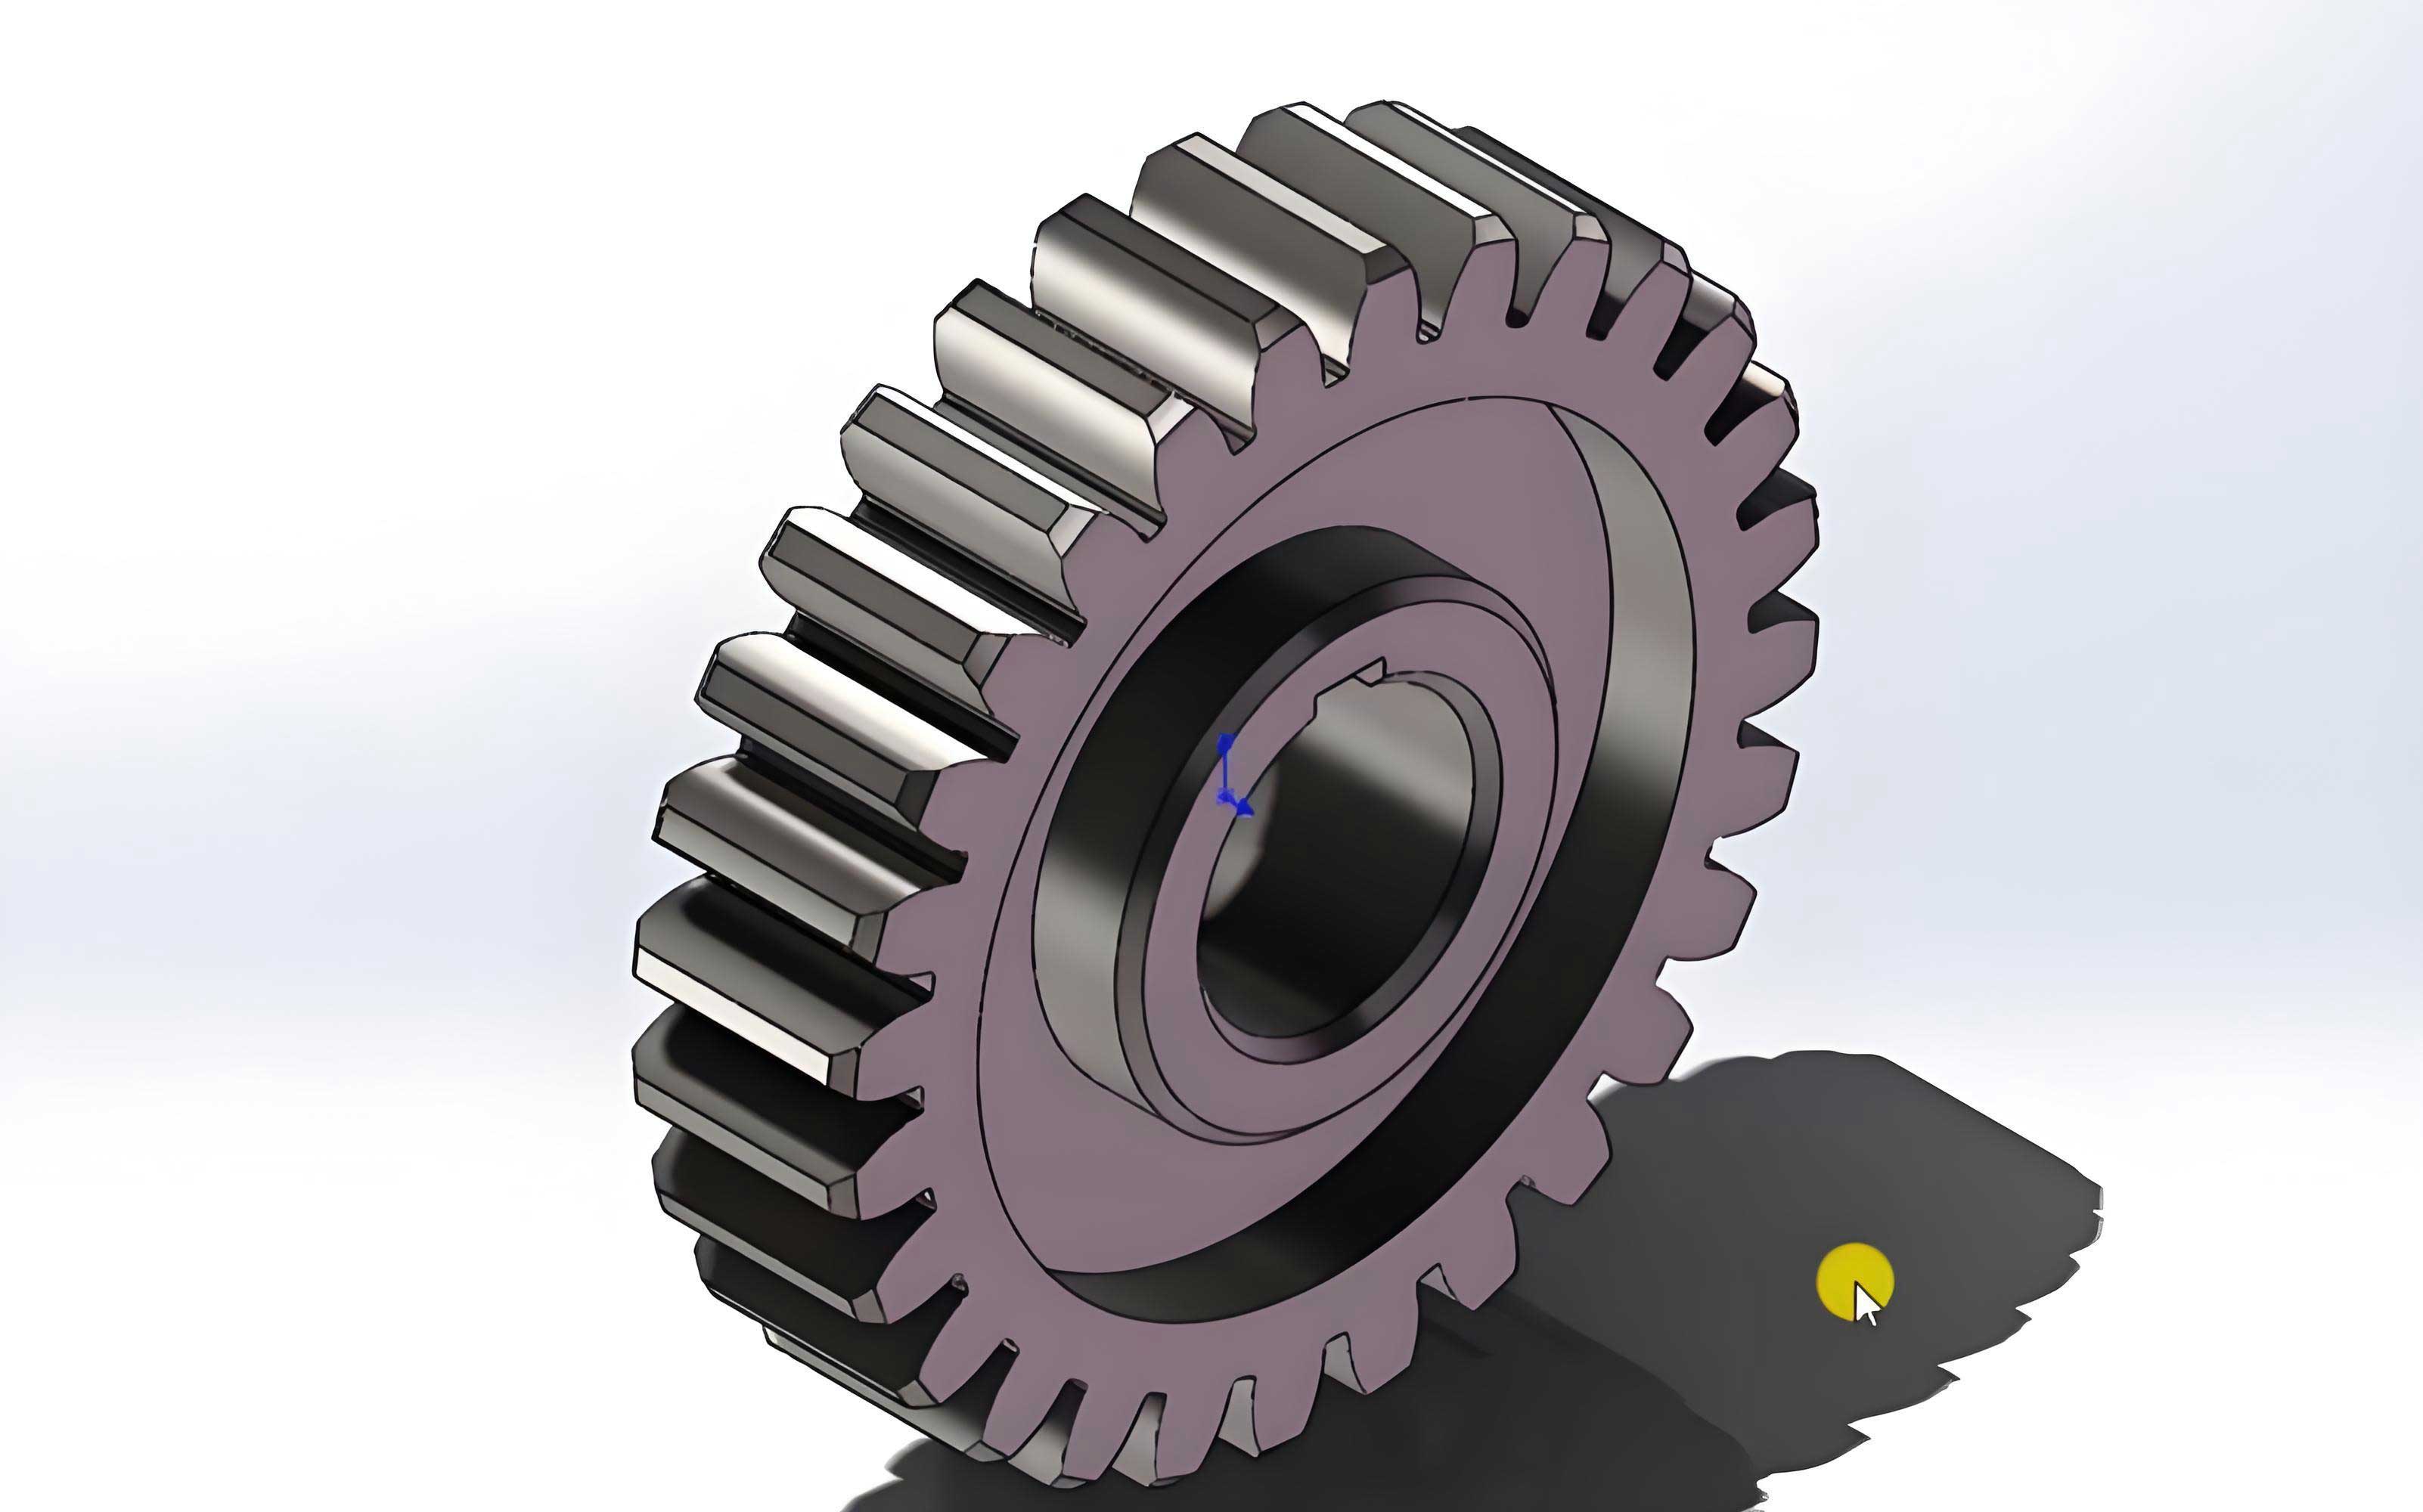
In the early part of my work, I improved the analytical stiffness model of a healthy spur gear. The traditional potential-energy method treats the tooth as a cantilever beam fixed at the base circle, and the total stored energy contains Hertzian contact energy, bending energy, shear energy and axial compression energy. However, this conventional model neglects the energy stored between the base circle and the root circle. In addition, the Hertzian contact stiffness is commonly expressed as a constant linear stiffness, although the actual gear contact force is nonlinear. I therefore adopted a nonlinear Hertzian contact stiffness and classified the tooth model according to whether the number of teeth is smaller than or larger than 42. This number is the theoretical gear-tooth number at which the base circle and root circle coincide.
2 Improved Time-Varying Mesh Stiffness of Spur Gear
The potential-energy method is the foundation of my TVMS calculation. For one meshing tooth pair, the total energy can be written as
$$U = U_h + U_b + U_s + U_a + U_f,$$
where \(U_h\) is the Hertzian contact energy, \(U_b\) is the bending energy, \(U_s\) is the shear energy, \(U_a\) is the axial compression energy and \(U_f\) is the gear-body or fillet-foundation energy. The corresponding stiffness values are defined by
$$U_h = \frac{F^2}{2 k_h}, \quad U_b = \int_0^d \frac{[F_b(d-x)-F_a h]^2}{2 E I_x} dx,$$
$$U_s = \int_0^d \frac{1.2 F^2}{2 G A_x} dx, \quad U_a = \int_0^d \frac{F^2}{2 E A_x} dx,$$
where \(F\) is the mesh force, \(F_b\) and \(F_a\) are its horizontal and vertical components, \(d\) is the distance from the tooth root to the contact point, \(h\) is the distance from the tooth centre line to the contact point, \(E\) is Young’s modulus, \(G\) is the shear modulus, \(I_x\) is the area moment of inertia, and \(A_x\) is the cross-sectional area at distance \(x\) from the root. These energy expressions lead to
$$\frac{1}{k_b} = \int_0^d \frac{[F_b(d-x)-F_a h]^2}{E I_x} dx, \quad \frac{1}{k_s} = \int_0^d \frac{1.2}{G A_x} dx, \quad \frac{1}{k_a} = \int_0^d \frac{1}{E A_x} dx.$$
The traditional linear Hertzian contact stiffness of a spur gear pair is
$$k_h = \frac{\pi E L}{4(1-\nu^2)},$$
where \(L\) is the face width and \(\nu\) is Poisson’s ratio. In practice, however, the contact compliance of gear teeth is load-dependent. I therefore replaced the constant expression by the nonlinear formula
$$k_{hi} = \frac{E^{0.9} L^{0.8} F_i^{0.1}}{1.275},$$
where \(k_{hi}\) is the nonlinear Hertzian stiffness of the \(i\)-th meshing tooth pair and \(F_i\) is the corresponding mesh force. This modification is important for both healthy and faulted spur gear stages.
For a spur gear with fewer than 42 teeth, the root circle is smaller than the base circle. I used a refined cantilever model that includes the region between the base circle and root circle. The half-tooth thickness \(h_x\), the distance \(d\), and the section parameters are functions of the gear rotation angle \(a\). The geometrical parameters can be expressed using the base radius \(R_b\), root radius \(R_r\), pressure angle \(a_0\), tooth number \(z\), half-tooth angles on the base circle \(a_2\) and root circle \(a_3\), and the auxiliary angle \(a_1\). The resulting bending, shear and axial compression stiffness formulas were integrated over the tooth profile. For the case \(z<42\), the bending stiffness has the form
$$k_b = \frac{1}{\displaystyle \int_{a_1}^{a_2} \frac{3(1+\cos a_1[(a_2-a)\sin a-\cos a])^2(a_2-a)\cos a}{E L \{2[\sin a+(a_2-a)\cos a]^3\}} da + \int_{a_0}^{a_1} \cdots da}.$$
For a spur gear with more than 42 teeth, the root circle lies outside the base circle. In that case I removed the energy that should not be counted between the base circle and root circle. The half-tooth thickness is
$$h_x = R_b[(a_2-a)\cos a+\sin a],$$
and the corresponding bending, shear and axial compression stiffness formulas were again derived by integrating the potential-energy expressions along the tooth height. The general analytical form for the bending stiffness is
$$k_b = \int_{a_4}^{a_1} \frac{3\{1+\cos a_1[(a_2-a)\sin a-\cos a]\}^2}{E L [\sin a+(a_2-a)\cos a]^3} da,$$
where \(a_4\) is the pressure angle at the point where the tooth profile meets the root circle.
In addition to the tooth deformation, the gear body deformation must be included. I employed the elastic ring theory to calculate the fillet-foundation stiffness:
$$\frac{1}{k_f} = \frac{\cos^2 a_m}{E L}\left(\frac{u_f}{S_f}\right)^2 \left[L^*\left(\frac{u_f}{S_f}\right)^2 + M^*\left(\frac{u_f}{S_f}\right)+P^*(1+\tan^2 a_m)+Q^* \tan^2 a_m\right],$$
where \(a_m\) is the pressure angle at the load point, \(u_f\) is the distance from the tooth root to the load point, \(S_f\) is the root arc length, and \(L^*,M^*,P^*,Q^*\) are polynomial coefficients. The coefficients are functions of the gear hub-to-root ratio and the root half-angle. I listed the numerical coefficients used in my calculation in Table 1.
| Coefficient | \(A_i\) | \(B_i\) | \(C_i\) | \(D_i\) | \(E_i\) | \(F_i\) |
|---|---|---|---|---|---|---|
| \(L^*\) | \(-5.574\times10^{-5}\) | \(-1.9986\times10^{-3}\) | \(-2.3015\times10^{-4}\) | \(4.7702\times10^{-3}\) | \(0.0271\) | \(6.8045\) |
| \(M^*\) | \(60.111\times10^{-5}\) | \(-28.100\times10^{-3}\) | \(-83.431\times10^{-4}\) | \(-9.9256\times10^{-3}\) | \(0.1624\) | \(0.9086\) |
| \(P^*\) | \(-50.952\times10^{-5}\) | \(185.50\times10^{-3}\) | \(0.0538\times10^{-4}\) | \(53.3\times10^{-3}\) | \(0.2895\) | \(0.9236\) |
| \(Q^*\) | \(-6.2042\times10^{-5}\) | \(9.0889\times10^{-3}\) | \(-4.0964\times10^{-4}\) | \(7.8297\times10^{-3}\) | \(-0.1472\) | \(0.6904\) |
A particularly important improvement in my work concerns the double-tooth engagement zone. During double-tooth meshing, the two pairs of teeth share the same gear body. The traditional approach simply adds the two fillet-foundation stiffness values, which overestimates the total stiffness in the double-tooth zone. I introduced a correction coefficient \(\lambda\) obtained from a finite-element torsional model. The corrected fillet-foundation stiffness \(K_f\) is
$$K_f = \begin{cases} k_f, & \text{single-tooth zone}, \\ \lambda k_f, & \text{double-tooth zone}. \end{cases}$$
With the improved nonlinear contact stiffness and the corrected foundation stiffness, the total TVMS of a healthy spur gear pair can be written as
$$\frac{1}{k_{total}} = \sum_{i=1}^{n} \left(\frac{1}{k_{hi}}+\frac{1}{k_{bi}}+\frac{1}{k_{si}}+\frac{1}{k_{ai}}+\frac{1}{K_{fi}}\right),$$
where \(n=1\) for single-tooth contact and \(n=2\) for double-tooth contact. I validated this improved algorithm against a three-dimensional finite-element model built in COMSOL. The gear pair parameters used in the validation are given in Table 2.
| Parameter | Pinion | Gear |
|---|---|---|
| Tooth number | 19 | 48 |
| Module (mm) | 3.175 | 3.175 |
| Pressure angle (°) | 20 | 20 |
| Face width (mm) | 16 | 16 |
| Young’s modulus (Pa) | \(2.068\times10^{11}\) | \(2.068\times10^{11}\) |
| Poisson’s ratio | 0.3 | 0.3 |
| Hub bore radius (mm) | 17 | 43 |
The finite-element model used free tetrahedral elements with local mesh refinement around the meshing zone. The gear-body elasticity was retained, and the mesh stiffness was obtained from the torsional angle. The improved potential-energy method agreed well with the finite-element result, whereas the traditional linear-contact method produced a visible error, especially in the double-tooth zones. This confirmed that the nonlinear contact stiffness and corrected foundation stiffness are necessary for accurate spur gear TVMS prediction.
3 Single-Fault Spur Gear Time-Varying Meshing Stiffness
After improving the healthy spur gear stiffness calculation, I extended the model to two common gear faults: tooth root crack and tooth-surface pitting. Both faults can seriously affect the load-carrying capacity and vibration behaviour of a spur gear. I used a straight-line crack path, because previous studies have shown that a straight crack approximation gives very similar results to a curved crack for TVMS calculation. The crack was assumed to incline at 45° to the tooth centre line and to propagate from the fillet region toward the tooth centre. Four crack depths were studied: 10% (0.53 mm), 30% (1.60 mm), 50% (2.66 mm) and 70% (3.72 mm).
3.1 Cracked Spur Gear Stiffness
For a cracked tooth, the effective cross-section area and moment of inertia are reduced. I classified the crack propagation into four cases according to the crack-tip position. In the first case, the crack tip is above the tooth centre line and the contact point is outside the crack region. The effective area and inertia are
$$A_x = \begin{cases} L(h_a + h_x), & x \le d_l, \\ 2L h_x, & x > d_l, \end{cases}$$
$$I_x = \begin{cases} \dfrac{L(h_a + h_x)^3}{12}, & x \le d_l, \\[4pt] \dfrac{L(2h_x)^3}{12}, & x > d_l, \end{cases}$$
where \(h_a\) is the distance from the crack tip to the tooth centre line, and \(d_l\) is the distance from the root to the crack-tip equivalent point. Substituting these expressions into the bending and shear energy formulas gives the cracked bending stiffness and shear stiffness. As the crack grows deeper, the crack tip crosses the centre line and the effective section becomes even smaller. The formulas for the third and fourth cases follow from the same procedure but with the cracked region represented by \(h_l\), the distance from the lower crack tip to the tooth centre line.
The crack not only affects the tooth deformation but also changes the fillet-foundation stiffness. Because the crack reduces the effective root arc, I modified the geometric parameters \(u_f\) and \(S_f\) in the foundation stiffness formula. The crack-foundation stiffness expression retains the same coefficient form but uses the reduced geometrical quantities. I compared the predicted TVMS with finite-element results for all four crack depths. The analytical curves matched the finite-element curves well. The results show that as the crack depth increases, the spur gear mesh stiffness drops rapidly. The stiffness drop becomes larger as the contact point moves from the tooth root toward the tooth tip, because the effective tooth section becomes smaller near the tip. For 70% crack depth, the single-tooth zone stiffness is very low, which indicates a high risk of tooth fracture.
3.2 Pitted Spur Gear Stiffness
Pitting is another common failure mode of spur gears, especially when the oil film breaks down under heavy load. I modelled pitting as circular pits of diameter 2 mm and depth 1 mm. The pits are placed along the pitch line, and the fault severity is controlled by the number of pits: 4 pits for slight pitting, 7 pits for moderate pitting, and 14 pits for severe pitting. In the severe case, an additional row of pits extends toward the tooth tip.
Pitting reduces the contact width, the cross-section area and the second moment of area. For a pit of radius \(r\) and depth \(h_p\), with centre located at distance \(u\) from the tooth root, the reduction of contact width is
$$\Delta L_x = \begin{cases} 2\sqrt{r^2-(u-x)^2}, & x \in [u-r, u+r], \\ 0, & \text{otherwise}, \end{cases}$$
and the corresponding reduction of section area is
$$\Delta A_x = \begin{cases} L_p h_p, & x \in [u-r, u+r], \\ 0, & \text{otherwise}. \end{cases}$$
Using these reductions, I computed the reduced inertia \(\Delta I_x\) and then substituted the effective area and inertia into the potential-energy formulas. The nonlinear contact stiffness also changes because the contact width becomes \(L-\sum \Delta L_x\). I derived pitted spur gear stiffness formulas for both \(z<42\) and \(z>42\) cases. The finite-element validation for the pitted gears showed good agreement. The results indicated that pitting on the pitch line causes a clear local stiffness reduction around the pitch point. As the number of pits increases, the stiffness reduction extends over a larger angular range and becomes more severe. The severe pitting case also affects the second double-tooth engagement zone, because the second row of pits reaches the tooth-tip side.
4 Crack-Pitting Compound Fault of Spur Gear
In heavy-load and poor-lubrication conditions, a tooth root crack and tooth-surface pitting often occur on the same spur gear tooth. I therefore developed a compound-fault single-tooth model that combines a straight crack and a row of circular pits. The key issue is to determine the effective failure region formed by the interaction of the two damage types. I divided the evolution of the compound-fault region into four situations. When the crack is shallow, the crack failure region overlaps only part of the pitting region. When the crack depth reaches about 30%, the crack-tip plane intersects the bottom plane of the pitting, and the compound failure region can be divided into an unchanged crack portion and an overlapping portion. When the crack is very deep, the crack failure region completely covers the pitting failure region, so the bending and shear stiffness are controlled mainly by the crack.
Using this compound-fault model, I derived the bending and shear stiffness formulas in the compound-fault region. For a spur gear with fewer than 42 teeth and a 10% crack combined with slight pitting, the bending stiffness in the compound region can be written as
$$k_{bc} = \int_{a_l}^{a_{h1}} \frac{12\left[1+\cos a_1((a_2-a)\sin a-\cos a)\right]^2(a_2-a)\cos a}{E L\left(2[\sin a+(a_2-a)\cos a]^3 – \dfrac{3\Delta I_x}{R_b^3}\right)} da,$$
where \(a_{h1}\) and \(a_{h2}\) are the angular boundaries of the pitting, and \(a_l\) is the angular coordinate corresponding to the crack tip. For a 30% crack, the intersection angle \(a_p\) between the crack-tip plane and the pit bottom was calculated as
$$a_p = 0.3163 \ \text{rad}.$$
The compound stiffness for 30% crack plus pitting is then obtained by integrating from \(a_p\) to \(a_{h2}\) with the reduced section properties. For 50% and 70% cracks, the crack covers the pitting region, so the compound failure region follows the cracked tooth model. For spur gear teeth with more than 42 teeth, I used the corresponding \(h_x\) expression and derived similar formulas. For example, the bending stiffness for a 10% crack plus pitting in a \(z>42\) spur gear is
$$k_{bc} = \int_{a_l}^{a_{h1}} \frac{12\left[1+\cos a_1((a_2-a)\sin a-\cos a)\right]^2}{E L\left(\dfrac{2.5}{z}[\sin a+\sin a_1((a_2-a)\cos a-\sin a)]^3 – \dfrac{3\Delta I_x}{R_b^3}\right)} da.$$
To validate these formulas, I built three-dimensional finite-element models of the compound-fault spur gear. I compared the analytical and finite-element TVMS curves for several combinations, including 10% crack with slight pitting, 50% crack with moderate pitting, and 70% crack with severe pitting. The analytical curves and finite-element curves were in close agreement. The largest local differences appeared at the transition between single-tooth and double-tooth zones, where the finite-element model displayed an extended tooth-contact effect due to gear-body elasticity. Table 3 summarizes the percentage differences between the proposed analytical method and the finite-element method at two selected rotation angles: \(\theta=1.94^\circ\) in the first double-tooth zone and \(\theta=5.24^\circ\) in the single-tooth zone.
| Fault combination | Q point error (%) | P point error (%) |
|---|---|---|
| Healthy | 0.27 | 0.46 |
| 4 pits + 10% crack | 0.84 | 1.05 |
| 7 pits + 30% crack | 0.28 | 1.52 |
| 14 pits + 50% crack | 1.19 | 2.78 |
| 14 pits + 70% crack | 1.39 | 1.82 |
In Table 3, the maximum error is below 3%, which confirms that the proposed compound-fault stiffness model is accurate for engineering analysis. I also compared my analytical results with a published laser-displacement experimental result for a cracked spur gear. The proposed method agreed with the measured data better than a conventional finite-element result, especially in the single-tooth zone. This further supports the validity of the nonlinear contact stiffness and the corrected foundation stiffness used in my model.
After validating the compound-fault stiffness formulas, I compared all 12 compound-fault combinations with the single-fault and healthy spur gear stiffness values. Several important trends were observed. First, the compound-fault stiffness is always lower than the stiffness of either single fault alone when the two fault severities are comparable. Second, when the crack is shallow, the pitting has a dominant influence in the pitch-line region. Third, when the crack depth reaches 70%, the crack dominates the stiffness reduction, and the additional effect of pitting becomes very small. Fourth, severe pitting affects the second double-tooth zone because the pits extend toward the tooth tip. These results show that the interaction between crack and pitting cannot be neglected when both defects coexist on the same spur gear tooth.
5 Dynamic Response of Spur Gear with Compound Fault
To study the dynamic behaviour of the compound-fault spur gear, I built an idealized 8-degree-of-freedom lumped-parameter model. The model includes a driving motor, input shaft, driving gear, driven gear, output shaft and load. The gear mesh is represented by a time-varying stiffness element \(k_t\) and a mesh damping element \(c_t\). The bearings are modelled by equivalent stiffness and damping in the \(x\) and \(y\) directions. Since a spur gear does not generate axial force, axial motion was not considered. I neglected backlash, friction and manufacturing errors in order to focus on the effect of mesh stiffness excitation.
The equations of motion of the spur gear-rotor system are
$$m_1 \ddot{x}_1 + c_{x1}\dot{x}_1 + k_{x1}x_1 = 0,$$
$$m_2 \ddot{x}_2 + c_{x2}\dot{x}_2 + k_{x2}x_2 = 0,$$
$$m_1 \ddot{y}_1 + c_t(\dot{y}_1-\dot{y}_2+R_{b1}\dot{\theta}_1-R_{b2}\dot{\theta}_2) + k_t(y_1-y_2+R_{b1}\theta_1-R_{b2}\theta_2)=0,$$
$$m_2 \ddot{y}_2 – c_t(\dot{y}_1-\dot{y}_2+R_{b1}\dot{\theta}_1-R_{b2}\dot{\theta}_2) – k_t(y_1-y_2+R_{b1}\theta_1-R_{b2}\theta_2)=0,$$
$$I_1 \ddot{\theta}_1 + c_t R_{b1}(\dot{y}_1-\dot{y}_2+R_{b1}\dot{\theta}_1-R_{b2}\dot{\theta}_2) + k_t R_{b1}(y_1-y_2+R_{b1}\theta_1-R_{b2}\theta_2) = c_p(\dot{\theta}_m-\dot{\theta}_1)+k_p(\theta_m-\theta_1),$$
$$I_2 \ddot{\theta}_2 – c_t R_{b2}(\dot{y}_1-\dot{y}_2+R_{b1}\dot{\theta}_1-R_{b2}\dot{\theta}_2) – k_t R_{b2}(y_1-y_2+R_{b1}\theta_1-R_{b2}\theta_2) = -c_g(\dot{\theta}_2-\dot{\theta}_b)-k_g(\theta_2-\theta_b),$$
$$I_m \ddot{\theta}_m + c_p(\dot{\theta}_m-\dot{\theta}_1)+k_p(\theta_m-\theta_1)=T_p,$$
$$I_b \ddot{\theta}_b + c_g(\dot{\theta}_b-\dot{\theta}_2)+k_g(\theta_b-\theta_2)=-T_g.$$
In these equations, \(m_1\) and \(m_2\) are the masses of the driving and driven gears, \(I_1\) and \(I_2\) are their moments of inertia, \(I_m\) and \(I_b\) are the motor and load inertias, \(k_p\) and \(k_g\) are the shaft torsional stiffness values, \(c_p\) and \(c_g\) are the shaft damping values, \(T_p\) is the input torque and \(T_g\) is the load torque. The equivalent bearing stiffness and damping in the radial directions are \(k_r\) and \(c_r\). The system parameters are listed in Table 4.
| Parameter | Symbol | Value |
|---|---|---|
| Driving gear mass (kg) | \(m_1\) | 2.88 |
| Driven gear mass (kg) | \(m_2\) | 0.96 |
| Input torque (N·m) | \(T_p\) | 30.06 |
| Load torque (N·m) | \(T_g\) | 11.90 |
| Motor frequency (Hz) | \(f_1\) | 20 |
| Mesh frequency (Hz) | \(f_m\) | 960 |
| Motor inertia (kg·m²) | \(I_m\) | 0.0021 |
| Driving gear inertia (kg·m²) | \(I_1\) | \(4.3659\times10^{-4}\) |
| Driven gear inertia (kg·m²) | \(I_2\) | \(8.3602\times10^{-4}\) |
| Load inertia (kg·m²) | \(I_b\) | 0.0105 |
| Bearing stiffness (N/m) | \(k_r\) | \(6.56\times10^7\) |
| Shaft torsional stiffness (N·m/rad) | \(k_s\) | \(4.4\times10^4\) |
| Bearing damping (N·s/m) | \(c_r\) | \(1.8\times10^5\) |
| Shaft damping (N·s/m) | \(c_s\) | \(5.0\times10^5\) |
I substituted the compound-fault TVMS into the dynamic model and solved the equations with MATLAB using the ode15s solver. From the simulated responses, I obtained time-domain vibration displacement and vibration acceleration signals. For a healthy spur gear, the time-history signals are uniform and periodic. For a compound-fault spur gear, periodic impacts appear at the rotation frequency of the faulty tooth. The amplitude of these impacts increases with crack depth. In the case of 10% crack combined with slight pitting, the impact is weak but still visible. When the crack depth reaches 50% or 70%, the vibration amplitude becomes much larger, reflecting the severe loss of local mesh stiffness.
I compared the maximum time-domain vibration values for the healthy and compound-fault spur gear cases in Table 5. It is clear that for a fixed pitting level, both displacement and acceleration amplitudes increase with crack depth. For a fixed crack depth, increasing the number of pits from 4 to 7 also produces a noticeable increase. However, changing from moderate pitting to severe pitting does not change the amplitudes as much, because the number of pits on the pitch line remains the same; the additional pits near the tooth tip have a smaller influence on the mesh stiffness at the pitch line.
| Case | Displacement (μm) | Acceleration (m/s²) | Displacement (μm) | Acceleration (m/s²) | Displacement (μm) | Acceleration (m/s²) |
|---|---|---|---|---|---|---|
| Slight pitting | Moderate pitting | Severe pitting | ||||
| Healthy | 0.06 | 8.43 | — | — | — | — |
| 10% crack | 0.07 | 9.25 | 0.16 | 18.82 | 0.17 | 19.65 |
| 30% crack | 0.12 | 15.22 | 0.25 | 29.49 | 0.27 | 30.81 |
| 50% crack | 0.35 | 36.70 | 0.38 | 38.84 | 0.38 | 39.76 |
| 70% crack | 0.65 | 56.14 | 1.08 | 59.75 | 1.20 | 62.90 |
I also transformed the time-domain signals into the frequency domain by using the fast Fourier transform. Healthy spur gear spectra contain the mesh frequency \(f_m\) and its harmonics, but no significant sidebands. Once the gear has a crack-pitting compound fault, sidebands appear around the mesh frequency and its harmonics. The sideband spacing is equal to the input shaft frequency \(f_i=20\) Hz. The number and amplitude of these sidebands increase with crack depth. I selected the sideband amplitude at 1857 Hz, which lies near \(2f_m\), as a quantitative indicator. Table 6 lists this sideband amplitude for the 12 compound-fault combinations.
| Crack depth | Slight pitting displacement | Slight pitting acceleration | Moderate pitting displacement | Moderate pitting acceleration | Severe pitting displacement | Severe pitting acceleration |
|---|---|---|---|---|---|---|
| 10% | 0.002 | 0.268 | 0.004 | 0.419 | 0.005 | 0.494 |
| 30% | 0.003 | 0.439 | 0.006 | 0.741 | 0.007 | 0.795 |
| 50% | 0.009 | 0.471 | 0.010 | 1.056 | 0.012 | 1.057 |
| 70% | 0.019 | 1.665 | 0.030 | 1.793 | 0.032 | 2.189 |
The frequency-domain results are useful, but they are still not sufficient to distinguish all 12 compound-fault combinations. In particular, the moderate-pitting and severe-pitting groups have very similar spectra. To solve this problem, I introduced three statistical indicators: crest factor, skewness and sideband index. These indicators are defined as follows:
$$\text{Crest factor} = \frac{\max|x_i|}{\displaystyle \sqrt{\frac{1}{N}\sum_{i=1}^{N}x_i^2}},$$
$$\text{Skewness} = \frac{\displaystyle \frac{1}{N}\sum_{i=1}^{N}(x_i-\bar{x})^3}{\displaystyle \left[\frac{1}{N}\sum_{i=1}^{N}(x_i-\bar{x})^2\right]^{3/2}},$$
$$\text{Sideband index} = \frac{1}{M}\sum_{k=1}^{M}|X(k)|,$$
where \(x_i\) is the time-domain signal, \(N\) is the number of samples, \(\bar{x}\) is the mean, and \(X(k)\) is the amplitude of the first-order sidebands around the mesh frequency in the frequency domain. I calculated these indicators for both vibration displacement and vibration acceleration signals. The results showed that the skewness indicator is not reliable for every fault combination: for 50% crack with moderate pitting and 50% crack with severe pitting, the skewness values are too close to be distinguished. In contrast, the crest factor and sideband index increase monotonically as the fault severity increases, and they can separate the 12 compound-fault combinations much more clearly.
Tables 7 and 8 summarize the percentage changes of the statistical indicators relative to the healthy spur gear values. In Table 7, the displacement crest factor changes from 1% for slight pitting with 10% crack to 26% for severe pitting with 70% crack. The displacement skewness is more sensitive but sometimes ambiguous. In Table 8, the acceleration crest factor changes from 8.9% to 263%, and the acceleration skewness also increases, but with a non-monotonic pattern in some cases. Therefore, I concluded that the crest factor and sideband index are more suitable for the quantitative diagnosis of spur gear crack-pitting compound faults.
| Fault combination | Crest factor change (%) | Skewness change (%) |
|---|---|---|
| 4 pits + 10% crack | 1 | 50 |
| 4 pits + 30% crack | 2 | 550 |
| 4 pits + 50% crack | 7 | 800 |
| 4 pits + 70% crack | 14 | 3100 |
| 7 pits + 10% crack | 2.6 | 300 |
| 7 pits + 30% crack | 4.5 | 750 |
| 7 pits + 50% crack | 7.6 | 1850 |
| 7 pits + 70% crack | 24 | 3600 |
| 14 pits + 10% crack | 3 | 600 |
| 14 pits + 30% crack | 5.2 | 1050 |
| 14 pits + 50% crack | 8.3 | 1900 |
| 14 pits + 70% crack | 26 | 4000 |
| Fault combination | Crest factor change (%) | Skewness change (%) |
|---|---|---|
| 4 pits + 10% crack | 8.9 | 3.4 |
| 4 pits + 30% crack | 71.5 | 3.7 |
| 4 pits + 50% crack | 196 | 36.2 |
| 4 pits + 70% crack | 226 | 80.7 |
| 7 pits + 10% crack | 104 | 23.4 |
| 7 pits + 30% crack | 192 | 53.5 |
| 7 pits + 50% crack | 220 | 73.6 |
| 7 pits + 70% crack | 246 | 297 |
| 14 pits + 10% crack | 110 | 46.6 |
| 14 pits + 30% crack | 204 | 59.3 |
| 14 pits + 50% crack | 235 | 81.2 |
| 14 pits + 70% crack | 263 | 150 |
From an engineering point of view, these statistical indicators can be used to build a reference interval for each spur gear compound-fault level. Once a sensor measures a crest factor or sideband index that falls inside a fault interval, the maintenance team can identify the fault combination and schedule repair before a catastrophic failure occurs. This is especially useful for early fault detection, because the time-domain waveform alone may not clearly distinguish moderate and severe pitting when the crack depth is large.
6 Conclusion and Outlook
In my research, I systematically studied the mesh stiffness and dynamic features of a spur gear with crack-pitting compound faults. The main conclusions can be summarized as follows.
First, the improved TVMS model of a healthy spur gear, which uses nonlinear Hertzian contact stiffness and a corrected fillet-foundation stiffness, gives much better accuracy than the traditional linear-contact method. The finite-element validation shows that the maximum error of the improved model is less than 3% for healthy and faulted gears.
Second, both crack and pitting reduce the TVMS of a spur gear in different ways. A root crack causes the stiffness to decrease gradually over the meshing cycle, with the largest reduction in the single-tooth zone. Pitting causes a local stiffness drop around the pitch line, and severe pitting also affects the second double-tooth zone. The compound-fault stiffness is lower than the single-fault stiffness when the two faults have comparable severity, and the fault interaction depends strongly on the ratio of crack depth to pitting area.
Third, the 8-degree-of-freedom spur gear-rotor dynamic model successfully reproduces the vibration response caused by the compound faults. The time-domain impact amplitude and the frequency-domain sideband amplitudes both increase with crack depth, but they cannot reliably distinguish moderate and severe pitting in all cases.
Fourth, the crest factor and sideband index are reliable statistical indicators for quantitative fault diagnosis. They can separate the 12 compound-fault combinations studied in this work and can be used as reference features for online monitoring of spur gear systems.
In future work, I plan to include friction, gear backlash and tooth surface roughness in the dynamic model. I also plan to use a random pitting distribution instead of a regular circular-pit arrangement, and to investigate the influence of crack propagation path on the dynamic response of the spur gear. Experimental validation using a gear test rig will be another important step to further confirm the proposed method.