
1. Introduction
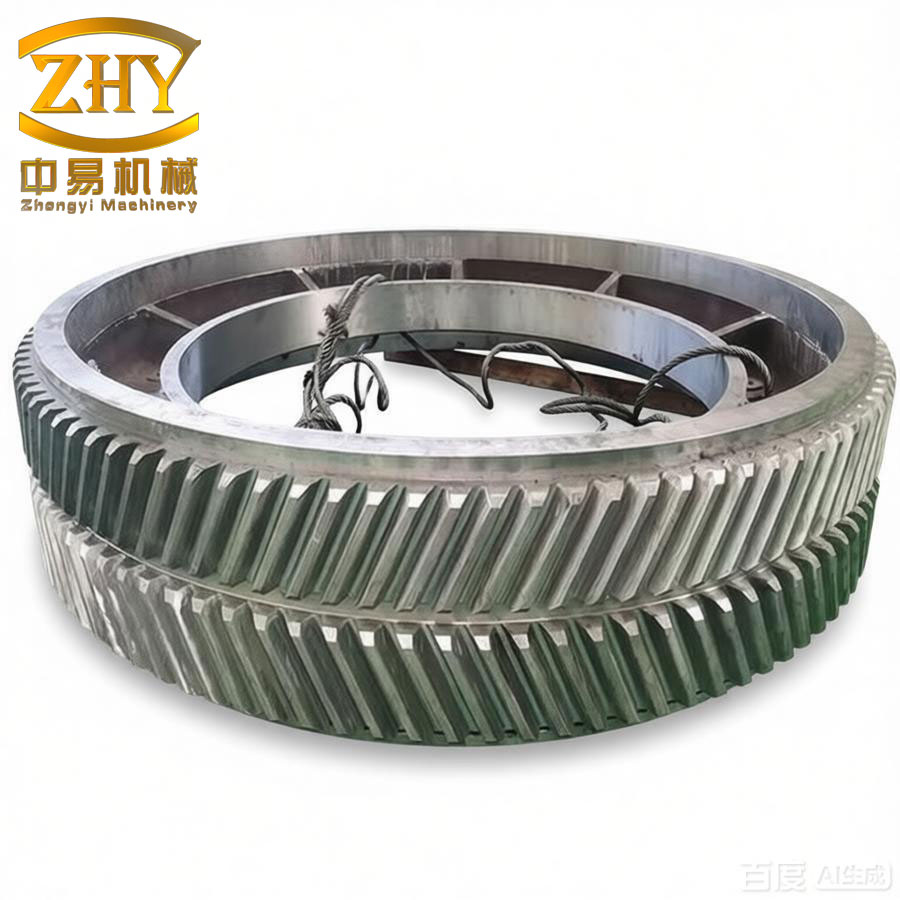
Herringbone gears are widely employed in high-speed, precision, and heavy-load transmission systems across automotive, aerospace, mining machinery, and marine applications due to their compact structure, negligible axial force, high load-carrying capacity, and superior transmission efficiency. In the realm of aero-engine power transmission, the herringbone gear planetary reduction system serves as a critical component, where the meshing efficiency directly influences fuel consumption and operational reliability. As rotational speeds and transmitted loads continue to escalate, the influence of tooth surface microscale morphology on the lubricating state and friction behavior between contacting teeth has become increasingly significant.
Traditional gear efficiency models often assume perfectly smooth contacting surfaces and rely on fully elastohydrodynamic lubrication (EHL) theory. However, real machined gear surfaces possess inherent roughness, waviness, and manufacturing-induced textures that fundamentally alter the lubrication regime, shifting the contact from full-film EHL to mixed or even boundary lubrication in localized regions. This transition significantly affects friction coefficient, power loss, and consequently the meshing efficiency of the herringbone gear pair. Therefore, incorporating the actual microscale morphology of tooth surfaces into the efficiency calculation framework is essential for accurate performance prediction and optimization.
This study focuses on the external meshing pair of an aero-engine herringbone planetary transmission system. The primary objectives are to:
- Develop a 16-degree-of-freedom (DOF) dynamic model of the herringbone gear external meshing pair that incorporates tooth surface friction.
- Establish a mixed lubrication friction coefficient model combining boundary and elastohydrodynamic lubrication contributions.
- Extract real tooth surface microscale morphology from gear samples of different manufacturing precision grades (grades 5, 6, and 7) using laser confocal microscopy.
- Investigate the effects of gear precision, input speed, and microscale morphology on lubrication state and power loss characteristics.
- Perform comprehensive tooth surface modification using a genetic algorithm to optimize transmission error, contact stress distribution, and meshing efficiency.
2. Dynamic Modeling of Herringbone Gear Meshing Pair
2.1 Meshing Characteristics of Herringbone Gear
The herringbone gear can be conceptually regarded as two opposite-handed helical gears joined together. Unlike spur gears, the contact lines of herringbone gears are inclined at the helix angle \(\beta\), resulting in a time-varying contact line length during the meshing cycle. The engagement begins at one end of the tooth flank and progressively transitions to the other end, with the contact line length first increasing, then maintaining a constant maximum value, and finally decreasing to zero upon disengagement.
For the \(i\)-th pair of teeth in contact, the position along the line of action can be expressed as:
$$
s_i = \text{mod}\left[r_{b1} w_1 t + (i-1) p_{bt}, p_{bt}\right]
$$
where \(w_1\) is the angular velocity of the driving gear, \(r_{b1}\) is the base circle radius of the driving gear, and \(p_{bt}\) is the transverse base pitch.
The radius of curvature at an arbitrary point \(K\) along the contact line, located at distance \(l\) from the reference point B, is given by:
$$
\begin{aligned}
R_{K1} &= R_{t1} – l \sin\beta \\
R_{K2} &= R_{t2} + l \sin\beta
\end{aligned}
$$
The sliding velocities at point K for gears 1 and 2 are expressed as:
$$
v_{tK1} = w_1 r_{b1} \frac{\sin\alpha_{tK1}}{\cos\alpha_{tK1}} \cdot \frac{1}{\cos\beta}
$$
$$
v_{tK2} = w_2 r_{b2} \frac{\sin\alpha_{tK2}}{\cos\alpha_{tK2}} \cdot \frac{1}{\cos\beta}
$$
The relative sliding velocity \(v_{sK}\), rolling velocity \(v_{rK}\), entrainment velocity \(v_{eK}\), and slide-to-roll ratio \(SR_K\) at point K are:
$$
\begin{aligned}
v_{sK} &= v_{tK1} – v_{tK2} \\
v_{rK} &= v_{tK1} + v_{tK2} \\
v_{eK} &= \frac{v_{rK}}{2} \\
SR_K &= \frac{v_{sK}}{v_{rK}}
\end{aligned}
$$
2.2 Time-Varying Contact Line Length
The total contact line length of the herringbone gear is determined by the transverse contact ratio \(\varepsilon_a\) and the axial contact ratio \(\varepsilon_b\). Two cases must be considered:
Case 1: \(\varepsilon_a > \varepsilon_b\)
The contact line length of the \(i\)-th tooth pair is given by:
$$
L_i = \begin{cases}
\frac{b}{\cos\beta} \cdot \frac{\lambda}{p_{bt}}, & 0 < \lambda < \varepsilon_b p_{bt} \\
\frac{b}{\cos\beta}, & \varepsilon_b p_{bt} < \lambda < \varepsilon_a p_{bt} \\
\frac{b}{\cos\beta} \cdot \frac{l – \lambda}{l}, & \varepsilon_a p_{bt} < \lambda < l \\
0, & l < \lambda
\end{cases}
$$
Case 2: \(\varepsilon_a < \varepsilon_b\)
The contact line length is:
$$
L_i = \begin{cases}
\frac{b}{\cos\beta} \cdot \frac{\lambda}{\varepsilon_a p_{bt}}, & 0 < \lambda < \varepsilon_a p_{bt} \\
\frac{b}{\cos\beta}, & \varepsilon_a p_{bt} < \lambda < \varepsilon_b p_{bt} \\
\frac{b}{\cos\beta} \cdot \frac{l – \lambda}{(\varepsilon_b – \varepsilon_a) p_{bt}}, & \varepsilon_b p_{bt} < \lambda < l \\
0, & l < \lambda
\end{cases}
$$
The total contact line length for the herringbone gear is:
$$
L_{\text{total}} = 2 \sum_{i=1}^{N} L_i
$$
where \(N\) is the number of tooth pairs simultaneously in contact.
2.3 Sixteen-DOF Dynamic Model
Based on the concentrated mass method, a 16-DOF dynamic model of the herringbone gear external meshing pair was established. The model comprises the left active gear (gear 1), right active gear (gear 3), left driven gear (gear 2), and right driven gear (gear 4). The generalized displacement vector is:
$$
\mathbf{q} = [x_1, y_1, z_1, \theta_1, x_2, y_2, z_2, \theta_2, x_3, y_3, z_3, \theta_3, x_4, y_4, z_4, \theta_4]^T
$$
The dynamic equations, derived from Newton’s second law, are expressed as:
$$
\begin{aligned}
m_1 \ddot{x}_1 + c_{1x} \dot{x}_1 + k_{1x} x_1 &= F_{r1} \sin\beta + F_{fL} \cos\beta \\
m_1 \ddot{y}_1 + c_{1y} \dot{y}_1 + c_m \dot{y}_1 + k_{1y} y_1 + k_m y_1 &= F_{r1} \cos\beta + F_{fL} \sin\beta \\
m_1 \ddot{z}_1 + c_{1z} \dot{z}_1 + k_{1z} z_1 &= -F_{fL} \\
J_1 \ddot{\theta}_1 + T_{1} &= F_{r1} r_{b1} + M_{fL}
\end{aligned}
$$
where \(m_i\) is the mass of gear \(i\), \(J_i\) is the moment of inertia, \(k_{ix}, k_{iy}, k_{iz}\) are the support stiffnesses in the x, y, z directions, \(c_{ix}, c_{iy}, c_{iz}\) are the support damping coefficients, \(k_m\) is the meshing stiffness, \(c_m\) is the meshing damping, \(F_{ri}\) is the dynamic meshing force, and \(F_{fL}\) is the friction force on the left meshing pair.
The relative displacement along the line of action for the left and right meshing pairs is:
$$
\delta_{12} = (x_1 – x_2) \sin\beta + (y_1 – y_2) \cos\beta + (r_{b1}\theta_1 – r_{b2}\theta_2) \cos\beta – e_{12}
$$
$$
\delta_{34} = (x_3 – x_4) \sin\beta + (y_3 – y_4) \cos\beta + (r_{b3}\theta_3 – r_{b4}\theta_4) \cos\beta – e_{34}
$$
The dynamic meshing force is expressed as:
$$
F_p = k_m \delta + c_m \dot{\delta}
$$
2.4 Elimination of Rigid Body Displacement
The torsional displacements in the dynamic model contain rigid body modes, making the system of equations semi-definite. To resolve this issue, relative coordinates were introduced:
$$
\begin{aligned}
u_{12} &= r_{b1}\theta_1 + r_{b2}\theta_2 \\
u_{34} &= r_{b3}\theta_3 + r_{b4}\theta_4 \\
u_{13} &= r_{b1}\theta_1 + r_{b3}\theta_3 \\
u_{24} &= r_{b2}\theta_2 + r_{b4}\theta_4
\end{aligned}
$$
Furthermore, a dimensionless transformation was applied to normalize the equations. The dimensionless time is defined as \(\tau = w_n t\), where \(w_n = \sqrt{k_m / m_e}\) is the first non-zero natural frequency and \(m_e\) is the equivalent mass:
$$
m_e = \frac{I_1 I_2}{I_1 r_{b2}^2 + I_2 r_{b1}^2}
$$
The dimensionless displacement is defined as \(p = q / b_c\), where \(b_c = 10^{-5}\) m is the displacement scale. The final dimensionless dynamic equations were solved numerically using the fourth-order Runge-Kutta method (implemented via MATLAB’s ode45 function).
3. Mixed Lubrication Friction Coefficient Model
The friction coefficient between meshing gear teeth is a critical parameter governing power loss and efficiency. In this study, a mixed lubrication friction coefficient model was adopted, which combines the contributions of fully elastohydrodynamic lubrication (EHL) and boundary lubrication through a weighting function:
$$
\mu_{ML} = \lambda_f \mu_{FL} + (1 – \lambda_f) \mu_{DC}
$$
where \(\mu_{FL}\) is the EHL friction coefficient, \(\mu_{DC}\) is the boundary lubrication friction coefficient, and \(\lambda_f\) is the weighting factor.
The weighting factor depends on the film thickness ratio \(\lambda\):
$$
\lambda_f = 0.84 \lambda^{0.23}
$$
The film thickness ratio is defined as the ratio of minimum oil film thickness to the composite surface roughness:
$$
\lambda = \frac{h_{min}}{\sqrt{Ra_1^2 + Ra_2^2}}
$$
The EHL friction coefficient is calculated using the empirical formula proposed by Xu et al.:
$$
\mu_{FL} = e^{f(a,b_1,\ldots,b_9)} \cdot P_h^{b_4} \cdot SR^{b_5} \cdot V_e^{b_6} \cdot \nu_0^{b_7} \cdot R^{b_8}
$$
where:
$$
f = b_1 + b_2 SR + b_3 \log_{10}(\nu_0) + b_4 \log_{10}(P_h) + b_5 \log_{10}(SR \cdot V_e) + b_6 \log_{10}(P_h \cdot V_e) + b_7 \log_{10}(\nu_0 \cdot R \cdot V_e)
$$
The coefficients \(b_1\) through \(b_9\) are listed in the following table:
| Coefficient | \(b_1\) | \(b_2\) | \(b_3\) | \(b_4\) | \(b_5\) | \(b_6\) | \(b_7\) | \(b_8\) | \(b_9\) |
|---|---|---|---|---|---|---|---|---|---|
| Value | -8.916 | 1.033 | 1.036 | -0.354 | 2.812 | -0.100 | 0.752 | -0.390 | 0.620 |
The Hertzian contact stress in the friction coefficient model is:
$$
P_h = \sqrt{\frac{E’ q}{2\pi R}}
$$
where \(q\) is the normal load per unit length, \(E’\) is the equivalent elastic modulus, and \(R\) is the equivalent radius of curvature.
The boundary lubrication friction coefficient for steel alloys was taken as \(\mu_{DC} = 0.098\).
The relationship between the friction coefficient and slide-to-roll ratio was investigated. The friction coefficient initially increases with the slide-to-roll ratio, reaching a maximum at approximately \(SR = 0.2\), then gradually decreases. The mixed lubrication friction coefficient consistently exceeds the pure EHL friction coefficient, highlighting the substantial contribution of asperity contact in mixed lubrication regimes.
4. Power Loss and Efficiency Calculation
The instantaneous friction power loss of the herringbone gear meshing pair is calculated by integrating the product of friction force and sliding velocity along the contact line:
$$
P_f(t) = \sum_{i=1}^{n} \int_{l_i} \mu(x) q(x,t) v_s(x,t) \, ds
$$
The explicit form is:
$$
P_f(t) = \sum_{i=1}^{n} \left[ \int_{x_{ai1}}^{x_{bi1}} \frac{\mu(x) q(x,t) v_s(x,t)}{\cos\beta} \, dx + \int_{x_{ai2}}^{x_{bi2}} \frac{\mu(x) q(x,t) v_s(x,t)}{\cos\beta} \, dx \right]
$$
The average power loss over one meshing cycle is:
$$
\bar{P}_f = \frac{1}{T_m} \int_{t_1}^{t_1 + T_m} P_f(t) \, dt
$$
The meshing efficiency is then calculated as:
$$
\eta = \frac{P_{in} – \bar{P}_f}{P_{in}} \times 100\%
$$
The influence of Hertzian contact stress on meshing efficiency was analyzed. When the contact stress is below 352 MPa, the efficiency increases with increasing contact stress; beyond this threshold, the efficiency decreases. This non-monotonic behavior arises from the competing effects of contact stress on the EHL friction coefficient and the load-carrying capacity of the lubricant film.
5. Experimental Extraction of Tooth Surface Microscale Morphology
To obtain the real microscale morphology of herringbone gear tooth surfaces, an OLYMPUS OLS4000 laser confocal microscopy system was employed. This advanced system offers a magnification range of 108x to 17,280x and provides high-resolution three-dimensional surface topography measurements with sub-nanometer vertical resolution.
Gear samples of three manufacturing precision grades (5, 6, and 7) were selected for surface characterization. Nine measurement points were uniformly distributed along three contact lines (a, b, c) on the tooth flank of a single helical section of the herringbone gear. For each precision grade, the arithmetic mean surface roughness values were measured.
The measured surface roughness data for the three precision grades are summarized in the following tables:
| Point | 1 | 2 | 3 | 4 | 5 | 6 | 7 | 8 | 9 |
|---|---|---|---|---|---|---|---|---|---|
| Ra | 0.487 | 0.535 | 0.388 | 0.321 | 0.307 | 0.380 | 0.282 | 0.434 | 0.370 |
| Point | 1 | 2 | 3 | 4 | 5 | 6 | 7 | 8 | 9 |
|---|---|---|---|---|---|---|---|---|---|
| Ra | 0.485 | 0.773 | 0.667 | 0.997 | 0.797 | 0.731 | 0.667 | 1.205 | 1.461 |
| Point | 1 | 2 | 3 | 4 | 5 | 6 | 7 | 8 | 9 |
|---|---|---|---|---|---|---|---|---|---|
| Ra | 1.136 | 1.244 | 0.932 | 1.105 | 0.454 | 0.327 | 0.487 | 0.683 | 2.109 |
For comparison with the actual measured roughness, the theoretical roughness values recommended by gear manufacturing standards were also used: 0.4 μm for grade 5, 0.8 μm for grade 6, and 1.6 μm for grade 7.
6. Influence of Microscale Morphology on Friction Characteristics
6.1 Operating Conditions
The operating conditions for the simulation are listed below:
| Parameter | Value |
|---|---|
| Lubricant type | ISO VG 32 Mineral |
| Kinematic viscosity at 40°C | 30 mm²/s |
| Kinematic viscosity at 100°C | 5.2 mm²/s |
| Dynamic viscosity at 40°C | 26.31 mm²/s |
| Dynamic viscosity at 100°C | 4.56 mm²/s |
| Input speed (driving gear) | 7463 r/min |
| Input power | 4000 kW |
6.2 Minimum Oil Film Thickness
Dynamic simulations were performed using Romax Designer software to obtain the minimum oil film thickness between meshing teeth for different precision grades. The minimum film thickness increases with increasing input speed and exhibits a bell-shaped distribution along the direction of the line of action, with the maximum value occurring near the pitch point and the minimum value at the engagement point of the driving gear.
The spatial distribution of minimum film thickness as a function of rotational speed and rolling angle was obtained for each precision grade. Higher precision gears, having smoother surfaces, enable thicker effective lubricating films. The film thickness at any point is influenced by the local surface topography, which modifies the actual separation between the contacting asperities.
6.3 Film Thickness Ratio
The film thickness ratio \(\lambda\) determines the lubrication regime: boundary lubrication (\(\lambda \le 1\)), mixed lubrication (\(1 < \lambda < 3\)), and full elastohydrodynamic lubrication (\(\lambda \ge 3\)).
The film thickness ratio distributions considering and not considering the actual microscale morphology were compared for each precision grade at input speeds of 4500, 5500, 6500, and 7463 r/min. Key observations include:
- For grade 5 gears, the film thickness ratio increases with speed, ranging between 1 and 3 for speeds above 4500 r/min, indicating mixed lubrication. When considering microscale morphology, the film thickness ratio at each position fluctuates around the theoretical value due to localized roughness variations.
- For grade 6 gears, at speeds below 7463 r/min, the film thickness ratio is predominantly below 1, indicating boundary lubrication. When microscale morphology is considered, the film thickness ratio near the disengagement point improves at speeds above 6500 r/min, suggesting localized lubrication enhancement.
- For grade 7 gears, without considering morphology, the film thickness ratio is below 1 across all speed ranges. However, when actual morphology is considered, the film thickness ratio significantly improves, especially at higher speeds, due to the actual measured roughness being lower than the theoretical values in many regions.
The film thickness ratio along the tooth profile direction exhibits wavy, non-uniform distributions when microscale morphology is considered, reflecting the spatial variation of surface roughness across the tooth flank.
6.4 Weighting Factor Analysis
The weighting factor \(\lambda_f\) in the mixed friction coefficient model depends directly on the film thickness ratio. Since the film thickness ratio is influenced by the local surface roughness, the weighting factor also exhibits spatial variations when microscale morphology is considered. The weighting factor distributions along the three contact lines (a, b, c) were analyzed for each precision grade, demonstrating that local surface features can substantially alter the relative contributions of EHL and boundary lubrication components.
6.5 Oil Film Load-Carrying Ratio
The oil film load-carrying ratio, representing the proportion of normal load supported by the lubricating film, was calculated using the following empirical relationship:
$$
\gamma = \frac{1.21 \lambda^{0.61}}{1 + 0.37 \lambda^{1.26}}
$$
The oil film load-carrying ratio distributions for different precision grades were analyzed. For grade 5 gears, the ratio exhibits an arch-shaped distribution along the tooth profile, with maximum values at the engagement and disengagement points and minimum values near the pitch point. This counterintuitive behavior arises because the film thickness ratio for grade 5 gears exceeds 2.12 across the entire tooth flank, where the load-carrying ratio decreases with increasing film thickness.
For grade 6 gears, the oil film load-carrying ratio increases with rotational speed and exhibits a maximum at the pitch point along the tooth profile direction. When microscale morphology is considered, the ratio varies in accordance with the actual surface roughness distribution.
For grade 7 gears, the oil film load-carrying ratio generally increases when actual morphology is considered, primarily because the measured roughness is lower than the theoretical value, resulting in improved lubrication conditions.
7. Power Loss Analysis Considering Microscale Morphology
The power loss on the tooth surface was analyzed for each precision grade at various input speeds. The instantaneous power loss exhibits a parabolic distribution along the tooth profile, with the minimum at the pitch point and increasing values toward the engagement and disengagement points. This pattern correlates inversely with the oil film thickness distribution.
Key findings:
- At the same rotational speed, gears with higher precision (lower roughness) exhibit lower power loss at identical meshing positions.
- For a given precision grade, increasing the input speed reduces power loss at the same meshing position due to improved hydrodynamic lubrication and thicker oil films.
- When microscale morphology is considered, the power loss at different positions on the tooth flank varies with local roughness. The magnitude of variation depends on the spatial distribution of surface features.
- The power loss reduction with increasing speed is more pronounced for lower precision gears, suggesting that speed-dependent lubrication improvement is more significant for rougher surfaces.
The meshing efficiency of the herringbone gear pair was calculated for all cases. Higher precision gears achieve higher efficiency, and efficiency improves with increasing input speed. The consideration of microscale morphology introduces local variations in efficiency that are not captured by models assuming ideal smooth surfaces or uniform roughness.
8. Tooth Surface Modification and Optimization
8.1 Transmission Error Analysis
Transmission error (TE) is defined as the difference between the theoretical and actual angular positions of the driven gear relative to the driving gear, expressed in linear displacement along the line of action:
$$
TE = r_{b2} \theta_2 – r_{b1} \theta_1
$$
From the initial simulation with input power of 4000 kW, driving speed of 7463 r/min, and operating temperature of 70°C, the transmission error of the herringbone gear external meshing pair was analyzed. The meshing cycle spans rolling angles from 28.7236° to 36.5724°, with a total meshing region of 7.8488°. The maximum displacement of the driving gear along the line of action is 27.0199 μm, the minimum is 24.3631 μm, resulting in a transmission error of 2.6568 μm.
8.2 Hertzian Contact Stress and Normal Load Analysis
The initial contact simulation revealed significant load concentration on the left end of the driving gear tooth flank. The maximum Hertzian contact stress reaches 1120 MPa at the pitch point on the left end, while the minimum stress is 577 MPa at the right end. Similarly, the maximum normal load per unit length is 668 N/mm at the left end, decreasing to 171 N/mm at the right end. This pronounced non-uniform load distribution along the face width indicates a serious edge load phenomenon, which accelerates localized wear, increases the risk of tooth fracture, and reduces the load-carrying capacity and service life of the herringbone gear pair.
The relationship between Hertzian contact stress and the friction coefficient was examined. The friction coefficient increases with contact stress up to approximately 351 MPa, reaching a maximum value of 0.0423, then decreases as the contact stress continues to increase toward 3000 MPa. Similarly, the friction coefficient initially increases sharply with normal load per unit length up to approximately 250 N/m, then gradually decreases toward a plateau.
8.3 Power Loss before Modification
Before modification, the total power loss of the herringbone gear external meshing pair was calculated as 7.7086 kW. Excluding windage and churning losses, the meshing efficiency was 99.614%. The local energy loss distribution on the driving gear tooth surface exhibited a pattern consistent with the load distribution: higher losses at the left end engagement and disengagement zones, and lower losses at the right end.
8.4 Optimization Strategy with Genetic Algorithm
To address the identified issues—excessive transmission error, non-uniform load distribution, and stress concentration—a comprehensive tooth surface modification was performed using Romax Designer’s second-generation genetic algorithm module. The optimization objectives were:
- Minimize transmission error
- Minimize maximum Hertzian contact stress
- Minimize local power loss
The design variables and their ranges are as follows:
| Design Variable | Driving Gear Range (μm) | Driven Gear Range (μm) |
|---|---|---|
| Lead crowning | 0 ~ 40 | 0 ~ 40 |
| Lead slope | 0 ~ 20 | -40 ~ 0 |
| Involute crowning | 0 ~ 40 | 0 ~ 40 |
| Involute slope | -40 ~ 40 | -40 ~ 40 |
The genetic algorithm parameters were set as follows:
| Parameter | Value |
|---|---|
| Number of generations | 20 |
| Population size | 50 |
| Crossover probability | 0.2 |
| Mutation probability | 0.3 |
| Number of candidate solutions | 1000 |
After convergence, the optimal solution was selected based on the lowest penalty score. The optimal modification parameters for the driving gear were:
- Lead crowning: 0.507 μm
- Lead slope: 19.30 μm
- Involute crowning: 16.86 μm
- Involute slope: -20.88 μm
The optimal modification parameters for the driven gear were:
- Lead crowning: 2.83 μm
- Lead slope: 2.35 μm
- Involute crowning: 20.92 μm
- Involute slope: -9.00 μm
8.5 Optimization Results
After applying the optimal tooth surface modifications, the dynamic simulation was repeated under identical operating conditions. The results are summarized below:
| Performance Parameter | Before Modification | After Modification | Improvement |
|---|---|---|---|
| Maximum transmission error (μm) | 2.6568 | 0.86 | -67.6% |
| Maximum Hertzian contact stress (MPa) | 1120 | 1097 | -2.1% |
| Maximum unit normal load (N/mm) | 668 | 644 | -3.6% |
| Total meshing power loss (kW) | 7.7086 | 5.758 | -25.3% |
| Meshing efficiency (%) | 99.614 | 99.702 | +0.088 |
The transmission error after modification exhibits a smoother curve in the pitch point region, indicating more stable tooth engagement. The transmission error is reduced by 1.7968 μm compared to the unmodified gear pair, representing a substantial improvement in transmission accuracy and reduction of meshing impact.
The Hertzian contact stress distribution after modification reveals that the maximum stress has shifted toward the central region of the tooth flank, with the stress decreasing radially outward toward the tooth ends. Although the stress distribution is not perfectly symmetrical—with slightly higher values at the right end than the left—the edge loading phenomenon has been largely eliminated.
The unit normal load distribution after modification demonstrates improved uniformity along the contact lines, effectively eliminating edge contact and significantly mitigating stress concentration. The maximum unit normal load decreased by 3.6% compared to the unmodified case.
The local energy loss distribution after modification is symmetric about the pitch line along the tooth profile direction, with maximum losses occurring at the engagement and disengagement sections and minimum losses at the central region. The maximum local power loss has shifted toward the middle of the face width, confirming the alleviation of the edge load phenomenon. The overall meshing power loss was reduced by 25.3%, and the meshing efficiency increased by 0.088 percentage points, reaching 99.702%.
9. Discussion
The results of this comprehensive study underscore the critical importance of considering tooth surface microscale morphology in the design and performance evaluation of herringbone gears. The conventional assumption of perfectly smooth surfaces or uniform roughness can lead to significant errors in predicting lubrication regimes, friction coefficients, and power losses, particularly at high speeds and heavy loads typical of aerospace applications.
The integration of experimentally measured surface topography into the efficiency calculation framework provides a more realistic assessment of gear performance. The variation in surface roughness along the tooth flank—both in the profile and lead directions—creates localized lubrication regimes that differ substantially from the average behavior. This finding has important implications for surface engineering strategies: optimizing the spatial distribution of surface texture could yield measurable improvements in meshing efficiency.
The genetic algorithm-based tooth surface modification proved highly effective in addressing the coupled issues of transmission error, load distribution, and power loss. By optimizing the lead crowning, lead slope, involute crowning, and involute slope parameters, a comprehensive improvement in gear performance was achieved. The reduction in transmission error is particularly significant for high-speed applications where dynamic loads and noise are major concerns.
The shift in the maximum contact stress location from the tooth end to the central region confirms that the modification successfully redistributes the load more evenly across the face width, extending the fatigue life of the herringbone gear. The corresponding reduction in power loss directly contributes to improved fuel efficiency and reduced thermal loading in engine applications.
10. Conclusions and Future Perspectives
This thesis conducted a comprehensive investigation into the meshing efficiency of herringbone gears considering microscale surface morphology and subsequent tooth surface optimization. The principal conclusions are as follows:
- A 16-degree-of-freedom dynamic model of the herringbone gear external meshing pair incorporating tooth surface friction was successfully established. Combined with a mixed lubrication friction coefficient model, this provides a robust framework for calculating meshing efficiency.
- The microscale morphology of gear tooth surfaces significantly influences the lubrication state between meshing teeth. Gear precision grade, input speed, and local surface roughness collectively determine the film thickness ratio and oil film load-carrying ratio. Higher precision gears and higher input speeds generally promote better lubrication and lower power loss.
- The consideration of actual measured surface topography introduces localized variations in friction characteristics and power loss that are not captured by idealized models. The magnitude of these variations depends on the spatial distribution of surface roughness features.
- Comprehensive tooth surface modification using a genetic algorithm effectively optimizes the herringbone gear pair performance. The optimized modification reduces transmission error by 67.6%, reduces maximum Hertzian contact stress by 2.1%, reduces maximum unit normal load by 3.6%, and improves meshing efficiency by 0.088 percentage points while significantly alleviating edge loading.
Several avenues for future research are identified:
- Extension of the current methodology to include the internal meshing pair of the herringbone planetary transmission system and the complete transmission train dynamics.
- Experimental validation of the simulation results through a dedicated transmission efficiency test rig, incorporating windage, bearing, and churning losses under realistic operating conditions.
- Investigation of time-varying surface morphology under operational wear and its effect on long-term mesh efficiency evolution.
- Refinement of the optimization variable ranges in the genetic algorithm based on manufacturing process constraints to enhance practical applicability.
- Exploration of advanced surface texturing strategies designed to exploit the spatial lubrication variations identified in this study for further efficiency gains.
In summary, this research contributes to a deeper understanding of the coupled effects of surface microscale morphology, lubrication, and dynamics in herringbone gear systems. The findings provide valuable guidance for the design, manufacturing, and optimization of high-performance herringbone gear transmissions in aerospace and other demanding applications.