
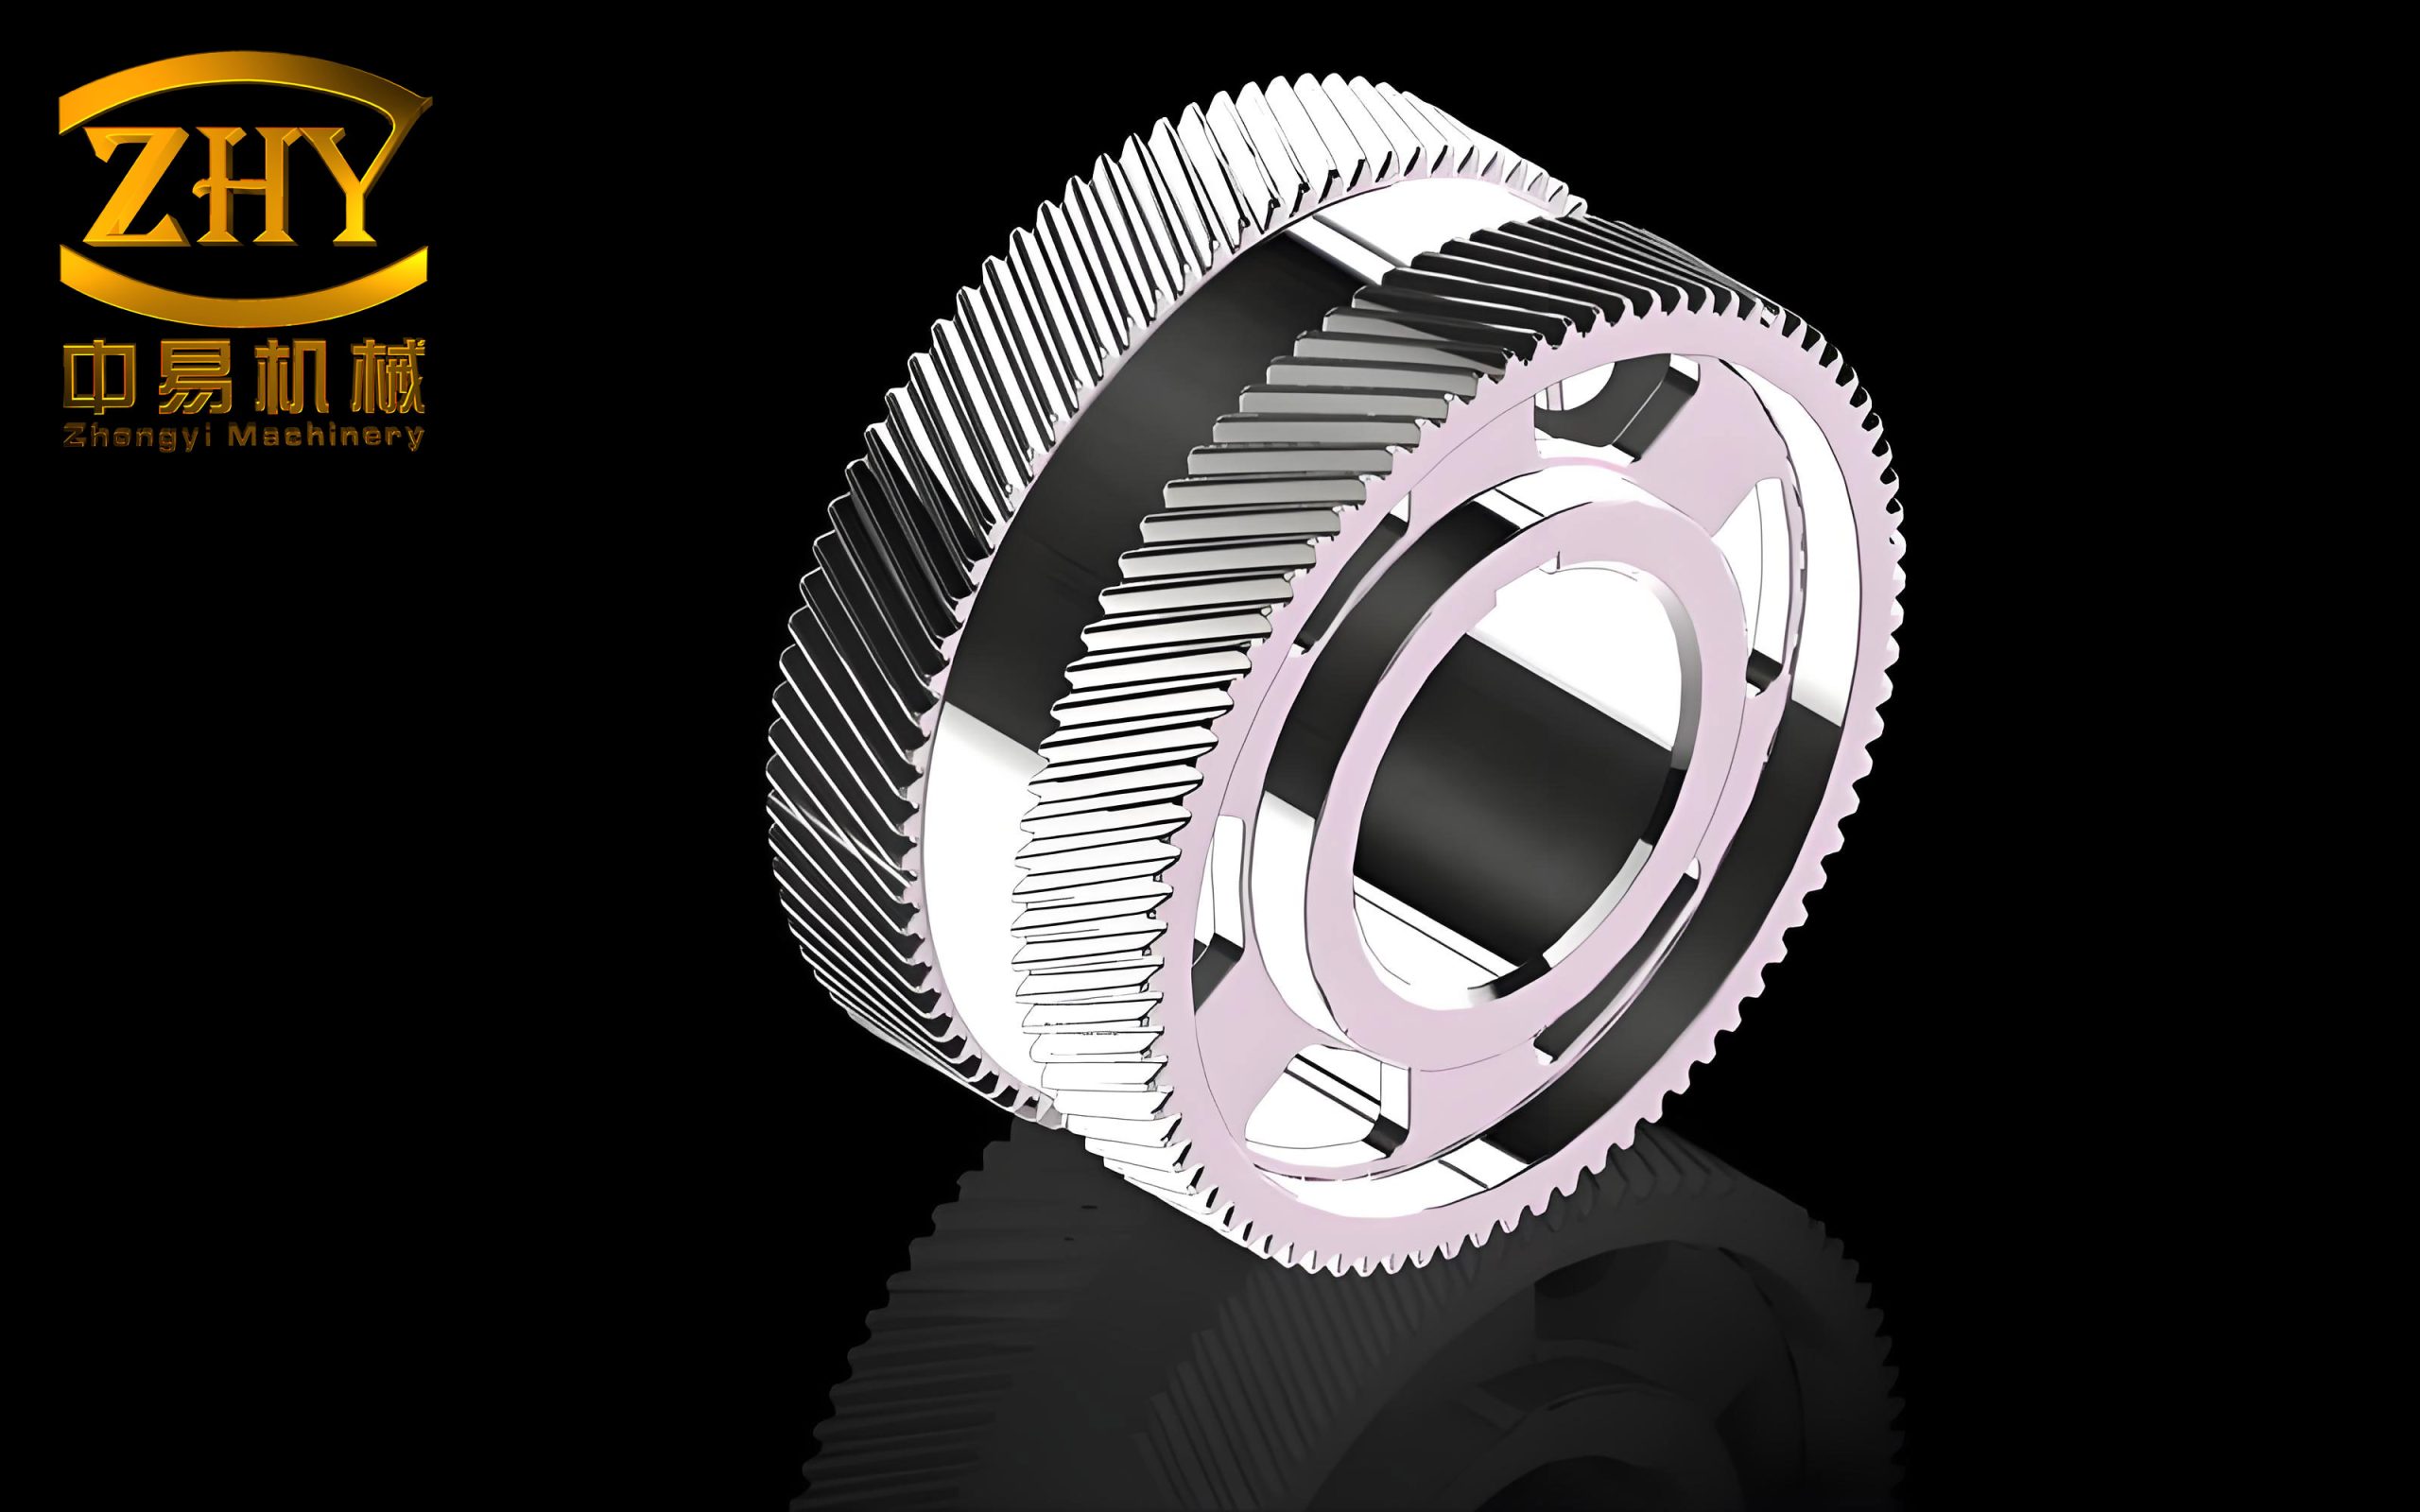
In my research, I focused on the influence of shot peening process parameters on the surface morphology and residual stress of herringbone gears made of 10CrNi2Mo3Cu2V heat-resistant steel. Herringbone gears are widely used in high-speed and heavy-load transmission systems due to their excellent load-carrying capacity and stability. However, their surface integrity is critical for fatigue life and wear resistance. Shot peening is a key surface strengthening process that introduces beneficial residual compressive stresses and modifies surface morphology. Understanding the relationship between shot peening parameters and the resulting surface integrity is essential for optimizing the process. In this work, I combined experimental tests and finite element simulations to systematically investigate these relationships.
The core of my approach was a DEM-FEM sequential coupling simulation model. I first established a discrete element model (DEM) to simulate the actual shot peening process on a herringbone gear, capturing shot-shot and shot-gear interactions. Then, the resulting impact information was transferred to a finite element model (FEM) to compute residual stresses and surface roughness. I also developed a physics-based numerical model for Almen intensity prediction, which is typically measured experimentally. The proposed models were validated through shot peening experiments, with errors below 13% for both surface roughness and residual stress.
Material Characterization and Constitutive Model
To accurately simulate the shot peening process, I first determined the dynamic mechanical behavior of the gear material. The material was 10CrNi2Mo3Cu2V steel, which corresponds to AMS 6308. Its chemical composition is listed in the table below.
| Element | Cr | Ni | Mo | Cu | V | C | Mn | Si | Fe |
|---|---|---|---|---|---|---|---|---|---|
| Content (%) | 1.0 | 2.0 | 3.25 | 2.0 | 0.1 | 0.11 | 0.4 | 0.9 | Balance |
I performed Hopkinson split-Hopkinson pressure bar (SHPB) tests at strain rates of 1000 s⁻¹, 3000 s⁻¹, and 5000 s⁻¹, and at temperatures of 25°C, 200°C, 400°C, and 600°C. The measured stress-strain curves showed that the yield strength increased with strain rate but decreased with temperature, as summarized in the table below.
| Strain rate (s⁻¹) | Temperature (°C) | Yield strength (MPa) |
|---|---|---|
| 1000 | 25 | 1851 ± 15 |
| 3000 | 25 | 2159 ± 12 |
| 5000 | 25 | 2655 ± 30 |
| 5000 | 200 | 2364 ± 12 |
| 5000 | 400 | 1938 ± 20 |
| 5000 | 600 | 1583 ± 20 |
The dynamic response was modeled with the Johnson-Cook constitutive equation:
$$ \sigma = \left(A + B \varepsilon_{eq}^{n}\right) \left(1 + C \ln \frac{\dot{\varepsilon}}{\dot{\varepsilon}_0}\right) \left(1 – \left(\frac{T – T_r}{T_m – T_r}\right)^m\right) $$
where σ is the flow stress, εeq is the equivalent plastic strain, \dot{\varepsilon} is the strain rate, \dot{\varepsilon}_0 is the reference strain rate (1000 s⁻¹), T is the test temperature, T_r is room temperature, and T_m is the melting temperature. By fitting the experimental data, I obtained the following parameters:
| Parameter | A (MPa) | B (MPa) | n | C | m |
|---|---|---|---|---|---|
| Value | 1900 | 1523 | 0.2269 | 0.0613 | 0.945 |
This constitutive model was then used in the finite element model for the herringbone gear target.
Shot Peening Intensity Prediction Model
Shot peening intensity is a crucial quality control parameter in shot peening. Traditionally, it is determined experimentally using Almen strips, which is time-consuming and expensive. I developed an alternative computational model based on the actual shot peening process. The model follows these steps:
- Calculate the distribution of impact counts using a two-dimensional Gaussian probability model based on shot flow rate, shot type, nozzle speed, nozzle distance, and dispersion angle.
- Build a finite element model of the Almen strip with dimensions 76 mm × 19 mm × 1.29 mm, with refined meshing in the shot-impact region.
- Perform explicit dynamics analysis for the shot impacts, using the shot velocity calculated from empirical correlations.
- Extract the residual stress profile from the simulation and apply it to a static equilibrium model of the full Almen strip to compute its arc height.
- Repeat for different peening times, then build the saturation curve and determine the Almen intensity according to the standard definition.
The figure below illustrates the mesh design and the arc height calculation points on the Almen strip.
For the aluminum intensity calculation, the arc height h is defined as the difference between the average displacement of the four corner points (a, b, c, d) and the central point (o) of the 31.75 mm × 15.87 mm rectangle:
$$ h = \frac{u_a + u_b + u_c + u_d}{4} – u_o $$
where u denotes the out-of-plane displacement. The saturation curve is then constructed by plotting h versus peening time. The Almen intensity is the arc height at which doubling the time produces a 10% increase in arc height.
DEM-FEM Coupled Simulation for Herringbone Gears
To simulate the shot peening of actual herringbone gears, I used a coupled discrete element method (DEM) and finite element method (FEM). The DEM model captured the shot dynamics, including collisions among shots and between shots and the complex gear tooth surfaces. The gear geometry was discretized with structured meshes on the tooth flank, as shown below.
In the DEM model, the nozzle distance was 150 mm, the shot flow rate was 6 kg/min, and the nozzle moved at 120 mm/min while the gear rotated at 20 rpm. The shot types considered were S110, S170, and S230 cast steel shots with diameters of 350 μm, 500 μm, and 700 μm, respectively. The shot velocity was varied from 60 to 100 m/s. The DEM simulation provided the impact velocity and impact number distributions on each tooth surface.
Because herringbone gears have curved surfaces, the impact velocities in the global coordinate system had to be transformed into local coordinates. I established a local coordinate system on each mesh element, where the X-axis was aligned with the face width direction, the Y-axis with the tooth height direction, and the Z-axis with the normal direction. The transformation can be expressed as:
$$ \mathbf{v}_{local} = \mathbf{T} \cdot \mathbf{v}_{global} $$
where T is the orthogonal transformation matrix built from the element basis vectors. The impact density N on each element is:
$$ N = \frac{N_d}{S_e} $$
where N_d is the number of impacts recorded on that element, and S_e is its area.
The finite element target used a 1 mm × 1 mm × 0.5 mm representative block, with a refined mesh in the impact region (10 μm × 10 μm × 10 μm). The target was fixed at its bottom, and the sides were set as infinite elements to suppress reflected stress waves. The shots were modeled as deformable spheres with the material properties listed below.
| Material | Elastic modulus (GPa) | Poisson’s ratio | Density (kg/m³) | Hardness (HV) | Yield strength (MPa) |
|---|---|---|---|---|---|
| Target (10CrNi2Mo3Cu2V) | 210 | 0.3 | 7800 | 769 | 2090 |
| S110 high-hardness cast steel shot | 210 | 0.3 | 7800 | 671 | 1838 |
| S110 low-hardness cast steel shot | 210 | 0.3 | 7800 | 500 | 1350 |
| S170 high-hardness cast steel shot | 210 | 0.3 | 7800 | 671 | 1838 |
| S170 low-hardness cast steel shot | 210 | 0.3 | 7800 | 500 | 1350 |
| S230 high-hardness cast steel shot | 210 | 0.3 | 7800 | 671 | 1838 |
| AZB300 ceramic shot | 300 | 0.27 | 3800 | 727 | 2000 |
I also incorporated the initial surface roughness and initial residual stress measured from ground gears. The initial surface morphology was reconstructed from white light interferometry data and mapped onto the finite element target nodes. The initial residual stress profile was applied layer-by-layer to the element sets.
Results and Discussion
Influence of Tooth Position
I first examined the impact information on different tooth flank positions of the herringbone gears. The results indicated that the left- and right-hand helical sides of the herringbone gear have similar impact distributions due to the reciprocating nozzle motion. Along the tooth profile, the impact density increased from the tooth top to the tooth root. At the tooth root, the impact density was about 6000 impacts/mm², whereas at the tooth tip it was about 2000 impacts/mm². The velocity distributions also varied: near the tooth root, only 19% of impacts retained the nozzle exit velocity, while near the tooth tip, 47% retained it. This is because the narrow space at the root increases shot-shot collisions, reducing the velocity.
For the residual stress, I found that the surface residual stress varied only slightly with position: approximately -837 MPa at the tip, -874 MPa at the pitch circle, and -855 MPa at the root. The maximum compressive residual stress was about -1350 MPa at 30 μm depth for all positions. The influence depth was around 70 μm. Therefore, tooth position has a minor effect on residual stress, but a significant effect on impact characteristics.
Effect of Shot Velocity
I simulated shot peening at velocities of 60, 80, and 100 m/s with S110 high-hardness shots. The surface roughness increased from 0.523 μm to 0.922 μm when the velocity increased from 60 to 100 m/s. The surface residual compressive stress changed non-monotonically, but the maximum compressive residual stress increased from -1350 MPa to -1400 MPa. More importantly, the depth of maximum compressive residual stress increased from 30 μm to 45 μm, and the total affected depth increased from 70 μm to 90 μm. These trends are shown in the table below.
| Shot velocity (m/s) | Surface roughness (μm) | Surface residual stress (MPa) | Maximum residual stress (MPa) | Depth of max. stress (μm) | Influence depth (μm) |
|---|---|---|---|---|---|
| 60 | 0.523 | -874 | -1350 | 30 | 70 |
| 80 | 0.712 | -836 | -1365 | 32 | 80 |
| 100 | 0.922 | -934 | -1400 | 45 | 90 |
Effect of Shot Diameter
Using shot types S110 (350 μm), S170 (500 μm), and S230 (700 μm) at a constant velocity of 60 m/s, I observed that the surface roughness increased from 0.523 μm to 0.874 μm. The maximum compressive residual stress remained around -1310 to -1350 MPa, but the depth of maximum stress increased from 32 μm to 60 μm, and the total influence depth increased from 70 μm to 160 μm. The surface residual stress decreased from -850 MPa to -573 MPa, as shown below.
| Shot type | Diameter (μm) | Surface roughness (μm) | Surface residual stress (MPa) | Max residual stress (MPa) | Depth of max. stress (μm) | Influence depth (μm) |
|---|---|---|---|---|---|---|
| S110 | 350 | 0.523 | -850 | -1350 | 30 | 70 |
| S170 | 500 | 0.721 | -759 | -1307 | 45 | 100 |
| S230 | 700 | 0.874 | -573 | -1317 | 60 | 160 |
Effect of Shot Hardness
I compared high-hardness (671 HV) and low-hardness (500 HV) cast steel shots of the same diameter. Higher shot hardness produced a rougher surface and deeper residual stress. For S110 shots, the surface roughness increased from 0.316 μm to 0.523 μm, and the maximum compressive residual stress increased from -1000 MPa to -1350 MPa. The depth of maximum stress doubled from 15 μm to 30 μm. Results for S170 shots are listed below.
| Shot type | Hardness | Surface roughness (μm) | Surface residual stress (MPa) | Max residual stress (MPa) | Depth of max. stress (μm) | Influence depth (μm) |
|---|---|---|---|---|---|---|
| S110 | Low | 0.316 | -662 | -1000 | 15 | 60 |
| S110 | High | 0.523 | -874 | -1350 | 30 | 70 |
| S170 | Low | 0.339 | -543 | -895 | 30 | 80 |
| S170 | High | 0.721 | -760 | -1307 | 45 | 100 |
Effect on Almen Intensity
I also simulated the Almen intensity for various shot parameters. The predicted intensity increased with shot velocity, shot diameter, and shot hardness. For example, with S110 high-hardness shots, the Almen intensity rose from 0.209 mmA at 60 m/s to 0.260 mmA at 100 m/s. Increasing the shot diameter from 300 μm to 700 μm (at 70 m/s) increased the intensity from 0.218 mmA to 0.409 mmA. The type of shot also matters: for the same velocity, S110 high-hardness steel shots produce a higher intensity than AZB300 ceramic shots, indicating a stronger ability to introduce deep residual stress.
Experimental Verification
To validate my simulation models, I conducted shot peening experiments on herringbone gears using S110 high-hardness shots, a nozzle pressure of 2.5 bar, a flow rate of 6 kg/min, and a nozzle speed of 120 mm/min. The Almen intensity was measured using A-type strips. The comparison between the measured and predicted single crater diameters is given below.
| Shot velocity (m/s) | Experimental crater diameter (μm) | Simulated crater diameter (μm) | Error (%) |
|---|---|---|---|
| 60 | 100 | 110 | 10.0 |
| 70 | 120 | 125 | 4.2 |
| 80 | 155 | 150 | 3.2 |
| 100 | 170 | 160 | 5.9 |
The Almen intensity at 70 m/s was predicted to be 0.218 mmA, while the experimental measurement was 0.230 mmA (error 5.2%). At 100 m/s, the prediction was 0.260 mmA versus an experimental 0.290 mmA (error 10.3%). These results confirm the reliability of my intensity model.
After shot peening, I measured the surface roughness and residual stress of the actual herringbone gears. The measured surface roughness (Sa) increased from about 0.43 μm to 0.56 μm; the simulated roughness was 0.64 μm, giving an error of roughly 12.3%. Residual stress measurements showed that the surface residual stress was about -830 MPa and the maximum compressive residual stress was about -1250 MPa at a depth of 30 μm. My simulation predicted a maximum residual stress of -1350 MPa at the same depth, resulting in an 8% error. Both errors are within the acceptable 13% limit, demonstrating the high accuracy and applicability of the developed DEM-FEM model for herringbone gears.
Conclusion
In this research, I successfully developed a coupled DEM-FEM simulation framework to predict the surface integrity of 10CrNi2Mo3Cu2V herringbone gears after shot peening. The key findings are:
- The Johnson-Cook constitutive equation accurately represents the dynamic behavior of the gear material under high strain rates and elevated temperatures.
- The Almen intensity can be reliably predicted from actual shot peening parameters using my finite-element-based model, with errors below 10%.
- Shot velocity primarily affects surface roughness and the depth of maximum residual stress; shot diameter significantly controls the depth of the compressive layer; shot hardness strongly influences the magnitude and depth of residual stress.
- The proposed DEM-FEM model successfully accounts for the complex shot dynamics on the curved tooth surfaces of herringbone gears. The predicted surface roughness and residual stress agree with experiments within 13%, validating the model’s effectiveness for engineering optimization.
These results provide practical guidance for selecting shot peening parameters to achieve desired surface integrity for herringbone gears, contributing to the reliable manufacturing of high-performance gear components.