
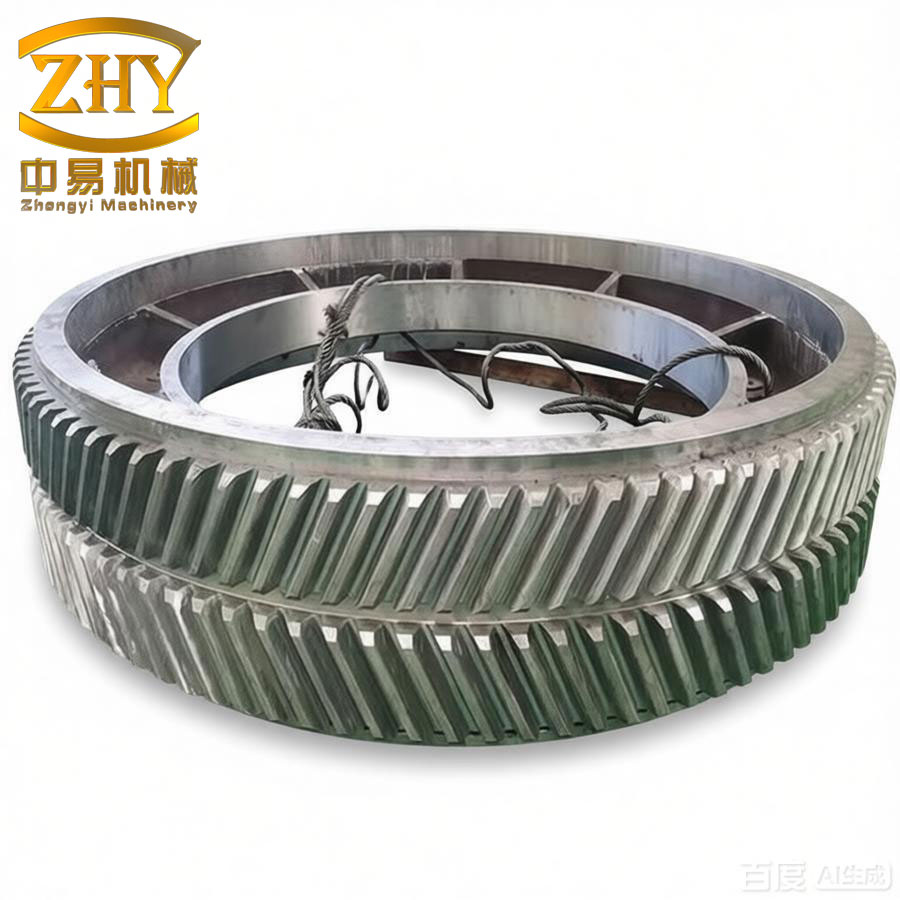
Herringbone gears are key power-transmission components in modern high-speed and heavy-duty machines such as marine propulsion systems, helicopter gearboxes, and large compressors. Their symmetrical V-like tooth arrangement cancels the axial thrust produced by a single helical gear, so herringbone gears can transmit larger torque under more compact packaging. However, under severe operating conditions, the continuously generated friction heat at the tooth interface can lead to a sudden loss of the lubricant film, followed by direct metal-to-metal contact and scuffing failure. Scuffing occurs very quickly, often without visible warning, and it severely limits the service life and reliability of the whole transmission. In my research, I focus on the anti-scuffing load-bearing capacity of herringbone gears by combining mixed thermal elastohydrodynamic lubrication (EHL), tooth-flash-temperature analysis, friction-wear evolution, and the standard FZG load-stage test procedure. The aim is to improve the prediction accuracy of scuffing failure and to provide a reliable numerical tool for the design of herringbone gears.
1. Mixed Thermal Elastohydrodynamic Lubrication of Herringbone Gears
The tooth contact of herringbone gears can be treated as a series of line contacts because each half of a herringbone gear is a helical gear and the instantaneous contact occurs along an inclined line. In reality, the tooth surfaces are not perfectly smooth, and the nominal lubricating film is often interrupted by asperity interactions. Therefore, I employ a mixed EHL model in which the total normal load is shared by the hydrodynamic oil film and the rough-surface asperities. The average Reynolds equation proposed by Patir and Cheng is used to include the influence of three-dimensional roughness:
\[
\frac{\partial}{\partial x}\left(\phi_x \frac{\rho h^3}{12\eta}\frac{\partial p}{\partial x}\right)
=
\frac{u_s}{2}\frac{\partial (\rho h_T)}{\partial x}
\]
where \(h\) is the nominal film thickness, \(h_T\) is the average gap between the two rough surfaces, \(\phi_x\) is the pressure flow factor, \(\rho\) and \(\eta\) are the density and viscosity of the lubricant, and \(u_s\) is the rolling velocity. The film-thickness equation includes both macroscopic geometry and elastic deformation:
\[
h(x)=h_0+\frac{x^2}{2R_{\mathrm{eq}}}
-\frac{2}{\pi E_{\mathrm{eq}}}\int_{x_{\mathrm{in}}}^{x_{\mathrm{end}}}
p(s)\ln(s-x)^2\,\mathrm{d}s
\]
where \(R_{\mathrm{eq}}\) is the equivalent radius of curvature and \(E_{\mathrm{eq}}\) is the equivalent elastic modulus. The lubricant properties depend strongly on pressure and temperature. I use the Dowson–Higginson density relation:
\[
\frac{\rho}{\rho_0}=1+\frac{0.6\times10^{-9}(p-p_0)}{1+1.7\times10^{-9}(p-p_0)}
-\beta_T(T-T_0)
\]
and a Roelands-type viscosity relation:
\[
\eta=\eta_0\exp\left\{(\ln\eta_0+9.67)
\left[\left(1+5.1\times10^{-9}p\right)^Z-1\right]\right\}
\exp\left[-S(T-T_0)\right]
\]
The energy equation of the lubricant film is written as:
\[
\rho c_p \left(u\frac{\partial T}{\partial x}+v\frac{\partial T}{\partial z}\right)
=
K\frac{\partial^2 T}{\partial z^2}
+\eta\left(\frac{\partial u}{\partial z}\right)^2
\]
where \(K\) is the thermal conductivity of the lubricant. The boundary conditions at the tooth surfaces are obtained from the moving-heat-source solution for semi-infinite solids.
To reduce the calculation cost, I use the curve-fitted mixed EHL formulas proposed by Masjedi and Khonsari. The dimensionless central film thickness and minimum film thickness are expressed as:
\[
H_c=2.691\left(1+0.2\bar{\sigma}\right)^{-0.135}
W^{-0.705}U^{-0.556}G^{0.556}
+0.223V^{-0.748}W^{-0.229}U^{-0.842}G^{0.223}
\]
\[
H_{\min}=1.652\left(1+0.026\bar{\sigma}\right)^{-0.077}
W^{-0.716}U^{-0.695}G^{0.695}
+0.185V^{-0.312}W^{-0.809}U^{-0.977}G^{0.185}
\]
where \(W\), \(U\), \(G\), and \(V\) are the dimensionless load, speed, material, and hardness parameters, and \(\bar{\sigma}\) is the dimensionless surface roughness. The asperity load ratio \(L_a\) is approximated by:
\[
L_a=0.005\left[\ln\left(1+4470\bar{\sigma}\right)\right]^{6.015}
W^{-0.408}U^{-0.088}G^{-0.103}V^{-0.485}
\]
The film-thickness ratio is defined as:
\[
\Lambda=\frac{H_{\min}}{\bar{\sigma}}
\]
When \(\Lambda>3\), smooth full-film lubrication dominates. When \(1<\Lambda<3\), the gears operate in mixed lubrication. When \(\Lambda<1\), boundary lubrication prevails and scuffing is highly possible. In my analysis, the dimensionless parameters along the meshing line are calculated from the gear geometry and operating conditions. Table 1 lists the main geometric parameters of the herringbone gear pair used in the study.
| Parameter | Unit | Pinion | Wheel |
|---|---|---|---|
| Number of teeth | – | 17 | 26 |
| Normal module | mm | 4.5 | |
| Normal pressure angle | deg | 20 | |
| Face width (one half) | mm | 45 | |
| Helix angle | deg | 15 | |
| Input speed | r/min | 150 | |
| Input torque | N m | 200 | |
Table 2 gives the material properties of the herringbone gears, and Table 3 gives the properties of the SAE 30 lubricant used in the main part of my calculation.
| Property | Unit | Pinion/Wheel |
|---|---|---|
| Density | kg/m³ | 7800 |
| Specific heat | J/(kg K) | 465 |
| Thermal conductivity | W/(m K) | 50 |
| Hardness | HRC | 50 |
| Elastic modulus | GPa | 206 |
| Poisson ratio | – | 0.3 |
| RMS surface roughness | μm | 0.5 |
| Lubricant Property | Unit | SAE 30 |
|---|---|---|
| Dynamic viscosity at 20 °C | Pa s | 0.35 |
| Pressure-viscosity coefficient | m²/N | 2.5×10⁻⁸ |
| Viscosity-pressure index | – | 0.5687 |
| Viscosity-temperature coefficient | K−1 | 0.045 |
| Viscosity-temperature index | – | 0.8099 |
| Limiting shear-stress coefficient | – | 0.091 |
| Density at 20 °C | kg/m³ | 888 |
The numerical results show that the dimensionless load is higher at the tooth-tip engagement and at the tooth-root disengagement, while the rolling velocity reaches its minimum at the pitch point. The central and minimum film thicknesses both increase along the meshing line because the equivalent radius of curvature becomes larger. The asperity load ratio increases with surface roughness, while the film-thickness ratio decreases. For a roughness of 0.8 μm, the film-thickness ratio drops below unity and the herringbone gear approaches a boundary-lubrication regime. This behavior confirms that surface roughness strongly controls the risk of scuffing in herringbone gears.
2. Tooth Contact Temperature Numerical Analysis
Scuffing of herringbone gears is essentially a thermal failure. The total tooth contact temperature can be divided into the bulk temperature and the flash temperature:
\[
T_c=T_{\mathrm{bulk}}+T_{\mathrm{flash}}
\]
The bulk temperature is the steady gear-body temperature, while the flash temperature is the instantaneous rise caused by friction at the sliding contact. In the ISO standard approach, the flash temperature is computed from the classical Blok flash-temperature formula:
\[
T_{\mathrm{flash}}
=
2.52\frac{\mu_m X_M X_\Gamma X_J F_{bt}}{b}
\left(\frac{|R_{y1}-R_{y2}|}{R_{y1}R_{y2}}\right)^{0.25}
\left(\frac{n_1}{60}\right)^{0.5}
\]
where \(\mu_m\) is the average friction coefficient, \(X_M\) is the thermal elastic coefficient, \(X_\Gamma\) is the load-sharing factor, \(X_J\) is the meshing factor, \(F_{bt}\) is the tangential load, \(b\) is the face width, \(R_{y1}\) and \(R_{y2}\) are local radii of curvature of the pinion and wheel, and \(n_1\) is the pinion speed. The bulk temperature is estimated from:
\[
T_{\mathrm{bulk}}=T_{\mathrm{oil}}+X_S X_{pm} T_{Af}
\]
where \(X_S\) is the lubrication-factor, \(X_{pm}\) is the multiple-pair meshing factor, and \(T_{Af}\) is the average flash temperature.
Although the ISO method is widely used in engineering design, it intentionally adopts a conservative treatment and ignores the detailed mixed-lubrication heat sources. To obtain a more realistic tooth contact temperature for herringbone gears, I use an improved flash-temperature model based on Green’s function solution for a moving square heat source. The contact flash temperature is:
\[
T_f=\frac{2 a_h q_m}{\pi}\left[
\frac{1}{k_1\sqrt{\pi(1+Pe_1)}}+
\frac{1}{k_2\sqrt{\pi(1+Pe_2)}}
\right]
\]
where \(a_h\) is the Hertzian half-contact width, \(q_m\) is the total friction heat flux, \(k_1\) and \(k_2\) are thermal conductivities of the pinion and wheel, and \(Pe_1\) and \(Pe_2\) are the local Péclet numbers. The friction heat flux comprises the heat generated by asperity friction and the heat generated by shearing of the oil film:
\[
q_m=q_h+q_a
\]
\[
q_h=\tau_{\mathrm{lim}}\,u_s
\]
\[
q_a=\mu_m p_a u_s
\]
where \(\tau_{\mathrm{lim}}\) is the limiting shear stress of the lubricant, \(u_s\) is the sliding velocity, \(\mu_m\) is the friction coefficient, and \(p_a\) is the asperity contact pressure. The limiting shear stress is expressed as:
\[
\tau_{\mathrm{lim}}=\Lambda_{\mathrm{lim}}p_h
\]
with \(\Lambda_{\mathrm{lim}}\) being the lubricant’s limiting shear-stress coefficient. Under mixed lubrication, the total contact pressure is divided into a hydrodynamic part and an asperity part:
\[
p=p_h+p_a
\]
In my analysis, I also introduced an oil-film deficiency factor \(\psi\) to account for lubricant desorption and surface activation during high-temperature sliding:
\[
\psi=1-\exp\left[-\frac{X}{u_s t_0}
\exp\left(-\frac{E_a}{R_g T_{\mathrm{flash}}}\right)\right]
\]
This factor is used later in the wear and scuffing calculations.
The calculated distribution of friction heat flux along the meshing line shows that the heat flux is large near the tooth root of the pinion and near the tooth tip of the wheel, while it is small at the pitch point because the sliding velocity is almost zero there. The corresponding contact temperature distribution is shown in Table 4 for three representative operating conditions.
| Operating Condition | Maximum Contact Temperature (°C) | Minimum Contact Temperature (°C) |
|---|---|---|
| 100 N m, 150 r/min | ≈ 88 | ≈ 68 |
| 200 N m, 150 r/min | ≈ 98 | ≈ 76 |
| 300 N m, 150 r/min | ≈ 108 | ≈ 84 |
Increasing torque and speed raises the contact temperature because the oil film becomes thinner and the sliding velocity increases. In addition, a rougher tooth surface increases the asperity load ratio and reduces the film-thickness ratio, which lowers the heat dissipation capacity and raises the flash temperature. The choice of lubricant also plays a critical role. A lubricant with a higher viscosity index and a higher limiting shear stress can maintain a thicker film and reduce the friction heat generation. In my comparative study, SAE 30 oil produced lower contact temperatures than a low-viscosity PAO oil under the same load, which demonstrates the importance of oil selection for the anti-scuffing performance of herringbone gears.
3. Tooth Surface Contact Evolution and Thermodynamic Wear Model
During continuous operation, the tooth surfaces of herringbone gears are worn progressively. The wear process changes the local roughness, contact pressure, and film thickness, and these alterations feed back into the friction and temperature problem. Many previous wear models use the Archard equation with a constant wear coefficient, but this approach can be inaccurate when the load and speed vary with time. I therefore employed the degradation-entropy-generation (DEG) theorem to establish a thermodynamic wear model for herringbone gears.
In a sliding contact, the entropy generation rate caused by irreversible friction and heat conduction can be written as:
\[
\dot{\gamma}=\frac{\mu_m F\,V}{A\,T_c}
\]
where \(F\) is the normal force, \(V\) is the sliding velocity, \(A\) is the apparent contact area, and \(T_c\) is the absolute contact temperature. According to the DEG theorem, the degradation coefficient \(B\) relates the wear-volume rate to the entropy generation rate:
\[
B=\frac{\dot{w}_v\,T_c}{F_\mu V}
\]
By integrating this relation, the wear volume \(w_v\) is obtained as:
\[
w_v=\int B\frac{\mu_m F\,V}{T_c}\,\mathrm{d}t
\]
If the wear volume is assumed to be proportional to the wear depth \(h\), then the local wear depth at the discrete mesh point \((i,j)\) can be expressed as:
\[
h_w(i,j)=\frac{B\,\mu_m\,p(i,j)\,s(i,j)\,L_{\mathrm{asp}}}{100\,T_c(i,j)}
\]
where \(p(i,j)\) is the local contact pressure, \(s(i,j)\) is the sliding distance per mesh cycle, \(L_{\mathrm{asp}}\) is the asperity load ratio corrected by the oil-film deficiency factor, and \(T_c(i,j)\) is the local contact temperature. In this way, the wear depth is coupled with the mixed-EHL tooth-contact state.
To obtain the degradation coefficient \(B\) for gear steel, I performed pin-on-disc wear tests under several constant loads and speeds. The test conditions are listed in Table 5. During the tests, I measured the friction force, the contact temperature, and the mass loss. The measured friction coefficient and temperature are shown in Table 6.
| Test No. | Load (N) | Speed (r/min) | Duration (min) | Sliding Distance (m) |
|---|---|---|---|---|
| 1 | 70 | 90 | 20 | 79 |
| 2 | 60 | 90 | 20 | 79 |
| 3 | 60 | 80 | 20 | 70 |
| Test No. | Average Friction Coefficient | Average Contact-Temperature Rise (°C) | Computed B (×10−10 m³ K/J) |
|---|---|---|---|
| 1 | 0.58 | 4.2 | 2.88 |
| 2 | 0.56 | 3.5 | 2.86 |
| 3 | 0.55 | 3.1 | 2.84 |
The calculated degradation coefficients from the three test groups fall in a narrow range from \(2.84\times10^{-10}\) to \(2.88\times10^{-10}\) m³ K/J. This confirms that \(B\) is a material property and does not depend on the applied load or speed. Therefore, I adopted the average value \(B=2.86\times10^{-10}\) m³ K/J for the subsequent wear simulation of herringbone gears.
Using the thermodynamic wear model, I computed the surface wear depth distributions of the pinion and wheel under mixed lubrication. The wear depth is nonuniform along the face width because of the helix angle. The maximum wear depth appears near the tooth-tip engagement and tooth-root disengagement where the sliding distance is greatest, while the pitch line has almost no wear. The pinion generally shows a larger wear depth than the wheel because it has a smaller number of teeth and more frequent meshing cycles.
I compared the predicted wear distribution with the classical Archard model under the same number of meshing cycles. The distributions have the same tendency, but the Archard model predicts a larger wear depth because it ignores the continuous change of the tooth-surface contact state. In my model, when the local wear depth exceeds a threshold, I update the contact pressure, film thickness, roughness, and asperity load ratio. This feedback loop makes the predicted wear depth lower and more realistic. Table 7 shows the maximum wear depth after \(1.06\times10^8\) meshing cycles.
| Model | Pinion Maximum Depth (μm) | Wheel Maximum Depth (μm) |
|---|---|---|
| DEG model with contact-state update | 28.6 | 25.1 |
| Archard model with constant coefficient | 32.4 | 28.8 |
This study demonstrates that the DEG theorem provides a powerful and reliable basis for modeling the wear of herringbone gears under variable load and speed conditions, and that the coupling between wear and tooth contact state cannot be ignored when the accumulated wear becomes large.
4. Anti-Scuffing Load Calculation Based on the FZG Test Procedure
In the design of herringbone gears, the anti-scuffing load capacity is usually evaluated by the standard FZG gear test. The conventional FZG test A/8.3/90 starts with an oil temperature of 90 °C, but modern high-speed gears often use oil-jet lubrication with a lower oil inlet temperature. I therefore extended the standard load stages and modified the lubrication conditions as follows: the initial oil temperature was set to 60 °C, the lubrication mode was changed to oil-jet lubrication, and the number of load stages was increased from 12 to 16. Each load stage lasted 15 minutes, which corresponds to \(3.75\times10^5\) meshing cycles of the gear pair. Table 8 lists the complete load program.
| Stage | Pinion Torque (N m) | Normal Load (N) |
|---|---|---|
| 1 | 3.3 | 91.8 |
| 2 | 13.7 | 381.2 |
| 3 | 35.3 | 982.1 |
| 4 | 60.8 | 1691.6 |
| 5 | 94.1 | 2618.0 |
| 6 | 135.5 | 3769.8 |
| 7 | 183.4 | 5102.5 |
| 8 | 239.3 | 6657.7 |
| 9 | 302.0 | 8402.1 |
| 10 | 372.6 | 10366.3 |
| 11 | 450.1 | 12522.5 |
| 12 | 534.5 | 14870.7 |
| 13 | 629.7 | 17519.3 |
| 14 | 730.3 | 20318.1 |
| 15 | 838.4 | 23325.7 |
| 16 | 953.9 | 26539.1 |
During the simulated FZG test, I updated the tooth-surface contact parameters every \(1.2\times10^4\) meshing cycles. The average friction coefficient, tooth contact temperature, lubricant viscosity, minimum film thickness, and film-thickness ratio were recorded at the end of each load stage. The general trends are summarized in Table 9.
| Stage | Mean Contact Temperature (°C) | Friction Coefficient | Minimum Film Thickness (μm) | Film-Thickness Ratio Λ |
|---|---|---|---|---|
| 1 | ≈ 61 | ≈ 0.04 | ≈ 1.15 | > 3 |
| 5 | ≈ 70 | ≈ 0.09 | ≈ 0.76 | ≈ 1.5 |
| 9 | ≈ 92 | ≈ 0.18 | ≈ 0.34 | ≈ 0.7 |
| 14 | ≈ 122 | ≈ 0.37 | ≈ 0.12 | ≈ 0.2 |
The friction heat flux increases dramatically as the torque increases. The contribution of asperity friction becomes significant after Stage 9 because the film-thickness ratio falls below unity. At Stage 14, the sum of the hydrodynamic heat and asperity heat reaches about \(4.48\times10^7\) W/m². The lowest film thickness approaches 0.1 μm and the film-thickness ratio drops to about 0.2, indicating that the herringbone gear is operating in the boundary-lubrication regime and scuffing is imminent.
I used the critical scuffing temperature criterion proposed by Castro, which relates the critical tooth temperature to the oil kinematic viscosity at 40 °C:
\[
T_S=26.2\ln(\nu_{40})
\]
For SAE 30 oil, \(\nu_{40}=105\) cSt, so the predicted critical scuffing temperature is \(T_S=395.15\) K (122 °C). Comparing this value with the simulated contact-temperature evolution suggests that scuffing will occur during the transition from Stage 10 to Stage 11, when the steady bulk temperature rises from 60 °C to about 122 °C. The predicted scuffing regions are located near the tooth-tip engagement and tooth-root disengagement, where the sliding distance and friction heat are the largest. This matches the typical scuffing pattern observed on heavy-duty herringbone gears.
5. Influence Factors on the Anti-Scuffing Capacity of Herringbone Gears
5.1 Comparison of ISO and Improved Temperature Algorithms
The ISO standard gives a more conservative estimate of the tooth contact temperature than the improved mixed-EHL flash-temperature model. In my simulation, the difference is about 10–15 °C at the same load stage. The ISO method intentionally simplifies the heat-partition problem and does not include the pressure-temperature dependence of the lubricant film. The improved model accounts for the heat generated by both the oil film and the asperities, and therefore it provides a more physically consistent prediction of the scuffing load capacity.
5.2 Effect of Tooth-Surface Contact-State Updating
If the influence of friction wear on the contact state is neglected during the simulated load stages, the predicted contact temperature is lower than the result obtained with a periodic update of the contact parameters. In the early stages, the difference is negligible because the accumulated wear is small. After Stage 9, however, the wear depth becomes large enough to change the local roughness, asperity load ratio, and film thickness; ignoring these changes would overestimate the oil-film thickness and delay the predicted scuffing stage. Therefore, an accurate anti-scuffing load calculation for herringbone gears must couple wear, thermal effects, and mixed lubrication.
5.3 Effect of Surface Hardness
I compared gears with surface hardness values of 40 HRC, 50 HRC, and 60 HRC. The predicted scuffing stage shifts from Stage 10 for 40 HRC to about Stage 12 for 60 HRC. Higher hardness decreases the wear rate and maintains a smoother surface under severe sliding, which results in a lower friction heat input and a better oil-film retention. Thus, surface hardening is an effective way to improve the anti-scuffing capacity of herringbone gears.
5.4 Effect of Surface Roughness
The initial RMS roughness also has a significant effect. In my analysis, reducing the roughness from 0.8 μm to 0.2 μm improved the film-thickness ratio and reduced the asperity-contact ratio. Consequently, the maximum contact temperature decreased and the scuffing load capacity increased. Surface finishing processes such as superfinishing or fine shot peening can reduce roughness and increase hardness simultaneously, thereby providing a twofold benefit for the anti-scuffing performance of herringbone gears. Table 10 summarizes these effects.
| Factor | Range Studied | Influence on Scuffing Load Capacity |
|---|---|---|
| Surface hardness | 40–60 HRC | Higher hardness delays scuffing |
| RMS roughness | 0.2–0.8 μm | Smoother surface delays scuffing |
| Lubricant viscosity | SAE 30 vs PAO | Higher viscosity improves capacity |
| Contact-state update | With vs without | Updating avoids overdue prediction |
6. Conclusions
In this work, I developed a comprehensive numerical framework for predicting the anti-scuffing load capacity of herringbone gears. The main conclusions are as follows:
(1) Mixed thermal EHL analysis shows that the film-thickness ratio of herringbone gears decreases with increasing load and surface roughness. At a roughness of 0.8 μm, the film-thickness ratio can fall below unity, leading to boundary lubrication and a high scuffing risk. The load-sharing concept is essential for calculating both the hydrodynamic and asperity contact pressures.
(2) The improved flash-temperature model based on Green’s function and mixed-lubrication heat-partition yields a more realistic contact-temperature distribution than the ISO standard. The maximum temperature occurs at the engagement and disengagement positions, while the pitch point has the lowest temperature. Torque, speed, roughness, and lubricant type all have substantial influences on the tooth contact temperature of herringbone gears.
(3) The thermodynamic wear model based on the DEG theorem is capable of predicting the nonuniform wear distribution on herringbone gear tooth surfaces. The degradation coefficient B is a material property and is approximately \(2.86\times10^{-10}\) m³ K/J for the tested gear steel. Updating the contact state after a threshold wear depth is important because it affects the heat generation and film thickness during long-term operation.
(4) The modified FZG load-stage simulation predicts that herringbone gears lubricated with SAE 30 oil will undergo scuffing between Stage 10 and Stage 11 under the given operating conditions. Higher hardness, lower roughness, and the use of a high-viscosity lubricant are effective methods to increase the anti-scuffing load capacity. The coupling among wear, mixed lubrication, and contact temperature must be considered in order to obtain a precise and reliable anti-scuffing design for herringbone gears.
My research provides a theoretical foundation for the anti-scuffing design of high-speed and heavy-duty herringbone gear transmissions. In future work, I plan to include dynamic tooth loads, thermal deformation, and advanced surface coatings in the model, and to validate the numerical results with an FZG gear-rig test on actual herringbone gears.