
1. Introduction and Research Significance
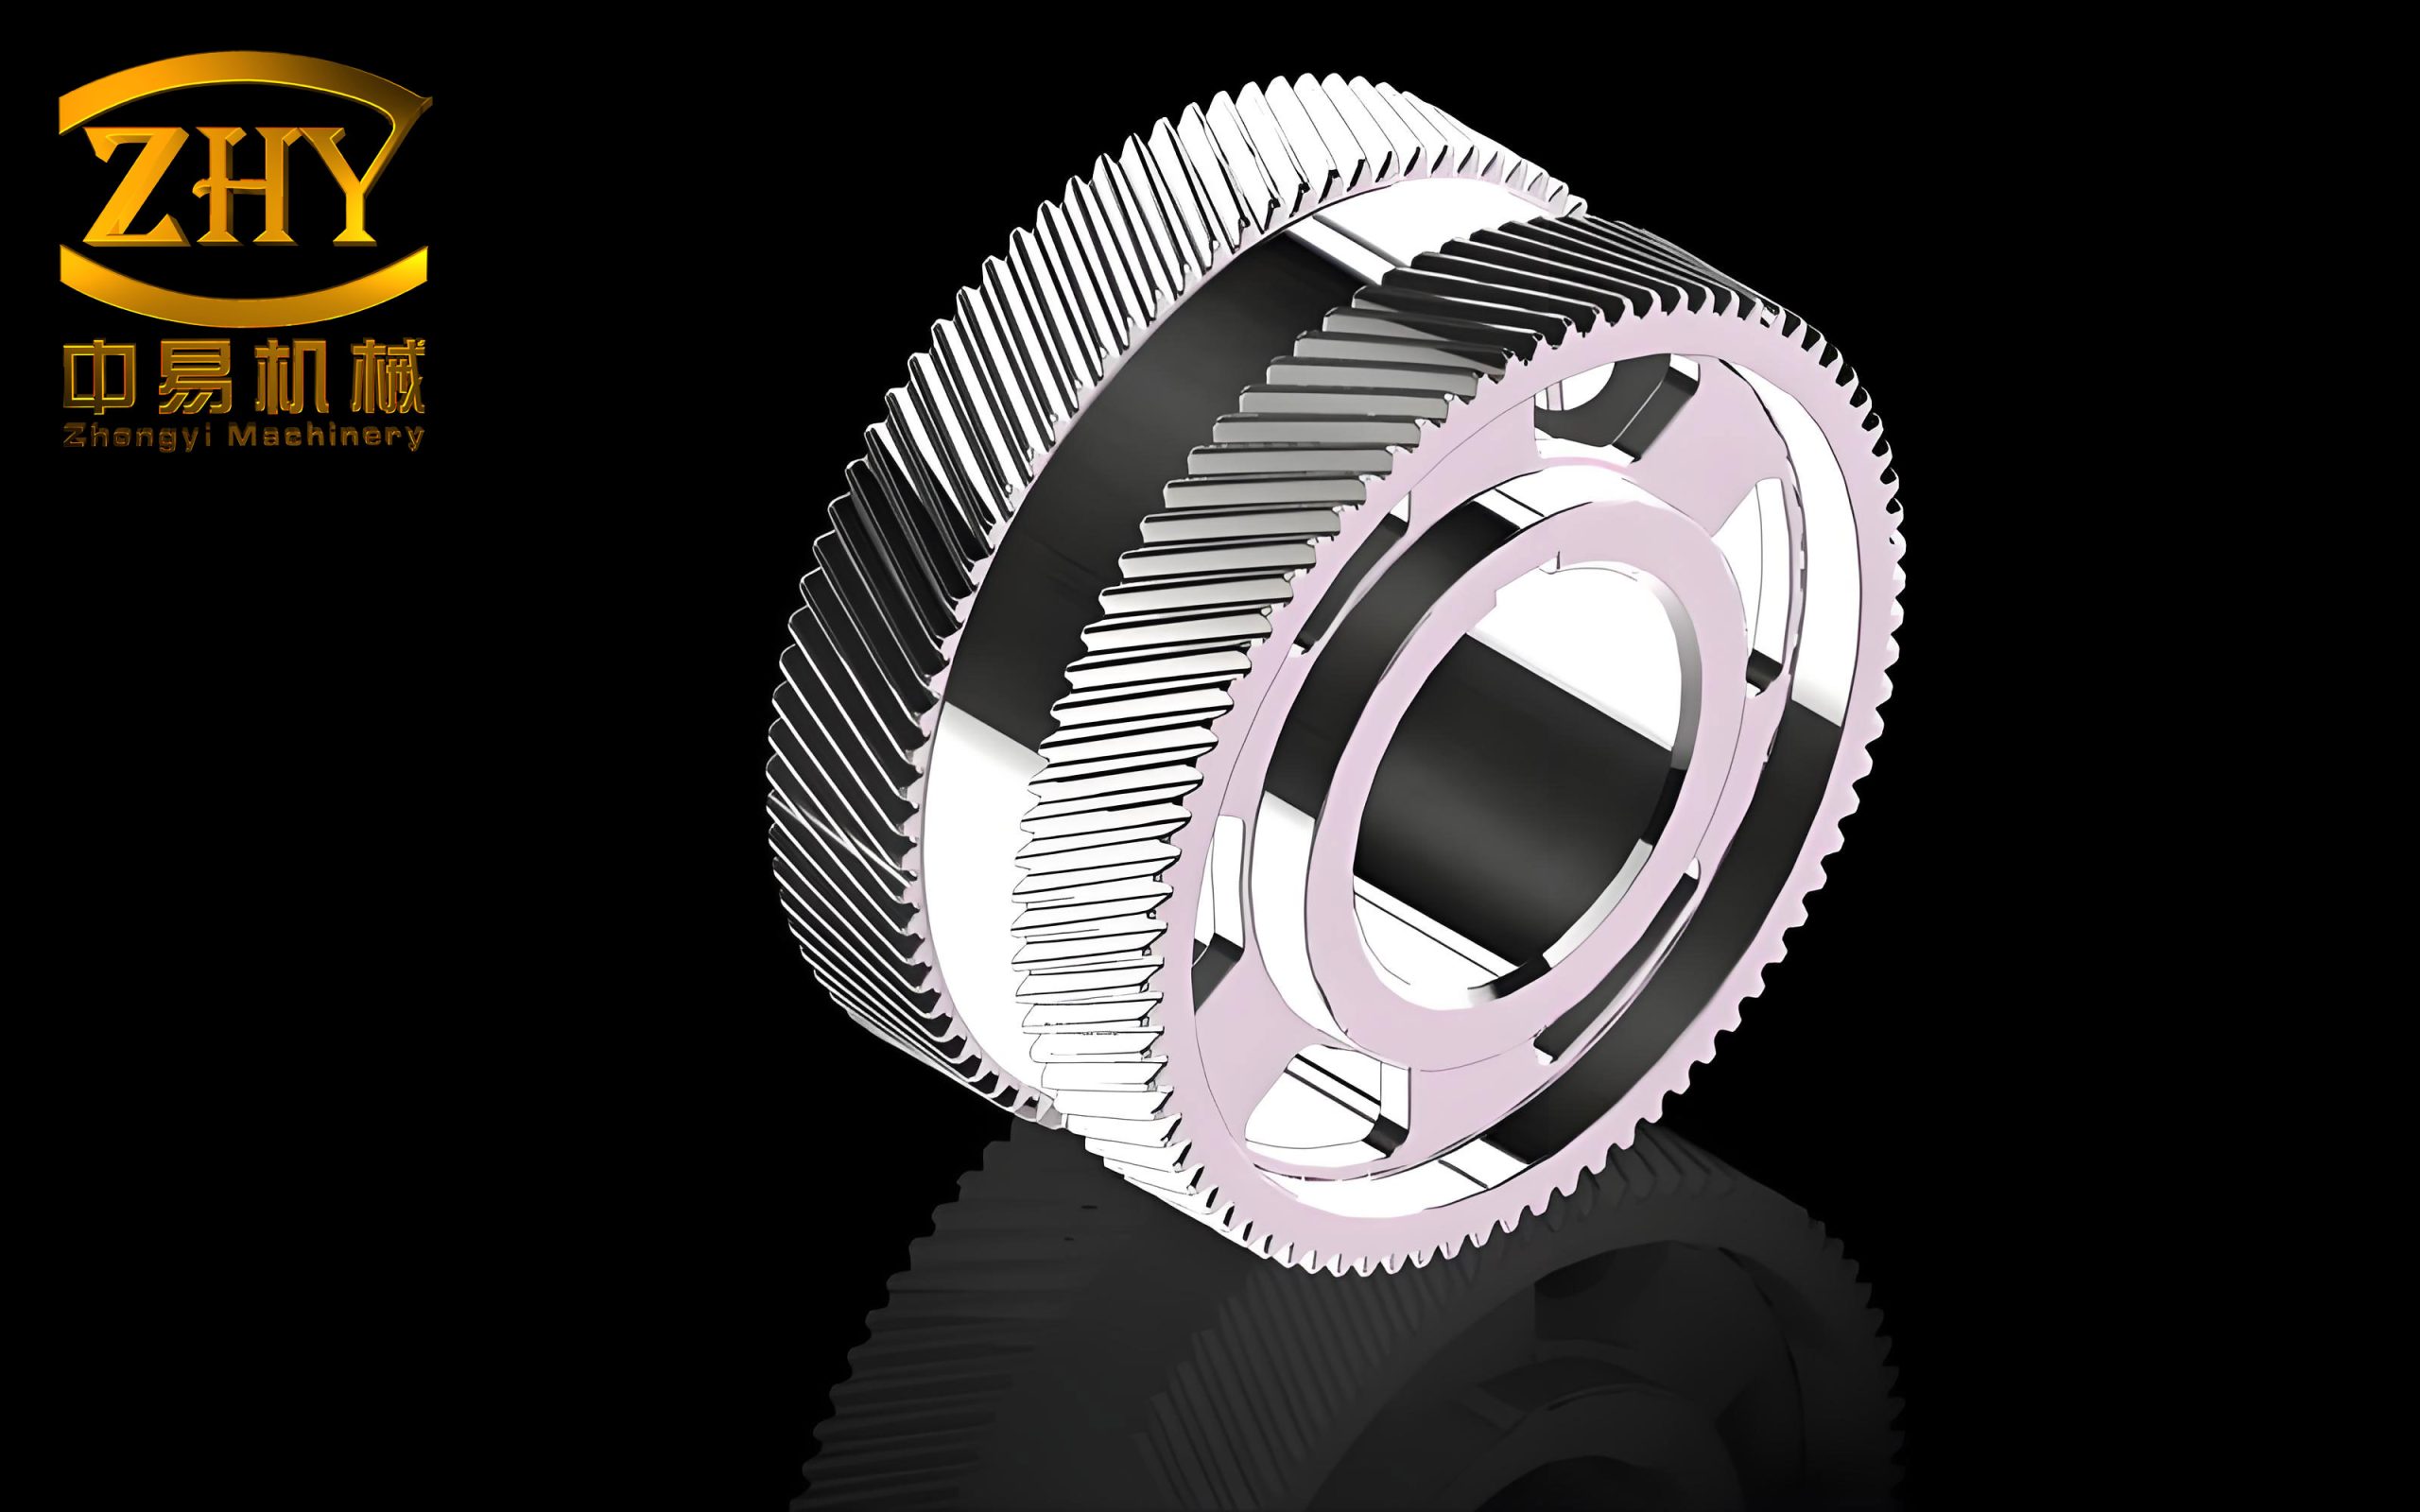
Gear transmission remains one of the most prevalent forms of mechanical power transfer, offering compactness, smooth operation, and longevity. Among gear types, herringbone gears—comprising two symmetric helical gears with an intermediate relief groove—are distinguished by high load capacity and operational stability. These characteristics make herringbone gears particularly suitable for high-speed, heavy-duty, and high-power transmission applications, including marine propulsion and aerospace systems.
However, the manufacturing process for herringbone gears presents a fundamental challenge: the left and right helical gear halves are machined separately. This inevitably introduces symmetry errors, a unique characteristic parameter of herringbone gears that does not exist in conventional helical or spur gears. Symmetry errors significantly influence vibration, noise, and load distribution uniformity in gear transmission systems, serving as a critical constraint on precision in high-end mechanical power transmission equipment.
My research focuses on an aviation power herringbone gear pair as the primary research object. I define symmetry errors based on form error principles, establish tooth contact analysis (TCA) and loaded tooth contact analysis (LTCA) models for herringbone gear pairs incorporating symmetry errors, and systematically investigate how symmetry errors affect herringbone gear meshing transmission through comprehensive analysis and experimental verification.
The existing literature reveals several critical gaps that my work addresses. First, no comprehensive TCA and LTCA models currently exist for herringbone gear pairs with symmetry errors. Second, symmetry errors lack clear definition and systematic research despite their inevitable occurrence. Third, there is no intuitive way to visualize load distribution on both sides of herringbone gears when errors are present. My research aims to fill these gaps through a combined theoretical and experimental approach.
2. Theoretical Foundation: Standard Herringbone Gear Pair Models
2.1 Derivation of Helical Gear Tooth Surface Equations
I derive the helical gear tooth surface equation through conjugation with a rack cutter featuring parabolic tooth profiles. This approach, while using minimal parabolic parameters, transforms the theoretical line contact into point contact, enabling unique solutions in TCA analysis.
The rack cutter position vector and unit normal vector in coordinate system \(S_{ai}\) are:
$$
\mathbf{r}_{ai} = \left[ u_i, a_i u_i^2 + l_i, 1 \right]^T
\tag{1}
$$
$$
\mathbf{n}_{ai} = \frac{\partial \mathbf{r}_{ai}/\partial u_i \times \partial \mathbf{r}_{ai}/\partial l_i}{\left| \partial \mathbf{r}_{ai}/\partial u_i \times \partial \mathbf{r}_{ai}/\partial l_i \right|} = \frac{1}{\sqrt{1 + 4a_i^2 u_i^2}} \left[ -2a_i u_i, 1, 0 \right]^T
\tag{2}
$$
where \(u_i\) and \(l_i\) are tooth surface parameters of the rack cutter, and \(a_i\) is the parabolic modification coefficient. The subscript \(i = 1, 2\) denotes the driving and driven gears, respectively.
Through coordinate transformations, the gear tooth surface and normal vector can be expressed as:
$$
\mathbf{r}_{ti} = \mathbf{M}_{tn} \mathbf{M}_{na} \mathbf{r}_{ai}
\tag{3}
$$
$$
\mathbf{n}_{ti} = \mathbf{L}_{tn} \mathbf{L}_{na} \mathbf{n}_{ai}
\tag{4}
$$
where \(\mathbf{M}_{tn}\) and \(\mathbf{M}_{na}\) are transformation matrices, and \(\mathbf{L}_{tn}\), \(\mathbf{L}_{na}\) are their corresponding sub-matrices obtained by removing the last row and column.
The meshing equation, derived from the fundamental law of gearing, is expressed as:
$$
f_i(u_i, l_i, \theta_i) = \mathbf{n}_{ti} \cdot \mathbf{V}^{(i)}_{ti} = 0
\tag{5}
$$
Solving Eq. (5) yields:
$$
l_i = \frac{u_i^2 \sin \beta_i – \cos \beta_i \sin \alpha \cos \alpha \sin \theta_i \cos \theta_i – a_i u_i r_{pi} \sin 2\theta_i}{2a_i u_i \cos \beta_i \cos^2 \theta_i}
\tag{6}
$$
This establishes the mathematical foundation for the helical gear tooth surface, which serves as the basis for herringbone gear modeling.
2.2 Helical Gear Pair TCA Model
The meshing of gear pairs in a fixed coordinate system \(S_f\) requires that both tooth surfaces have common contact points and common normal vectors at each instant:
$$
\mathbf{r}^{(1)}_f(u_1, \theta_1, \varphi_1) = \mathbf{r}^{(2)}_f(u_2, \theta_2, \varphi_2)
\tag{7}
$$
$$
\mathbf{n}^{(1)}_f(u_1, \theta_1, \varphi_1) = \mathbf{n}^{(2)}_f(u_2, \theta_2, \varphi_2)
\tag{8}
$$
Since \(\left| \mathbf{n}^{(1)}_f \right| = \left| \mathbf{n}^{(2)}_f \right| = 1\), Eqs. (7) and (8) represent five independent scalar equations with six unknowns: \(u_1\), \(u_2\), \(\theta_1\), \(\theta_2\), \(\varphi_1\), and \(\varphi_2\). By treating \(\varphi_1\) as the input parameter, the system becomes solvable.
The geometric transmission error is calculated as:
$$
\delta\varphi_2 = \varphi_2 – \varphi^{(0)}_2 – \frac{Z_1}{Z_2} (\varphi_1 – \varphi^{(0)}_1)
\tag{9}
$$
where \(Z_1\) and \(Z_2\) are the tooth counts of the pinion and gear, respectively, and \(\varphi^{(0)}_1\), \(\varphi^{(0)}_2\) are initial rotation angles.
2.3 Herringbone Gear Pair TCA Model
I model the herringbone gear as a combination of two helical gear pairs (left and right sides). The meshing coordinate system establishes fixed coordinate systems \(S_{h2}\) and \(S_{k2}\) at the midpoint of the gear width on the rotation axis for each helical gear pair.
Considering potential phase differences between the left and right tooth pairs due to manufacturing errors:
$$
\varphi_{1L} = \varphi_{1R} – \Delta\varphi
\tag{10}
$$
where \(\Delta\varphi = \frac{\Xi_e}{r_b \cos \beta_b}\), with \(\Xi_e\) representing the relative machining error between the left and right helical gear pairs, and \(r_b\), \(\beta_b\) denoting the base circle radius and base helix angle of the pinion.
The geometric transmission error of the herringbone gear pair combines results from both sides:
$$
\delta\varphi^L_2 = \varphi^L_2 – \varphi^{(0)L}_2 – \frac{Z_1}{Z_2} (\varphi^L_1 – \varphi^{(0)L}_1)
\tag{11}
$$
$$
\delta\varphi^R_2 = \varphi^R_2 – \varphi^{(0)R}_2 – \frac{Z_1}{Z_2} (\varphi^R_1 – \varphi^{(0)R}_1)
\tag{12}
$$
2.4 Herringbone Gear Pair LTCA Model
The loaded tooth contact analysis incorporates elastic deformation under applied loads. The initial tooth surface clearance consists of inter-tooth clearance and normal tooth surface clearance. The inter-tooth clearance arises from geometric transmission errors between adjacent tooth pairs, while the normal clearance is determined by the tooth surface geometry.
The displacement compatibility equation for herringbone gear pairs is:
$$
\mathbf{F}_k \mathbf{P}_k + \mathbf{w}_k = \mathbf{Z}_k + \mathbf{d}_k \quad (k = I, II, III, IV)
\tag{13}
$$
where \(\mathbf{F}_k\) is the normal compliance matrix, \(\mathbf{P}_k\) is the normal load vector, \(\mathbf{w}_k\) is the initial clearance, \(\mathbf{Z}_k\) is the normal displacement, and \(\mathbf{d}_k\) is the residual clearance after deformation.
The force balance condition is:
$$
\sum_{j=1}^{n} p_j^I + \sum_{j=1}^{n} p_j^{II} + \sum_{j=1}^{n} p_j^{III} + \sum_{j=1}^{n} p_j^{IV} = P_L + P_R = P
\tag{14}
$$
The non-embedding contact condition states:
$$
p_{jk} > 0 \Rightarrow d_{jk} = 0 \quad \text{and} \quad p_{jk} = 0 \Rightarrow d_{jk} > 0
\tag{15}
$$
The time-varying meshing stiffness of the herringbone gear pair is expressed as:
$$
k_L = \frac{T_1}{r_{b2} \cos \alpha_n \cos \beta (Z_L – TE_L)}
\tag{16}
$$
$$
k_R = \frac{T_2}{r_{b2} \cos \alpha_n \cos \beta (Z_R – TE_R)}
\tag{17}
$$
where \(T\) represents the load on the gear, \(\alpha_n\) is the normal pressure angle, \(\beta\) is the helix angle, and \(r_{b2}\) is the base circle radius of the gear.
3. Symmetry Error Modeling and Model Verification
3.1 Definition and Modeling of Symmetry Error
I define symmetry error based on the geometric relationship illustrated in Figure 3.1 of my research. When the herringbone gear is sectioned along the pitch cylinder, the theoretical intersections of helical lines on the left and right tooth surfaces converge at point O on the central plane under ideal conditions. With symmetry errors present, the actual intersection point H deviates from the center line \(O_1O_2\). The distance \(\Delta T\) between this actual intersection point and the center line is defined as the symmetry error.
To incorporate symmetry errors into the mathematical model, I project the deviation onto the centerline and convert the arc length to radians:
$$
\alpha = \frac{\Delta T}{r \tan \beta}
\tag{18}
$$
where \(\beta\) is the helix angle of the pinion and \(r\) is the pitch circle radius.
The modified position vector and normal vector for the right-side pinion tooth surface are:
$$
\mathbf{R}_1 = \mathbf{M} \mathbf{r}_1
\tag{19}
$$
$$
\mathbf{N}_1 = \mathbf{L} \mathbf{n}_1
\tag{20}
$$
with the transformation matrix:
$$
\mathbf{M} = \begin{bmatrix} \cos\alpha & \sin\alpha & 0 & 0 \\ -\sin\alpha & \cos\alpha & 0 & 0 \\ 0 & 0 & 1 & 0 \\ 0 & 0 & 0 & 1 \end{bmatrix}
\tag{21}
$$
3.2 Modified TCA and LTCA Models with Symmetry Error
For the herringbone gear pair with symmetry errors, the TCA model for the right-side helical gear pair is modified to:
$$
\mathbf{r}^{(1)}_f(u_1, \theta_1, \varphi_1 + a) = \mathbf{r}^{(2)}_f(u_2, \theta_2, \varphi_2)
\tag{22}
$$
$$
\mathbf{n}^{(1)}_f(u_1, \theta_1, \varphi_1 + a) = \mathbf{n}^{(2)}_f(u_2, \theta_2, \varphi_2)
\tag{23}
$$
The initial tooth surface clearance in the LTCA model becomes:
$$
\mathbf{w}_k = \mathbf{b}_k + \mathbf{\delta}_k – \Delta T \tan\beta \quad (k = I, II)
\tag{24}
$$
$$
\mathbf{w}_k = \mathbf{b}_k + \mathbf{\delta}_k + \Delta T \tan\beta \quad (k = III, IV)
\tag{25}
$$
The complete LTCA model with symmetry errors is:
$$
\mathbf{w}_k + \mathbf{F}_k \mathbf{P}_k = \mathbf{Z}_k + \mathbf{d}_k
\tag{26}
$$
$$
\sum p_j^I + \sum p_j^{II} + \sum p_j^{III} + \sum p_j^{IV} = P_L + P_R = P
\tag{27}
$$
$$
p_L \neq p_R
\tag{28}
$$
3.3 Three-Dimensional Solid Model and Finite Element Verification
I designed a herringbone gear pair using the parameters shown in Table 1 and created a corresponding three-dimensional solid model in SolidWorks with symmetry error \(\Delta T = 0.01\) mm.
Table 1: Basic Parameters of Gear Pair
| Parameter | Gear | Pinion |
|---|---|---|
| Number of teeth | 81 | 27 |
| Normal module \(m_n\) (mm) | 3.5 | |
| Normal pressure angle \(\alpha_n\) (°) | 20 | |
| Helix angle \(\beta\) (°) | 30 | |
| Face width (mm) | 30 × 2 | |
| Relief groove width (mm) | 55 | |
| Symmetry error \(\Delta T\) (mm) | 0.01 | |
The finite element model, built in ANSYS Workbench, used local mesh refinement with 0.4 mm element size at contact regions and 1 mm global mesh. The model comprised 3,612,457 nodes and 2,431,342 elements. Boundary conditions included fixing the gear while applying 2000 N·m torque to the pinion with cylindrical constraints.
| Table 2: Comparison of Bearing Transmission Error (Mean and Amplitude) | ||
|---|---|---|
| Method | Left Mean (″) | Left Amplitude (″) |
| Finite Element Method | -4.9554 | 10.711 |
| LTCA Method | -4.8008 | 8.659 |
The comparison results demonstrate excellent agreement between the LTCA and finite element methods, with mean errors of 3.12% for the left side and 5.21% for the right side. For meshing stiffness, the differences were 2.48% (left) and 3.46% (right), confirming the accuracy of my analytical model.
4. Influence of Symmetry Error on Herringbone Gear Meshing Characteristics
4.1 Tooth Contact Analysis Results
I performed TCA for herringbone gears with symmetry errors of 0 mm, 0.01 mm, 0.02 mm, and 0.03 mm. Table 3 presents the contact point trajectories for \(\Delta T = 0.01\) mm.
Table 3: Contact Point Trajectories with \(\Delta T = 0.01\) mm
| Left Side | Right Side | ||
|---|---|---|---|
| X (mm) | Y (mm) | X (mm) | Y (mm) |
| -15.000000 | 6.333924 | ||
| -15.000000 | 5.740138 | 15.000000 | 5.740386 |
| -15.000000 | 5.049065 | 15.000000 | 5.049397 |
| -15.000000 | 4.264508 | 15.000000 | 4.264934 |
| -14.472214 | 3.500000 | 14.482214 | 3.500000 |
| -10.073984 | 3.500000 | 10.083984 | 3.500000 |
| -5.675754 | 3.500000 | 5.685754 | 3.500000 |
| -1.277525 | 3.500000 | 1.287525 | 3.500000 |
| 3.120705 | 3.500000 | -3.110705 | 3.500000 |
| 7.518935 | 3.500000 | -7.508935 | 3.500000 |
| 11.917164 | 3.500000 | -11.907164 | 3.500000 |
| 15.000000 | 3.224925 | -15.000000 | 3.225473 |
| 15.000000 | 2.251030 | -15.000000 | 2.251690 |
| 15.000000 | 1.197154 | -15.000000 | 1.197933 |
| 15.000000 | 0.067706 | -15.000000 | 0.068611 |
The analysis reveals that symmetry errors cause the right-side contact pattern to shift toward the tooth root direction. The geometric transmission error on the right side increases with symmetry error magnitude, while the left side remains unaffected. Specifically, the geometric transmission error ranges are:
– For \(\Delta T = 0.01\) mm: -8.062″ to -7.275″
– For \(\Delta T = 0.02\) mm: -15.337″ to -14.551″
– For \(\Delta T = 0.03\) mm: -22.614″ to -21.827″
4.2 Loaded Tooth Contact Analysis Results
The LTCA results demonstrate significant load distribution asymmetry with increasing symmetry errors. Table 4 summarizes the bearing transmission error characteristics.
Table 4: Bearing Transmission Error at Different Symmetry Errors
| \(\Delta T\) (mm) | Left Side (″) | Right Side (″) |
|---|---|---|
| 0 | -4.4814 | -4.4814 |
| 0.01 | -3.9423 | -4.8008 |
| 0.02 | -2.9413 | -5.4838 |
| 0.03 | -1.8425 | -6.8425 |
The meshing stiffness also exhibits significant variation with symmetry error magnitude. As \(\Delta T\) increases from 0 to 0.03 mm, both sides show decreasing stiffness values, with the right side experiencing more pronounced changes. This reduction in meshing stiffness alongside increased asymmetry of bearing transmission errors directly compromises transmission stability.
4.3 Effect of Axial Floating of the Pinion
In engineering practice, the pinion shaft is often installed with axial floating capability to automatically balance axial forces. When the pinion is axially floated, the load distribution between left and right sides becomes nearly equal, as both sides bear essentially identical loads through axial displacement compensation.
Table 5: Load Distribution Coefficients for Different Support Conditions
| \(\Delta T\) (mm) | Fixed: Left | Fixed: Right | Floating: Left | Floating: Right |
|---|---|---|---|---|
| 0.01 | 0.55 | 0.45 | 0.50 | 0.50 |
| 0.02 | 0.60 | 0.40 | 0.50 | 0.50 |
| 0.03 | 0.65 | 0.35 | 0.50 | 0.50 |
However, axial floating cannot individually improve the tooth surface load condition within each meshing tooth pair. The tooth surfaces still experience some degree of partial loading. The axial displacement of the pinion increases with symmetry error magnitude, exhibiting periodic variation corresponding to tooth pair alternation. For \(\Delta T = 0.01\) mm, 0.02 mm, and 0.03 mm, the axial displacements are approximately 5 μm, 10 μm, and 20 μm, respectively.
4.4 Tooth Modification Design for Standard Herringbone Gears
I designed a tooth modification curve combining both lead and profile modifications, with each direction consisting of two parabolic segments and one straight line. The key parameters include maximum modification amounts at tooth root and tip (\(y_1\), \(y_3\)) and at both ends of the face width (\(y_5\), \(y_6\)), modification lengths (\(y_2\), \(y_4\)), and the maximum non-modified length in the lead direction (\(y_7\)).
For standard herringbone gears without symmetry errors and axial floating, both sides share identical modification schemes. The modification effects are quantified below:
Table 6: Comparison of Performance before and after Modification
| Parameter | Before Modification | After Modification | Reduction (%) |
|---|---|---|---|
| Bearing transmission error amplitude (″) | 7.8688 | 5.29 | 32.77 |
| Bearing transmission error mean (″) | -4.4814 | -3.1112 | 30.58 |
| Meshing stiffness amplitude (×10⁸ N/m) | 2.2362 | 0.7681 | 10.36 |
| Meshing stiffness mean (×10⁸ N/m) | 7.5469 | 6.9271 | 8.21 |
The modification effectively eliminates edge contact by shifting engagement and disengagement points, concentrates load toward the tooth center, and significantly reduces transmission error and meshing stiffness fluctuations.
4.5 Error Compensation for Herringbone Gears with Symmetry Error
I proposed a lead-direction compensation modification method specifically for herringbone gears with symmetry errors. The compensation principle addresses the different tooth surface clearances caused by symmetry errors: larger modification amounts are applied where clearances are small (higher load areas), and smaller amounts where clearances are large. This approach balances the tooth surface clearances between left and right sides.
Table 7: Comparison before and after Error Compensation (\(\Delta T = 0.01\) mm)
| Parameter | Before | After |
|---|---|---|
| Left bearing transmission error amplitude (″) | 8.659 | 6.28 |
| Right bearing transmission error amplitude (″) | 6.0367 | 6.28 |
| Left meshing stiffness amplitude (×10⁸ N/m) | 1.233 | 1.168 |
| Right meshing stiffness amplitude (×10⁸ N/m) | 1.1912 | 1.168 |
After compensation, both left and right sides achieve equal bearing transmission errors and equal meshing stiffness values, confirming that the compensation method effectively mitigates the asymmetric loading caused by symmetry errors. The left-side bearing transmission error amplitude decreased by 27.47%, and both sides achieved balanced loading conditions.
5. Experimental Verification
5.1 Experimental Setup and Specimen Preparation
To validate my theoretical models, I designed a pair of herringbone gears based on the parameters in Table 1 and had them manufactured. The gears were measured using a CNC gear measurement center employing the full-tooth helix line method. The measurement principle involves establishing a spatial coordinate system at the gear center, using a contact probe to measure helix line positions on corresponding tooth flanks, and calculating the intersection point distance to the XOY plane as the symmetry error.
The measured symmetry error values are shown in the measurement results, with the average symmetry error determined to be 0.010 mm. This measured value was used as input for the experimental comparisons.
Table 8: Measured Symmetry Error Statistics
| Statistical Parameter | Value (mm) |
|---|---|
| Maximum symmetry error | 0.015 |
| Minimum symmetry error | 0.005 |
| Average symmetry error | 0.010 |
The experimental platform consisted of a TCT1000 measurement and control system, drive motor, loading motor, torque-speed sensors, and mechanical components including shafts, couplings, and gearbox. The drive motor powers the input shaft, while the loading motor applies load to the gearbox. The torque sensors provide real-time data acquisition for closed-loop control.
5.2 Contact Pattern Testing
I tested contact patterns under two support conditions: axial fixed and axial floating pinion. For the fixed condition, both gear and pinion shafts were supported by self-aligning roller bearings (type 21312CC/W33) capable of withstanding axial loads. For the floating condition, the gear shaft maintained the same bearing support while the pinion shaft used cylindrical roller bearings (type NU309ECP) allowing axial freedom.
Table 9: Experimental Conditions for Contact Pattern Testing
| Condition | Support Type | Bearing Type |
|---|---|---|
| Axial fixed | Pinion fixed | 21312CC/W33 |
| Axial floating | Pinion floating | NU309ECP |
The testing procedure involved applying red lead paste to the gear teeth, running the system at low speed until stable operation, stopping the system, and recording the contact patterns. Results confirmed that with axially fixed pinion, the contact patterns on left and right tooth flanks were asymmetric and unevenly distributed. With axially floating pinion, the adjustment of tooth clearance caused by symmetry errors resulted in essentially symmetric contact patterns—consistent with my simulation predictions.
5.3 Axial Displacement Measurement
I measured the axial displacement of the pinion during axial floating using vibration velocity sensors (model CYT9200) at three measurement points (A, B, C) along the shaft. After each test run at 1000 r/min input speed and 2000 N·m load torque, I collected 50 data sets at each location and processed the data through integration of velocity signals.
Table 10: Axial Displacement Comparison
| Parameter | Experimental Result | Simulation Result |
|---|---|---|
| Maximum axial displacement (μm) | 6.5 | 5.0 |
| Minimum axial displacement (μm) | 4.5 | 5.0 |
| Average axial displacement (μm) | 5.5 | 5.0 |
The comparison between experimental and simulation results shows good agreement in both trend and magnitude. The slightly larger experimental values are attributed to non-uniform symmetry errors between individual tooth pairs in the manufactured gears, along with experimental operational and environmental factors. The experimental validation confirms the feasibility of my theoretical research methods and the correctness of the simulation results.
6. Conclusions
Through systematic theoretical analysis, numerical simulation, and experimental verification, I draw the following conclusions from my research on herringbone gears with symmetry errors:
(1) The presence of symmetry errors in herringbone gears significantly affects the meshing imprint distribution and geometric transmission error on the left and right tooth flanks. When symmetry errors exist, the contact pattern on the side containing the error shifts toward the tooth root direction, with the shift magnitude increasing proportionally with the symmetry error. The geometric transmission error on the affected side increases with error magnitude, leading to impact and vibration during transmission.
(2) Symmetry errors cause uneven load distribution between the two sides of herringbone gears. As the symmetry error increases, the side without errors bears progressively more load while the opposite side carries less. This asymmetric loading manifests through different bearing transmission errors and meshing stiffness values on each side, compromising the stability of gear transmission.
(3) Axial floating of the pinion enables equal load sharing between left and right gear pairs during power distribution. However, it cannot effectively improve the tooth surface load condition within each individual tooth pair, as some degree of partial loading persists on the tooth surfaces.
(4) Tooth modification changes the contact path of herringbone gears, causes the engagement and disengagement points to shift, effectively avoiding edge contact problems. The modified tooth surface load concentrates toward the middle, improving load-carrying capacity. Both the mean values and fluctuation amplitudes of bearing transmission error and meshing stiffness decrease substantially after modification.
(5) The proposed lead-direction compensation modification effectively compensates for the tooth surface clearance differences caused by symmetry errors. This method successfully improves the load distribution between left and right tooth flanks, allowing herringbone gears to achieve essentially uniform load sharing. The compensation approach demonstrates significant practical value for improving meshing performance of herringbone gears with manufacturing-induced symmetry errors.
(6) Experimental validation using a measured herringbone gear pair confirmed the correctness of my theoretical models. Contact pattern tests under both axial-fixed and axial-floating conditions matched simulation predictions. Axial displacement measurements were consistent with theoretical calculations, verifying the accuracy of the loaded tooth contact analysis models for herringbone gears with symmetry errors.
My research provides a comprehensive framework for analyzing, predicting, and compensating the effects of symmetry errors in herringbone gears. The TCA and LTCA methods I developed offer computationally efficient alternatives to finite element analysis while maintaining high accuracy. These findings provide theoretical guidance for the design, manufacturing, and measurement of high-performance herringbone gears in demanding applications.