
I investigate how quenching residual stress changes the dynamic response, contact behavior, and fatigue life of a helical gear pair. A helical gear is widely used in high-speed and heavy-load transmission systems because it offers smoother meshing, higher contact ratio, lower noise, and greater load capacity than a spur gear. However, the quenching heat treatment that is often applied to a helical gear introduces a complex residual stress field. This field remains inside the material during service and alters the time-varying meshing stiffness, the dynamic meshing force, the tooth contact state, and the fatigue crack behavior. I therefore build a coupled numerical framework that starts from the quenching process, proceeds to the meshing stiffness of the helical gear, then to a ten-degree-of-freedom dynamic model, and finally to fatigue life and crack propagation assessment.
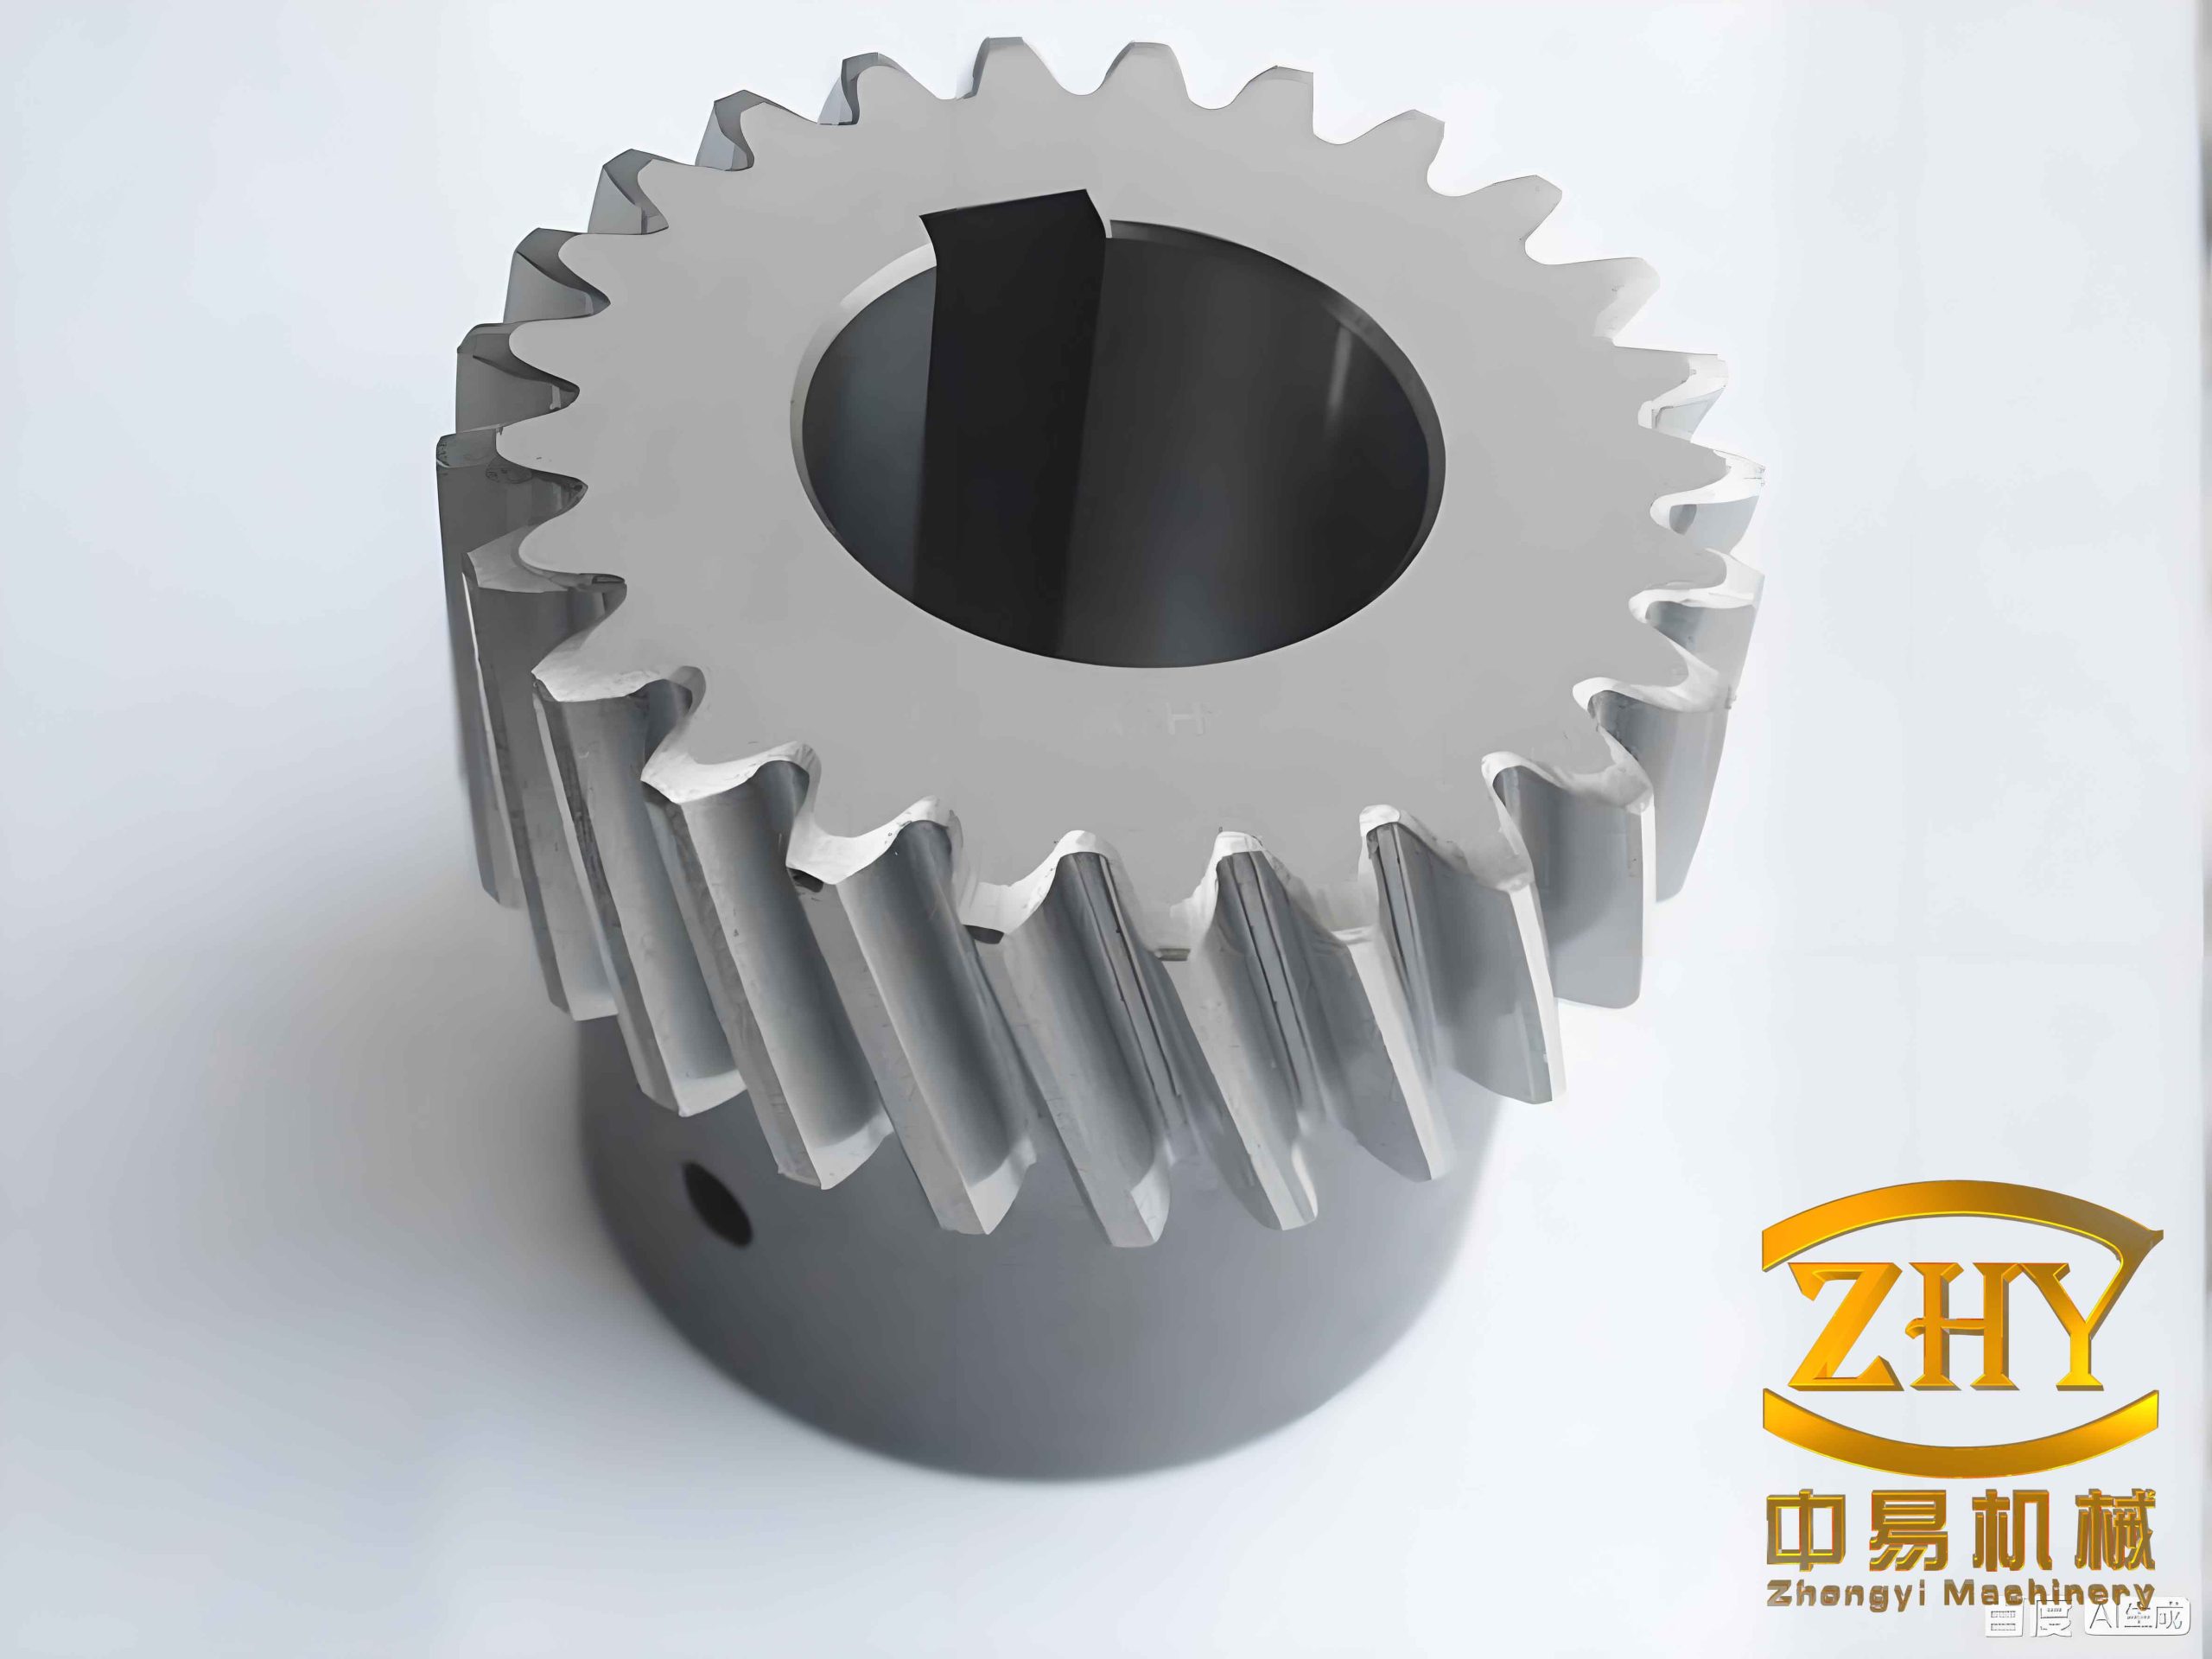
1. Formation of Quenching Residual Stress in a Helical Gear
I treat quenching residual stress as the combined result of thermal stress, transformation stress, and additional stress. During quenching, the surface of a helical gear cools faster than the core. This produces an uneven thermal contraction field. When the material phase changes from austenite to martensite, a volume expansion also occurs. Because the surface and the core transform at different times, the transformation strain is also uneven. The final residual stress state is therefore not a simple thermal stress state; it is a history-dependent state that reflects the whole temperature path, phase path, and plastic deformation path of the helical gear.
The transient heat conduction equation I use for the helical gear is
$$
\rho c \frac{\partial T}{\partial t} =
\frac{\partial}{\partial x}\left(\lambda \frac{\partial T}{\partial x}\right)
+ \frac{\partial}{\partial y}\left(\lambda \frac{\partial T}{\partial y}\right)
+ \frac{\partial}{\partial z}\left(\lambda \frac{\partial T}{\partial z}\right)
+ q_v .
$$
Here, $\rho$ is density, $c$ is specific heat, $\lambda$ is thermal conductivity, $T$ is temperature, $t$ is time, and $q_v$ is an internal heat source. For the quenching of a helical gear, the initial condition is
$$
T|_{t=0} = T_0(x,y,z).
$$
The third-kind boundary condition that I apply at the surfaces exposed to the quenching medium is
$$
-\lambda \frac{\partial T}{\partial n} = h(T_s – T_a),
$$
where $h$ is the surface heat transfer coefficient, $T_s$ is the surface temperature of the helical gear, and $T_a$ is the quenching medium temperature. The heat transfer coefficient is not constant. I relate it to the surface heat flux and temperature difference through
$$
h(t)=\frac{q}{T_s-T_a}.
$$
For the stress field, I use the equilibrium relation
$$
\int_V \mathbf{B}^{\mathrm{T}} \boldsymbol{\sigma}\,dV = \mathbf{P},
$$
where $\mathbf{B}$ is the strain-displacement matrix, $\boldsymbol{\sigma}$ is the stress vector, and $\mathbf{P}$ is the equivalent external load vector. The total strain in the quenching helical gear is decomposed as
$$
\boldsymbol{\varepsilon} = \boldsymbol{\varepsilon}_e + \boldsymbol{\varepsilon}_p + \boldsymbol{\varepsilon}_{th},
$$
where $\boldsymbol{\varepsilon}_e$ is elastic strain, $\boldsymbol{\varepsilon}_p$ is plastic strain, and $\boldsymbol{\varepsilon}_{th}$ is thermal strain. I use the incremental thermo-elastoplastic constitutive relation
$$
\Delta \boldsymbol{\sigma} = \mathbf{D}^{ep}(\Delta \boldsymbol{\varepsilon} – \Delta \boldsymbol{\varepsilon}_{th}),
$$
where $\mathbf{D}^{ep}$ is the temperature-dependent elastoplastic matrix. The finite element equation for the stress update becomes
$$
\int_V \mathbf{B}^{\mathrm{T}} \mathbf{D}^{ep} \mathbf{B}\,dV \Delta \mathbf{u}
=
\Delta \mathbf{P}
+
\int_V \mathbf{B}^{\mathrm{T}} \mathbf{D}^{ep} \Delta \boldsymbol{\varepsilon}_{th}\,dV .
$$
I use this formulation because it allows the temperature history of the helical gear to drive the stress history in a sequential thermo-mechanical simulation. The first stage solves the temperature field, and the second stage imports that temperature history into the stress model. This sequential coupling is efficient and sufficiently accurate for the quenching of a helical gear when the thermal field is resolved carefully.
2. Numerical Quenching Model of the Helical Gear
I model a helical gear pair with a pinion and a wheel. The pinion has 41 teeth, and the wheel has 145 teeth. The normal module is 2.0 mm, the normal pressure angle is 20 degrees, and the helix angle is 21.6 degrees. The pinion has a left-hand helix and the wheel has a right-hand helix. The pinion face width is 50.0 mm, and the wheel face width is 45.0 mm. The center distance is 199.98 mm. I summarize the main geometric parameters in the table below.
| Parameter | Pinion | Wheel |
|---|---|---|
| Number of teeth | 41 | 145 |
| Normal module (mm) | 2.0 | 2.0 |
| Normal pressure angle (deg) | 20.0 | 20.0 |
| Helix angle (deg) | 21.6 | 21.6 |
| Helix direction | Left | Right |
| Profile shift coefficient | 0.345 | -0.3449 |
| Face width (mm) | 50.0 | 45.0 |
| Center distance (mm) | 199.98 | 199.98 |
The helical gear material is a low-carbon alloy steel. I use a material composition that is representative of a carburizing steel with high hardenability. The main alloying elements are summarized below.
| Element | Content (wt%) |
|---|---|
| C | 0.21 |
| Mn | 0.99 |
| Cr | 1.08 |
| Si | 0.35 |
| Ti | 0.064 |
| S | up to 0.035 |
| P | up to 0.035 |
For the quenching simulation of the helical gear, I use a two-stage cooling path. The helical gear starts at 850 degrees Celsius, is quenched in oil until it reaches about 80 degrees Celsius, and is then cooled in air at 25 degrees Celsius. The oil quenching heat transfer coefficient varies with surface temperature, and I include this variation in the thermal boundary condition. The air cooling stage uses a much lower convection coefficient. I set the initial temperature of both the helical gear and the oil to the prescribed values and allow surface heat exchange to drive the transient temperature field.
I discretize the helical gear with a fine mesh near the tooth surface and a coarser mesh in the core. The tooth flanks, tooth tips, end faces, and bore surfaces are treated as heat exchange surfaces. The cyclic symmetry of the helical gear is used to reduce the model size. For the stress analysis, I import the temperature history and apply elastic-plastic material behavior with temperature-dependent properties. The material density is 7850 kg/m3, the elastic modulus is about 200 GPa, and the Poisson ratio is about 0.30. I include an equivalent thermal expansion coefficient so that the volume change associated with phase transformation can be represented in the thermo-mechanical model.
3. Temperature Field and Stress Field Results of the Helical Gear
I find that the temperature field of the helical gear changes very quickly at the beginning of quenching. The tooth tip and the tooth flank cool fastest because they contact the oil directly and have a large exposed area. The tooth root also cools quickly, but slightly more slowly than the tooth tip. The core cools most slowly. As quenching proceeds, the maximum temperature region moves from the core toward the bore surface. This happens because the bore surface has a smaller contact area with the quenching medium than the external tooth surfaces. In the later stage, the helical gear temperature becomes nearly uniform and approaches the quenching medium temperature.
The stress history is strongly coupled to the temperature history. In the early cooling stage, the surface contracts faster than the core. The core resists this contraction, so the surface tends to develop tensile stress, while the core tends to develop compressive stress. As the martensitic transformation begins, the surface transforms first because it reaches the transformation temperature first. The volume expansion associated with martensite formation opposes the thermal contraction. Later, the core transforms and expands while the surface is already hard and less able to accommodate the expansion. The final result is a compressive residual stress state at the tooth surface and a tensile residual stress state in the core.
I summarize the qualitative evolution of the helical gear residual stress in the following table.
| Quenching stage | Tooth surface stress | Core stress | Dominant mechanism |
|---|---|---|---|
| Early cooling | Tensile | Compressive | Thermal contraction mismatch |
| Transformation start | Moving toward compression | Moving toward tension | Surface martensite expansion |
| Final cooling | Compressive | Tensile | Transformation and thermal strain history |
The tooth root is a critical region of the helical gear. I observe that the residual compressive stress at the tooth root is larger than that at the middle of the tooth flank. This is caused by the more complex geometry of the root and the associated restraint from the surrounding material. Therefore, when I introduce a beneficial compressive residual stress into the tooth surface of a helical gear, I also introduce a larger residual stress into the tooth root. This is an important point because the tooth root controls the bending fatigue performance of the helical gear.
4. Time-Varying Meshing Stiffness of the Helical Gear with Quenching Residual Stress
I calculate the time-varying meshing stiffness of the helical gear by using a single-node contact method. The contact region of a helical gear is elliptical, so I evaluate the normal contact force and elastic deformation at each node in the contact region. The mesh stiffness at node $i$ is
$$
k_i = \frac{F_i}{\delta_i}.
$$
I then sum the nodal stiffnesses over the contact region for the pinion and the wheel:
$$
k_p = \sum_{i=1}^{m} k_i,
$$
$$
k_g = \sum_{i=1}^{m} k_i.
$$
For the $j$-th tooth pair in contact, the combined mesh stiffness is
$$
k_j = \frac{k_p k_g}{k_p + k_g}, \qquad 1 \le j \le t,
$$
and the total meshing stiffness of the helical gear pair with $t$ tooth pairs in contact is
$$
k_t = \sum_{j=1}^{t} k_j.
$$
I compare my finite element stiffness result with the ISO average mesh stiffness formulation. The ISO average mesh stiffness is
$$
c_\gamma = c'(0.75\varepsilon_\alpha + 0.25),
$$
where $\varepsilon_\alpha$ is the transverse contact ratio, and the single-tooth stiffness is
$$
c’ = c_{th} C_M C_R C_B \cos\beta .
$$
Here, $C_M$ is a theoretical correction factor, $C_R$ is a wheel blank structure factor, $C_B$ is a basic rack factor, and $\beta$ is the helix angle. I use this comparison only as a reference to validate the order of magnitude and the general trend of the helical gear mesh stiffness.
| Method | Average time-varying mesh stiffness (N/mm) | Relative error with respect to ISO (%) |
|---|---|---|
| ISO reference | 6.220e5 | 0 |
| Published finite element result | 6.468e5 | 3.99 |
| My model without residual stress | 6.051e5 | 2.7 |
Without quenching residual stress, the time-varying meshing stiffness of the helical gear shows a repeated pattern within each mesh cycle. The stiffness increases when the contact changes from a four-tooth contact zone to a five-tooth contact zone, and the maximum stiffness appears in the five-tooth contact zone. There is also a small fluctuation in the four-tooth contact zone because of the transition from five-tooth contact to four-tooth contact.
When I include quenching residual stress, the time-varying meshing stiffness of the helical gear is not simply increased or decreased. Instead, the stiffness curve develops regional fluctuations. The peaks and troughs both become larger. The mean stiffness with residual stress is about 6.065e5 N/mm, while the mean stiffness without residual stress is about 6.051e5 N/mm. The increase in the mean value is small, but the local fluctuation is significant. This means that quenching residual stress can change the vibration excitation of the helical gear even when the average stiffness changes only slightly.
5. Ten-Degree-of-Freedom Dynamic Model of the Helical Gear Pair
I establish a ten-degree-of-freedom dynamic model for the helical gear pair. The model includes three translational motions and one torsional motion for each gear, plus one swing motion for each gear. The internal excitations include time-varying meshing stiffness, transmission error, backlash, and mesh damping. The external excitation is the input torque and the load torque.
The backlash function for the helical gear pair is
$$
f(\delta_n,b)=
\begin{cases}
\delta_n-b, & \delta_n > b,\\
0, & -b \le \delta_n \le b,\\
\delta_n+b, & \delta_n < -b,
\end{cases}
$$
where $b$ is half of the average normal backlash and $\delta_n$ is the displacement along the line of action. The transmission error of the helical gear is represented as
$$
e(t)=e_0+e_r\sin(2\pi f t+\phi_e),
$$
where $e_0$ is the mean transmission error, $e_r$ is the fluctuation amplitude, $f$ is the meshing frequency, and $\phi_e$ is the initial phase. The mesh damping is calculated as
$$
c_m = 2\zeta\sqrt{\frac{k_t m_1 m_2}{m_1+m_2}},
$$
where $\zeta$ is the damping ratio, $k_t$ is the time-varying meshing stiffness, and $m_1$ and $m_2$ are the equivalent masses of the pinion and the wheel.
The matrix form of the dynamic equation for the helical gear pair is
$$
\mathbf{M}\ddot{\mathbf{q}}+\mathbf{C}\dot{\mathbf{q}}+\mathbf{K}\mathbf{q}=\mathbf{F},
$$
where the displacement vector is
$$
\mathbf{q} =
\begin{bmatrix}
x_1 & y_1 & z_1 & \theta_{1z} & \theta_{1y} &
x_2 & y_2 & z_2 & \theta_{2z} & \theta_{2y}
\end{bmatrix}^{\mathrm{T}} .
$$
I write the equations of motion in expanded form as
$$
\begin{aligned}
m_1 \ddot{x}_1 + c_{1x}\dot{x}_1 + k_{1x}x_1 &= F_x,\\
m_1 \ddot{y}_1 + c_{1y}\dot{y}_1 + k_{1y}y_1 &= F_y,\\
m_1 \ddot{z}_1 + c_{1z}\dot{z}_1 + k_{1z}z_1 &= F_z,\\
J_{1z}\ddot{\theta}_{1z} &= F_n R_1 – T_1,\\
J_{1y}\ddot{\theta}_{1y} + c_{1y\theta}\dot{\theta}_{1y} + k_{1y\theta}\theta_{1y} &= R_1 F_y,\\
m_2 \ddot{x}_2 + c_{2x}\dot{x}_2 + k_{2x}x_2 &= -F_x,\\
m_2 \ddot{y}_2 + c_{2y}\dot{y}_2 + k_{2y}y_2 &= -F_y,\\
m_2 \ddot{z}_2 + c_{2z}\dot{z}_2 + k_{2z}z_2 &= -F_z,\\
J_{2z}\ddot{\theta}_{2z} &= -F_n R_2 + T_2,\\
J_{2y}\ddot{\theta}_{2y} + c_{2y\theta}\dot{\theta}_{2y} + k_{2y\theta}\theta_{2y} &= -R_2 F_y.
\end{aligned}
$$
The dynamic meshing forces along the coordinate directions are expressed as
$$
F_x =
k_t f(\delta_n,b)\sin\alpha_n
+
c_m \dot{\delta}_n \sin\alpha_n,
$$
$$
F_y =
k_t f(\delta_n,b)\cos\alpha_n \cos\beta
+
c_m \dot{\delta}_n \cos\alpha_n \cos\beta,
$$
$$
F_z =
k_t f(\delta_n,b)\cos\alpha_n \sin\beta
+
c_m \dot{\delta}_n \cos\alpha_n \sin\beta.
$$
The main dynamic parameters of the helical gear pair are listed below.
| Parameter | Pinion | Wheel |
|---|---|---|
| Mass (kg) | 2.74 | 11.15 |
| Moment of inertia (kg·m2) | 0.0028 | 0.14 |
| Support stiffness in x (N/m) | 2.3e8 | 3.7e8 |
| Support stiffness in y (N/m) | 2.3e8 | 3.7e8 |
| Support stiffness in z (N/m) | 1.5e8 | 2.0e8 |
| Swing stiffness (N/m) | 1.5e6 | 2.0e6 |
| Equivalent damping (N·s/m) | 1.5e3 | 1.5e3 |
| Rotational speed (rpm) | 20900 | 5909.63 |
| Power (kW) | 1500 | 1500 |
6. Dynamic Response of the Helical Gear under Quenching Residual Stress
I solve the dynamic equations of the helical gear pair using the Runge-Kutta method. I first calculate the dynamic meshing force without quenching residual stress. The mean tangential meshing force is about 16731.99 N. The value calculated directly from torque and pitch radius is about 16717.23 N. The difference is only 0.08 percent, which indicates that my dynamic model is consistent with the static load relation.
When I include quenching residual stress, the dynamic meshing force of the helical gear becomes more strongly fluctuating. The peak normal meshing force increases by about 1843.2 N, which is an increase of about 8.47 percent. The amplitude difference of the normal meshing force increases from about 4684 N to about 7566.4 N. The impact phenomenon becomes more obvious, but the impact period does not change significantly. This means that quenching residual stress mainly changes the amplitude of the dynamic response rather than the fundamental timing of the helical gear meshing cycle.
| Quantity | Without quenching residual stress | With quenching residual stress | Change |
|---|---|---|---|
| Mean tangential force (N) | 16731.99 | Approximately similar mean level | Small |
| Peak normal force increase (N) | Reference | 1843.2 | 8.47% |
| Normal force amplitude difference (N) | 4684 | 7566.4 | Large increase |
In the frequency domain, I identify the pinion rotational frequency as about 348.33 Hz and the wheel rotational frequency as about 98 Hz. The meshing frequency of the helical gear pair is about 14281 Hz. Without quenching residual stress, the spectrum is dominated by the meshing frequency. There are also sidebands around the meshing frequency and its harmonics. When quenching residual stress is included, the amplitude spectral density at the rotational frequency increases slightly. The amplitude spectral density at the meshing frequency increases more strongly. For the normal load, the meshing-frequency amplitude spectral density increases by about 29.8 percent. For the second harmonic, the amplitude spectral density decreases by about 16.03 percent. Therefore, quenching residual stress affects both low-frequency and high-frequency components of the dynamic meshing force of the helical gear.
I also examine the vibration displacement of the pinion and the wheel. The pinion displacement in the x direction is about 0 to 2.983e-5 m. The displacement in the y direction is about 0 to 6.814e-5 m. The displacement in the z direction is about 0 to 4.516e-5 m. The swing displacement is about 0 to 10.032e-4 rad. The largest translational displacement of the pinion occurs in the y direction. The wheel shows the same ordering, but the displacement magnitudes are smaller because the wheel operates at a lower speed and has a larger inertia.
| Direction | Pinion displacement range | Wheel displacement range |
|---|---|---|
| x | 0 to 2.983e-5 m | 0 to 1.914e-5 m |
| y | 0 to 6.814e-5 m | 0 to 4.654e-5 m |
| z | 0 to 4.516e-5 m | 0 to 3.946e-5 m |
| Swing | 0 to 10.032e-4 rad | 0 to 10.931e-4 rad |
The vibration acceleration spectrum of the helical gear shows that quenching residual stress influences not only the first meshing harmonic but also higher harmonics. In the x direction, the acceleration amplitude at the meshing frequency increases by about 94.187 percent when residual stress is considered. The second harmonic increases by about 120.087 percent, and the third harmonic increases by about 61.4 percent. This means that the high-frequency vibration of the helical gear can be significantly amplified by quenching residual stress, even when the average stiffness change is small.
| Vibration acceleration component in x | Increase due to quenching residual stress |
|---|---|
| First meshing harmonic | 94.187% |
| Second meshing harmonic | 120.087% |
| Third meshing harmonic | 61.4% |
7. Meshing Characteristics of the Helical Gear under Dynamic Load and Residual Stress
I analyze the meshing behavior of the helical gear by applying the dynamic meshing force to the finite element contact model. The dynamic force is converted into a dynamic torque through the base circle radius and applied to the driven wheel. I examine the tooth surface stress, contact stress, contact force, contact area, elastic deformation, and tooth root stress at different rotation angles.
For the tooth surface Mises stress, the maximum value without residual stress is about 446 MPa, and the maximum value with residual stress is about 416 MPa. The location of the maximum Mises stress is at the contact region. The reduction is about 30 MPa. This reduction occurs because the tooth surface residual stress is mainly compressive. I also observe that the stress concentration near the tooth root in the model without residual stress is reduced when residual stress is included. This indicates that quenching residual stress changes both the contact stress state and the bending stress state of the helical gear.
| Tooth surface quantity | Without residual stress | With residual stress | Difference |
|---|---|---|---|
| Maximum Mises stress (MPa) | 446 | 416 | -30 |
| Maximum contact stress (MPa) | 654 | 607 | -47 |
| Maximum contact force (N) | 598 | 553 | -45 |
| Maximum nodal contact area (mm2) | 0.778 | 0.771 | -0.007 |
| Maximum elastic deformation (µm) | 34.8 | 31.5 | -3.3 |
The contact stress of the helical gear shows the same trend as the Mises stress. The maximum contact stress without residual stress is about 654 MPa, while the maximum contact stress with residual stress is about 607 MPa. The difference is about 47 MPa. The contact force also decreases from about 598 N to about 553 N. The nodal contact area changes only slightly, from about 0.778 mm2 to about 0.771 mm2. The elastic deformation decreases from about 34.8 µm to about 31.5 µm. These results show that the compressive residual stress on the tooth surface reduces the elastic deformation during meshing.
The tooth root response is even more sensitive to residual stress. In the model without residual stress, the maximum tooth root Mises stress near the loaded side is about 370 MPa. In the model with residual stress, the corresponding value is about 242 MPa. The difference is about 128 MPa. This is larger than the difference observed on the tooth surface. Therefore, I conclude that quenching residual stress has a strong influence on the tooth root stress of the helical gear under dynamic load.
| Tooth root quantity | Without residual stress | With residual stress | Difference |
|---|---|---|---|
| Maximum root Mises stress (MPa) | 370 | 242 | -128 |
8. Fatigue Life of the Helical Gear under Quenching Residual Stress
I use the nominal stress method and linear fatigue damage accumulation to evaluate the fatigue life of the helical gear. The Miner linear damage rule is
$$
D = \sum_{i=1}^{n} \frac{n_i}{N_i},
$$
where $n_i$ is the number of cycles at stress level $i$ and $N_i$ is the fatigue life at that stress level. Failure is assumed when $D$ reaches the critical value. I describe the material S-N curve by the power-law relation
$$
\sigma^m N = C,
$$
or, in logarithmic form,
$$
\lg N = \lg C – m \lg \sigma .
$$
I generate the material fatigue data for the helical gear steel by using the Seeger method because the exact material data are not directly available in the fatigue software library. I then apply a Goodman mean stress correction. The dynamic load history is imported from the finite element contact analysis of the helical gear. I compare two load cases: a lower-fluctuation load and a higher-fluctuation load, both with and without quenching residual stress.
| Load case | Quenching residual stress | Logarithmic fatigue life | Approximate cycles |
|---|---|---|---|
| Load 1 | No | 5.565 | 367282 |
| Load 1 | Yes | 5.991 | 979489 |
| Load 2 | No | 5.666 | 463446 |
| Load 2 | Yes | 6.103 | 1267651 |
The results show that the fatigue life decreases when the load fluctuation becomes more severe. However, the influence of quenching residual stress is larger than the influence of the dynamic load fluctuation in the cases I study. For load 2, the logarithmic fatigue life without residual stress is 5.666, and the logarithmic fatigue life with residual stress is 6.103. This means that the compressive residual stress at the tooth surface and tooth root substantially improves the fatigue life of the helical gear. I also observe low-fatigue regions on both the tooth surface and near the tooth root. The low-fatigue region near the tooth root becomes smaller when residual stress is included. Therefore, I conclude that fatigue analysis of a helical gear should consider both the dynamic meshing force and the quenching residual stress.
9. Crack Propagation in the Helical Gear under Quenching Residual Stress
I further investigate the effect of quenching residual stress on tooth root crack propagation. I use an interaction integral, also called the M-integral, to calculate the stress intensity factors along the crack front. The relation between the M-integral and the stress intensity factors is
$$
M^{(1,2)} =
\frac{1-\nu}{E}K_I^{(1)}K_I^{(2)}
+
\frac{1-\nu}{E}K_{II}^{(1)}K_{II}^{(2)}
+
\frac{1}{E}K_{III}^{(1)}K_{III}^{(2)} .
$$
Here, $K_I$, $K_{II}$, and $K_{III}$ are the mode I, mode II, and mode III stress intensity factors. Once the stress intensity factors are known, I can estimate the local crack growth increment along the crack front. I set the crack growth increment at the midpoint of the crack front to a fixed value and scale the other points by
$$
\Delta a_i = \Delta a_{mid}\frac{K_i}{K_{mid}} .
$$
I use the Paris law to relate the crack growth rate to the stress intensity factor range:
$$
\frac{da}{dN} = C(\Delta K)^n .
$$
For the helical gear steel, I use $C = 6.02\times 10^{-11}$ and $n = 1.5$ in consistent units. The plane strain fracture toughness is about 128 MPa·m1/2. I insert an initial elliptical crack at the tooth root with a short-axis radius of 0.5 mm and a long-axis radius of 1.0 mm. I then allow the crack to propagate step by step under the dynamic load of the helical gear.
The crack front evolution shows that mode I is dominant. The mode I stress intensity factor is much larger than the mode II and mode III factors. The mode I stress intensity factor is positive along the entire crack front. It is larger at the two ends of the crack front and smaller near the middle. As the crack grows, the stress intensity factor increases. The increase at the end that is closer to the tooth surface is more pronounced than the increase at the other end. This means that the crack tends to grow more rapidly in the tooth surface direction than in the depth direction. However, the maximum crack growth rate does not occur exactly at the tooth surface. It occurs at a subsurface location near the tooth surface. This is an important feature of the helical gear crack behavior under residual stress.
| Crack front location | Mode I stress intensity factor trend | Growth tendency |
|---|---|---|
| Near tooth surface | High at the ends, lower in the middle | Stronger surface-directed growth |
| Subsurface | Maximum value appears below the surface | Maximum growth rate |
| Deep region | Increases as crack grows deeper | Accelerated by tensile core stress |
When I include quenching residual stress, the initial stress intensity factor at the crack ends decreases. This indicates that the compressive residual stress near the tooth surface suppresses the initial crack growth. As the crack grows deeper, the crack tip moves beyond the compressive residual stress zone and enters a region where the residual stress becomes tensile. Then the crack growth is promoted rather than suppressed. Therefore, the influence of quenching residual stress on crack propagation is not uniform. It changes with crack depth and crack front position.
I compare the fatigue crack growth life with and without quenching residual stress. In the early stages, the residual stress increases the number of cycles required for a given crack extension because the compressive stress field suppresses crack opening. In the later stages, the tensile core stress accelerates crack growth. In my model, the final number of cycles increases from about 133215 to about 136013 when residual stress is included. This is an increase of about 2.1 percent. The increase is modest because the beneficial surface compression and the detrimental core tension partly offset each other.
| Condition | Final cycle count | Change relative to no residual stress |
|---|---|---|
| No residual stress | 133215 | Reference |
| With residual stress | 136013 | +2.1% |
I also study the effect of stress ratio on crack propagation because the dynamic meshing force of the helical gear changes the load ratio. I consider stress ratios of 0.10, 0.15, and 0.20. As the stress ratio increases, the minimum load and maximum load both increase, and the effective stress intensity factor range decreases. The crack growth rate therefore decreases, and the fatigue life increases. In my model, when the stress ratio changes from 0.10 to 0.15, the crack propagation cycle count increases from about 133215 to about 144595. This is an increase of about 8 percent. The effect is strongest near the crack front ends close to the tooth surface and weaker near the middle of the crack front.
| Stress ratio | Approximate final cycle count | Change |
|---|---|---|
| 0.10 | 133215 | Reference |
| 0.15 | 144595 | +8% |
These results show that the effect of quenching residual stress on crack propagation in a helical gear has two parts. The first part is the direct effect of the residual stress field on the stress intensity factor. The second part is the indirect effect caused by the change in dynamic meshing force, which changes the load ratio and the stress intensity factor range. Both parts must be considered when I evaluate the fatigue crack growth life of a helical gear.
10. Discussion
The results I obtain show that quenching residual stress is not a minor correction for a helical gear. It changes the time-varying meshing stiffness curve, and this change propagates into the dynamic meshing force, vibration displacement, vibration acceleration, contact stress, tooth root stress, fatigue life, and crack propagation. The most important observation is that the effect is not a simple uniform increase or decrease. The residual stress field is nonuniform. The tooth surface is generally compressive, while the core is tensile. The tooth root can have even larger compressive stress than the tooth flank. Therefore, the same residual stress field can improve some fatigue metrics while simultaneously creating a more complex crack growth condition.
For the helical gear, the time-varying meshing stiffness with residual stress has larger peaks and troughs. This increases the dynamic excitation. The dynamic meshing force amplitude becomes larger, and the frequency spectrum changes. The normal and tangential components are more affected than the axial component. The vibration acceleration at the meshing frequency and at higher harmonics increases. This means that a helical gear designed only by static strength may still show unexpected vibration or fatigue problems if quenching residual stress is ignored.
The contact analysis shows that the compressive residual stress on the tooth surface reduces the Mises stress, contact stress, and contact force. It also reduces the elastic deformation during meshing. These are beneficial effects for contact fatigue and wear resistance. The tooth root stress is also reduced when residual stress is included. This is beneficial for bending fatigue. The fatigue life calculation confirms that the compressive residual stress increases the fatigue life of the helical gear under the same dynamic load. However, the crack propagation analysis shows that once a crack grows beyond the compressive surface layer, the tensile core stress can accelerate the crack. This means that the benefit of quenching residual stress is strongest before crack initiation and in the early crack growth stage. After the crack becomes deep, the benefit may decrease or reverse.
I also find that the dynamic load and the residual stress should not be treated separately. The dynamic load changes the stress ratio and the stress intensity factor range. The residual stress changes the mean stress and the local stress intensity factor. In a helical gear, both effects act at the same time. The fatigue life prediction without residual stress is not conservative in the same way as the prediction with residual stress, and the crack growth prediction without residual stress does not capture the transition from surface suppression to core acceleration.
11. Conclusions
I draw the following conclusions from my analysis of the helical gear under quenching residual stress.
First, the cooling rate of the helical gear is nonuniform. The tooth tip and tooth root cool faster than the core. The tooth tip cools fastest. Because of the coupling between thermal strain and phase transformation strain, the tooth surface stress first becomes tensile and then compressive, while the core stress first becomes compressive and then tensile. After quenching, the helical gear has a compressive tooth surface and a tensile core. Introducing compressive residual stress into the tooth surface also introduces larger residual stress into the tooth root.
Second, quenching residual stress changes the time-varying meshing stiffness of the helical gear. The change is not a simple increase or decrease. The stiffness curve develops regional fluctuations, and both peaks and troughs become larger. The mean stiffness changes only slightly, but the local dynamic excitation changes significantly.
Third, the dynamic meshing force of the helical gear becomes larger when quenching residual stress is included. The peak normal force increases, and the force amplitude difference becomes larger. The rotational frequency and meshing frequency amplitude spectral densities increase. The meshing frequency change is more significant than the rotational frequency change. The normal and tangential components are more affected than the axial component. The vibration acceleration at the first, second, and third meshing harmonics also increases.
Fourth, the tooth surface Mises stress, contact stress, and contact force are lower when quenching residual stress is included. The elastic deformation during meshing is also lower because of the compressive tooth surface stress. The tooth root stress shows a similar reduction. The fatigue life of the helical gear increases when quenching residual stress is included. The effect of residual stress on fatigue life is larger than the effect of the dynamic load fluctuation in the cases I study.
Fifth, the crack growth rate in the tooth surface direction is higher than that in the depth direction. The maximum crack growth rate point is located at the subsurface rather than exactly on the tooth surface. The crack tip near the tooth surface is suppressed by the compressive residual stress, while the crack tip far from the tooth surface is accelerated by the tensile residual stress. The effect of quenching residual stress on crack propagation includes both the direct effect on the stress intensity factor and the indirect effect caused by residual-stress-induced load fluctuation.
Overall, I conclude that a helical gear design and fatigue assessment should include quenching residual stress as an active mechanical variable rather than a fixed material property. The residual stress field changes the meshing stiffness, the dynamic response, the contact state, the fatigue life, and the crack propagation path of the helical gear. A complete analysis of a high-speed heavy-load helical gear should therefore couple the heat treatment history with the dynamic meshing behavior and the fatigue damage evolution.