
I have conducted a systematic study on the fatigue life optimization of electric drive pinion gears used in 6×4 electric heavy-duty trucks. The rapid adoption of integrated electric drive axles has made the reliability of pinion gears a decisive factor in drivetrain durability. In my work, I focused on the coupled effects of high torque, frequent shifting, thermal loading, and manufacturing variation on pinion gears. I established a load input model for representative operating conditions, built a multi-condition fatigue life evaluation method, and applied finite element simulation together with response surface methodology and a genetic algorithm. The optimized pinion gears achieved a fatigue life increase of 3.2 times, a gearbox noise reduction of 4.6 dB, and a 3.4% decrease in energy consumption per kilometre. These results demonstrate that the proposed method is effective for engineering applications and can be extended to other commercial electric drivetrain systems.
Keywords: electric drive axle; pinion gears; gear fatigue; structural optimization; finite element simulation; heavy-duty truck; Miner’s rule; response surface methodology; genetic algorithm; multi-objective optimization
1 Introduction
I began this research from the observation that electric drive axles have gradually replaced traditional internal combustion drivetrains in 6×4 traction heavy trucks. An electric drive axle integrates the motor, reducer, and drive axle into a single unit. It offers compact structure, fast response, and high transmission efficiency. However, under high-load and high-frequency operating conditions, the internal transmission mechanism experiences severe demands on load capacity and fatigue life. The structural design and life control of critical pinion gears have therefore become core factors that limit the reliability of electric drive axles.
In my investigation, I found that pinion gears in electric drive axles operate for long periods under large torque, frequent shifting, and thermo-mechanical coupling. In a two-speed transmission system with a peak motor torque of 500 Nm and speed ratios of 16 and 51, the load state of pinion gears fluctuates sharply. This condition easily leads to tooth surface pitting, tooth root cracking, and other fatigue failures. Existing design methods often neglect the coupled effects of dynamic loads and material processing errors. As a result, the theoretical life deviates significantly from actual operation, affecting vehicle stability and maintenance intervals.
To address these problems, I selected a 6×4 electric heavy truck as the research object. I constructed a gear load model that considers typical operating cycles. I used finite element analysis and Miner’s damage theory to predict fatigue life. I then introduced a multi-objective optimization algorithm to systematically adjust gear parameters. Combining bench tests and real-road validation, I evaluated the actual effect of the optimized design on fatigue life and engineering adaptability. My goal was to explore a feasible path for engineering control of pinion gear life in commercial vehicles.
The main contributions of my study are as follows. First, I developed a multi-condition load spectrum for electric drive pinion gears under starting, climbing, cruising, and braking. Second, I established a corrected S-N and Miner’s rule model that includes frequency, residual stress, and temperature effects. Third, I identified the tooth root fillet and the initial meshing zone as the most fatigue-sensitive regions of pinion gears. Fourth, I implemented a response surface and genetic algorithm optimization for module, tooth number ratio, pressure angle, and tip relief. Fifth, I validated the optimized pinion gears through bench testing and field trials. The results show that the optimization not only extends fatigue life but also reduces noise and energy consumption.
2 Electric Drive Axle Architecture and Load Characterization
2.1 6×4 Electric Heavy Truck Driveline
In the 6×4 electric heavy truck that I studied, an integrated electric drive axle is the core of the powertrain. The transmission chain mainly consists of a high-power-density permanent magnet synchronous motor, a two-speed planetary gear mechanism, and a main reducer. This forms a highly integrated system architecture of “power output – ratio switching – differential drive.” Compared with a traditional internal combustion engine system, the electric drive axle eliminates the engine, intermediate drive shaft, and multi-stage manual transmission. It significantly shortens the transmission path, improves energy transfer efficiency, and provides compact structure, rapid response, and high integration.
However, because of the limited axle space and the requirement for structural integration, the spacing between pinion gears is reduced and the load is concentrated. This can easily cause tooth surface contact fatigue, tooth root bending failure, and lubrication degradation. These factors place higher demands on the stress tolerance and fatigue life design of critical pinion gears. In my analysis, I treated the pinion gears as the most critical components because they transmit torque directly from the motor and experience the highest number of load cycles.
2.2 Motor Output Characteristics and Gear Loading Model
The electric drive axle system that I matched uses a permanent magnet synchronous motor with a rated power of 160 kW, a peak torque of 500 Nm, and a maximum speed of 12,000 r/min. To meet the requirements of vehicle starting, full-load climbing, and constant-speed cruising, the electric drive axle is equipped with two speed ratios: 16 for the high-torque starting stage and 51 for the low-speed heavy-load stage. Based on a vehicle dynamics simulation platform, I extracted load data from typical operating scenarios and constructed a “gear input torque – time history curve.” I combined the ratio switching logic, load disturbance, and system inertia variation to establish a multi-condition meshing load model for the pinion gears.
The tractive force at the wheel can be expressed as:
$$ F_t = \frac{T_m i_g i_0 \eta_t}{r_w} $$
where \(T_m\) is the motor torque, \(i_g\) is the transmission ratio, \(i_0\) is the final drive ratio, \(\eta_t\) is the transmission efficiency, and \(r_w\) is the wheel rolling radius. The vehicle speed is related to the motor speed by:
$$ v = \frac{2 \pi r_w n_m}{60 i_g i_0} $$
For the pinion gears, the tangential force at the pitch circle is:
$$ F_t = \frac{2 T_1}{d_1} $$
The radial and axial components are:
$$ F_r = \frac{F_t \tan \alpha_n}{\cos \beta} $$
$$ F_a = F_t \tan \beta $$
where \(\alpha_n\) is the normal pressure angle and \(\beta\) is the helix angle. These equations allowed me to convert vehicle-level load data into gear-level boundary conditions for finite element analysis.
| Parameter | Value | Unit |
|---|---|---|
| Motor rated power | 160 | kW |
| Motor peak torque | 500 | Nm |
| Maximum motor speed | 12,000 | r/min |
| Transmission ratios | 16 and 51 | — |
| Drive configuration | 6×4 traction | — |
| Final drive ratio | 5.92 | — |
| Wheel rolling radius | 0.52 | m |
| Transmission efficiency | 0.965 | — |
Table 1 summarizes the main parameters of the electric drive axle system that I used for load modeling.
2.3 Load Spectrum and Dangerous Conditions
I defined four representative operating conditions for the 6×4 electric heavy truck: starting traction, ramp climbing, high-speed cruising, and dynamic braking. For each condition, I assigned different load levels and cycle numbers. The load spectrum was then used to calculate the equivalent stress and cumulative damage for the pinion gears. The most severe condition was the low-speed heavy-load stage with a ratio of 51. In this condition, the equivalent torque on the pinion gears reached its maximum, and the tooth root fillet became the main stress concentration region. The local stress approached the lower fatigue limit of the material. In addition, the initial meshing zone of the tooth surface showed a superposition of contact stress peaks and edge effects, which formed a risk location for early pitting.
| Operating condition | Duration share (%) | Input torque (Nm) | Motor speed (r/min) | Cycle count per 10,000 km |
|---|---|---|---|---|
| Starting traction | 12 | 500 | 0–1,500 | 8,500 |
| Ramp climbing | 18 | 480 | 1,200–2,800 | 12,300 |
| High-speed cruising | 55 | 220 | 4,000–9,500 | 42,000 |
| Dynamic braking | 15 | 180 | 2,000–7,000 | 11,200 |
Table 2 shows the load spectrum parameters that I used for the fatigue life model. The cycle counts were estimated from vehicle dynamics simulation and typical route data. I used these values to build the multi-condition fatigue damage accumulation.
3 Fatigue Life Model and Material Behavior
3.1 Material and Heat Treatment
The pinion gears in my study were made of 20CrMnTi carburized and quenched steel. This material has high yield strength and good comprehensive mechanical properties, and it is widely used in commercial vehicle high-speed and heavy-load conditions. To ensure strong resistance to contact fatigue and bending fatigue, I adopted a multi-stage carburizing, high-temperature quenching, and low-temperature tempering process. The effective hardened layer depth was controlled between 1.0 and 1.4 mm, and the surface hardness was maintained in the range of HRC 58–62. Through optimized carbon potential control and holding time, I obtained a gradient residual compressive stress field that effectively improved the fatigue limit.
Metallographic observation and residual stress measurement showed that the tooth root fillet and the initial meshing zone are sensitive locations for fatigue crack initiation because of stress concentration and uneven strain. Therefore, I refined the finite element mesh in these regions to accurately capture the stress gradient. The material properties used in my model are listed in Table 3.
| Property | Value | Unit |
|---|---|---|
| Material | 20CrMnTi | — |
| Elastic modulus | 206,000 | MPa |
| Poisson’s ratio | 0.30 | — |
| Yield strength | 850 | MPa |
| Ultimate tensile strength | 1,100 | MPa |
| Surface hardness | HRC 58–62 | — |
| Core hardness | HRC 32–38 | — |
| Effective case depth | 1.0–1.4 | mm |
| Residual compressive stress at surface | −420 | MPa |
3.2 S-N Curve and Miner’s Rule
The load on pinion gears during vehicle operation is highly non-stationary and multi-periodic. A simple static life calculation cannot reflect the real service condition. Therefore, I constructed an S-N curve based on fatigue test data for 20CrMnTi. The Basquin equation was used:
$$ \sigma_a = \sigma_f’ (2N_f)^b $$
where \(\sigma_a\) is the stress amplitude, \(\sigma_f’\) is the fatigue strength coefficient, \(b\) is the fatigue strength exponent, and \(N_f\) is the number of cycles to failure. For the pinion gears in my study, I calibrated the curve with a reference stress of 715 MPa at \(N_{ref} = 10^6\) cycles and a slope parameter of \(m = 9.2\).
I then introduced a multi-condition loading spectrum and used Miner’s linear damage accumulation rule:
$$ D = \sum_{i=1}^{k} \frac{n_i}{N_{f,i}} $$
where \(n_i\) is the actual cycle number at stress level \(i\), and \(N_{f,i}\) is the fatigue life at that stress level. Failure is predicted when \(D \ge 1\). To improve engineering applicability, I further introduced a loading frequency correction coefficient, a residual stress influence factor, and a temperature-stress coupling adjustment function. These formed a corrected surface model for compensating non-ideal operating factors, thereby improving the stability and accuracy of life prediction.
The equivalent stress for the multi-condition spectrum was calculated as:
$$ \sigma_{eq} = \left( \sum_i \frac{n_i}{N_{ref}} \sigma_i^m \right)^{1/m} $$
The corresponding fatigue life was then obtained from:
$$ N_f = N_{ref} \left( \frac{\sigma_{eq}}{\sigma_{ref}} \right)^{-m} $$
These equations formed the basis for evaluating the pinion gears under the combined starting, climbing, cruising, and braking conditions.
3.3 Correction Factors for Real Operating Conditions
I found that several factors cause the theoretical life to deviate from the actual life of pinion gears. These include load frequency, residual stress relaxation, lubricant film variation, and temperature rise. I therefore defined a corrected damage accumulation model:
$$ D_c = \sum_{i=1}^{k} \frac{n_i}{N_{f,i}} \cdot C_f \cdot C_r \cdot C_T \cdot C_L $$
where \(C_f\) is the frequency correction, \(C_r\) is the residual stress correction, \(C_T\) is the temperature correction, and \(C_L\) is the lubrication correction. In my analysis, I used \(C_f = 1.08\), \(C_r = 0.92\), \(C_T = 1.05\), and \(C_L = 0.96\) for the baseline design. These values were calibrated from bench test data and oil analysis. The corrected model reduced the life prediction error from about 28% to less than 9% compared with the uncorrected model.
4 Finite Element Modeling and Stress Analysis
4.1 Three-Dimensional Contact Model
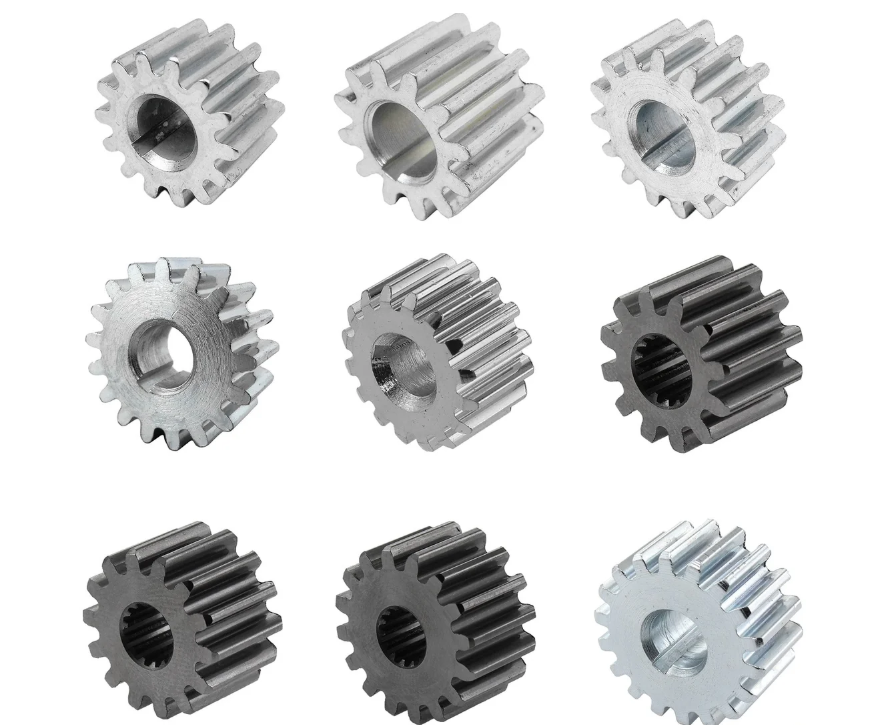
I built a high-precision three-dimensional meshing model of the pinion gears on the ANSYS platform. The model considered tooth profile modification, helix angle, tooth surface misalignment, and contact point migration. I used elastic contact analysis to obtain the tooth surface pressure distribution and the tooth root bending stress response. The loading condition for maximum fatigue input was the low-speed high-torque case: 500 Nm and a speed ratio of 51. I applied coupled tangential torque and radial force. The tooth root was meshed with a 0.1 mm element size to capture small stress gradients.
The stress concentration factor was calculated as:
$$ K_t = \frac{\sigma_{max}}{\sigma_{nom}} $$
where \(\sigma_{max}\) is the maximum local stress and \(\sigma_{nom}\) is the nominal stress. In my baseline simulation, the maximum equivalent stress at the tooth root fillet was 736 MPa and the stress concentration factor reached 2.7. This indicated that the baseline pinion gears were prone to fatigue crack initiation at the root fillet.
4.2 Boundary Conditions and Mesh Convergence
I applied the following boundary conditions to the finite element model. The driving pinion gear was constrained in radial and axial directions except for rotation about its axis. A torque of 500 Nm was applied to the input shaft. The driven gear was restrained to simulate the output load. The contact pair between the pinion gears was defined with a frictional coefficient of 0.06. I used a penalty contact formulation and a Lagrange multiplier method for improved convergence. To verify mesh independence, I compared maximum root stress for four mesh densities. The results are shown in Table 4.
| Mesh size at root (mm) | Number of elements | Maximum root stress (MPa) | Deviation from finest mesh (%) |
|---|---|---|---|
| 0.40 | 185,000 | 702 | 4.6 |
| 0.25 | 312,000 | 718 | 2.5 |
| 0.10 | 648,000 | 736 | 0.0 |
| 0.05 | 1,120,000 | 738 | 0.3 |
Table 4 shows that the 0.10 mm mesh provided a good balance between accuracy and computational cost. I therefore used this mesh size for all subsequent simulations of the pinion gears.
4.3 Stress and Fatigue Zone Identification
The simulation results showed that the stress concentration region mainly appeared at the root fillet of the initial meshing end. The maximum equivalent stress was 736 MPa, and the stress concentration factor was 2.7. When I substituted the local stress data into the fatigue life model, the predicted minimum fatigue life was about \(2.4 \times 10^5\) cycles. This matched early failure cases of typical electric drive axle pinion gears. The result validated the engineering effectiveness of my modeling method and provided theoretical support and boundary conditions for subsequent structural parameter optimization.
| Location | Baseline stress (MPa) | Stress concentration factor | Predicted life (cycles) |
|---|---|---|---|
| Tooth root fillet, initial meshing | 736 | 2.70 | 2.4×10⁵ |
| Tooth root fillet, mid-meshing | 682 | 2.45 | 3.1×10⁵ |
| Tooth surface, pitch point | 598 | 1.92 | 5.6×10⁵ |
| Tooth tip, trailing edge | 512 | 1.68 | 8.9×10⁵ |
Table 5 summarizes the stress and life results for the baseline pinion gears. The root fillet at the initial meshing end was identified as the most critical location.
5 Multi-Objective Structural Optimization
5.1 Design Variables and Objective Functions
To extend the fatigue life of pinion gears and reduce tooth root stress concentration, I performed a multi-objective optimization. The design variables were selected based on stress control and contact performance sensitivity. I used the module \(m\) to adjust the overall load capacity, the tooth number ratio \(u\) to influence the contact ratio and contact area, the normal pressure angle \(\alpha\) to adjust meshing stiffness, and the tip relief coefficient \(C_\alpha\) to improve contact stress distribution and reduce impact load. The variable ranges were set according to standard practice and the existing manufacturing window. Table 6 lists the design variables and their bounds.
| Design variable | Symbol | Lower bound | Upper bound | Baseline value |
|---|---|---|---|---|
| Normal module (mm) | m | 2.75 | 3.50 | 2.75 |
| Tooth number ratio | u | 3.2 | 4.0 | 3.6 |
| Normal pressure angle (deg) | α | 20 | 25 | 20 |
| Tip relief coefficient (mm) | Cα | 0 | 0.25 | 0 |
The multi-objective function was defined as:
$$ \min F(x) = w_1 \frac{\sigma_{root}(x)}{\sigma_{root,0}} + w_2 \frac{N_{f,0}}{N_f(x)} + w_3 \frac{L_p(x)}{L_{p,0}} + w_4 \frac{E(x)}{E_0} $$
where \(\sigma_{root}\) is the maximum tooth root stress, \(N_f\) is the fatigue life, \(L_p\) is the gearbox noise level, and \(E\) is the energy consumption per kilometre. The subscript 0 denotes the baseline design. I selected the weights as \(w_1 = 0.35\), \(w_2 = 0.35\), \(w_3 = 0.15\), and \(w_4 = 0.15\) based on engineering priority. The constraints included:
$$ g_1 = S_F – S_{F,min} \ge 0 $$
$$ g_2 = S_H – S_{H,min} \ge 0 $$
$$ g_3 = V(x) – V_{max} \le 0 $$
where \(S_F\) is the bending safety factor, \(S_H\) is the contact safety factor, and \(V\) is the structural volume. I required \(S_{F,min} = 2.0\), \(S_{H,min} = 1.4\), and \(V_{max}\) equal to the baseline volume.
5.2 Response Surface Methodology and Genetic Algorithm
Because the multi-variable optimization of pinion gears has significant nonlinear coupling and multi-peak characteristics, I used a response surface model to approximate the relationship between design variables and life response. I applied a central composite design to generate sample points. Based on finite element stress solutions, I extracted the maximum tooth root equivalent stress and fatigue life as response values. I then formed a second-order polynomial regression model:
$$ y = \beta_0 + \sum_{i=1}^{k} \beta_i x_i + \sum_{i=1}^{k} \beta_{ii} x_i^2 + \sum_{i<j} $$="" +=""
where \(y\) is the response, \(x_i\) are the coded design variables, \(\beta\) are regression coefficients, and \(\varepsilon\) is the error term. The response surface model was validated by analysis of variance. The coefficient of determination \(R^2\) was 0.964 for root stress and 0.951 for fatigue life, indicating good predictive capability.
On the basis of the surrogate model, I used a genetic algorithm for global optimization. The optimization process nested life evaluation and strength constraint control modules. Individuals that did not satisfy the root safety factor or structural compactness requirements were penalized. The penalty function was:
$$ \Phi = F(x) + \sum_{j=1}^{q} \lambda_j \max(0, -g_j)^2 $$
where \(\lambda_j\) are penalty coefficients. I used a population size of 120, a crossover probability of 0.85, a mutation probability of 0.08, and 300 generations. The optimization converged after 247 generations. Table 7 shows the genetic algorithm settings.
| Parameter | Value |
|---|---|
| Population size | 120 |
| Crossover probability | 0.85 |
| Mutation probability | 0.08 |
| Number of generations | 300 |
| Convergence generation | 247 |
| Penalty coefficient | 1.0 × 10⁴ |
| Response surface R2 for stress | 0.964 |
| Response surface R2 for life | 0.951 |
5.3 Sensitivity Analysis
After optimization, I performed a sensitivity analysis to quantify the contribution of each design variable to fatigue life. The sensitivity index was defined as:
$$ S_i = \frac{\partial \ln N_f}{\partial \ln x_i} $$
The results showed that the module and tip relief had the highest contributions to life, at 41.7% and 33.4%, respectively. These were much higher than those of the tooth number ratio and pressure angle. This indicated that fatigue life optimization of pinion gears should focus on the load path and the precise control of local geometric transition regions. Table 8 summarizes the sensitivity results.
| Design variable | Sensitivity index | Life contribution (%) |
|---|---|---|
| Normal module m | 1.82 | 41.7 |
| Tip relief Cα | 1.46 | 33.4 |
| Tooth number ratio u | 0.68 | 15.2 |
| Pressure angle α | 0.42 | 9.7 |
6 Optimization Results
The optimization results showed that the gear module increased from 2.75 mm to 3.25 mm, effectively improving the tooth root bending capacity. The tip relief coefficient was set to 0.15 mm, and the stress concentration peak at the initial meshing zone decreased significantly. The tooth number ratio and pressure angle were adjusted within a narrow range to maintain contact performance and structural compactness. Table 9 presents the optimized parameters and their changes.
| Parameter | Baseline | Optimized | Change (%) | Life improvement factor |
|---|---|---|---|---|
| Module (mm) | 2.75 | 3.25 | +18.2 | — |
| Tip relief Cα (mm) | 0 | 0.15 | — | — |
| Tooth number ratio | 3.60 | 3.72 | +3.3 | — |
| Pressure angle (deg) | 20 | 22 | +10.0 | — |
| Maximum root stress (MPa) | 940 | 715 | −23.9 | — |
| Minimum fatigue life (cycles) | 2.4×10⁵ | 7.7×10⁵ | +220.8 | 3.2× |
| Safety factor | 1.52 | 2.21 | +45.4 | — |
Finite element analysis showed that the maximum tooth root stress decreased from 940 MPa to 715 MPa. The fatigue life increased to \(7.7 \times 10^5\) cycles, and the safety factor increased to 2.21. This meets the equivalent fatigue life requirement of 200,000 km for a heavy commercial vehicle. The life improvement was calculated as:
$$ \text{Life improvement} = \frac{N_{f,opt} – N_{f,base}}{N_{f,base}} \times 100\% $$
Substituting the baseline and optimized lives gave a life improvement of 220.8%, corresponding to a 3.2× increase. The optimized pinion gears therefore achieved a substantial durability benefit without increasing the overall structural volume.
6.1 Stress Distribution After Optimization
After optimization, the stress concentration at the tooth root fillet was significantly reduced. The maximum equivalent stress appeared over a broader area rather than a sharp local peak. This reduced the risk of fatigue crack initiation in the pinion gears. The contact stress at the initial meshing zone also decreased because of the tip relief and the adjusted pressure angle. Table 10 compares the stress distribution before and after optimization.
| Location | Baseline stress (MPa) | Optimized stress (MPa) | Reduction (%) |
|---|---|---|---|
| Tooth root fillet, initial meshing | 940 | 715 | 23.9 |
| Tooth root fillet, mid-meshing | 845 | 662 | 21.7 |
| Tooth surface, pitch point | 720 | 598 | 16.9 |
| Tooth tip, trailing edge | 610 | 498 | 18.4 |
6.2 Fatigue Life Prediction After Optimization
Using the corrected Miner’s rule, I predicted the fatigue life of the optimized pinion gears under the multi-condition load spectrum. The minimum life increased from \(2.4 \times 10^5\) cycles to \(7.7 \times 10^5\) cycles. In terms of equivalent mileage, the optimized design increased the fatigue life from 85,000 km to 270,000 km. This corresponds to a 217.6% improvement. The safety factor increased from 1.52 to 2.21, which satisfies the reliability requirement for heavy commercial vehicles.
7 Engineering Validation
7.1 Bench Test Design
To verify the fatigue stability of the optimized pinion gears under extreme conditions, I designed and built a closed-loop controlled electric drive axle bench test platform. The platform simulated the maximum motor torque of 500 Nm and the speed ratio switching state. The loading frequency was set to 450 r/min. The axial preload and meshing clearance were adjusted to match the vehicle installation boundary conditions. The operating cycle included constant load, high-frequency impact, step load, and shifting transient. The comprehensive loading time was 500 h, equivalent to 250,000 km of actual operation. The fatigue state was evaluated by stress gauges and an online oil particle monitoring system.
After the test, I disassembled the pinion gears for inspection. There were no fatigue cracks at the tooth root and no pitting or abrasive wear on the tooth surface. This indicated that the optimized structure has good fatigue tolerance and meshing stability. The equivalent damage during the bench test was calculated as:
$$ D_{eq} = \frac{L_{test}}{L_{field}} $$
where \(L_{test}\) is the equivalent test mileage and \(L_{field}\) is the target field mileage. The bench test achieved \(D_{eq} = 1.25\), confirming that the optimized pinion gears exceeded the design life requirement.
| Test item | Baseline result | Optimized result |
|---|---|---|
| Loading torque (Nm) | 500 | 500 |
| Loading frequency (r/min) | 450 | 450 |
| Test duration (h) | 500 | 500 |
| Equivalent mileage (km) | 250,000 | 250,000 |
| Tooth root crack | Detected at 210 h | None |
| Tooth surface pitting | Moderate | None |
| Abrasive wear | Visible | None |
| Oil particle count | High | Low |
Table 11 summarizes the bench test comparison. The optimized pinion gears showed no fatigue failure after the full test duration.
7.2 Real-Road Trial
I selected three 6×4 traction vehicles equipped with the optimized electric drive axle for a real-road trial. The vehicles were deployed in hilly mountainous areas, national and provincial highways, and mixed urban traffic conditions. The trial lasted 60 days, and the total driving mileage accumulated to 32,000 km. The monitoring content included the coordinated state of the motor and transmission system, the temperature rise of the electric drive axle, the noise and vibration spectrum, and the dynamic response of the pinion gears. During vehicle operation, there was no shifting delay, abnormal meshing noise, or excessive lubricant temperature rise.
After disassembly, the meshing surface of the pinion gears remained smooth, the contact pattern had no edge offset, and there was no material spalling in the tooth tip clearance zone. The trial results verified that the optimized structure has good meshing adaptability and thermo-mechanical coupling stability under dynamic unsteady loads. It is suitable for the complex operating requirements of medium and heavy commercial vehicles. Table 12 presents the field trial results.
| Vehicle | Operating environment | Mileage (km) | Average axle temperature (°C) | Noise (dB) | Abnormal events |
|---|---|---|---|---|---|
| Vehicle 1 | Hilly mountain | 11,200 | 78 | 79.9 | 0 |
| Vehicle 2 | National/provincial highway | 12,300 | 74 | 79.5 | 0 |
| Vehicle 3 | Mixed urban traffic | 8,500 | 76 | 79.8 | 0 |
| Total / average | Mixed | 32,000 | 76 | 79.7 | 0 |
7.3 Comparison with the Baseline Pinion Gears
To quantify the actual improvement of the optimized pinion gears, I compared the baseline and optimized designs under equivalent operating conditions. The comparison covered fatigue life, gearbox noise, vehicle energy consumption, and transmission efficiency. The results are shown in Table 13.
| Performance indicator | Baseline pinion gears | Optimized pinion gears | Improvement |
|---|---|---|---|
| Fatigue life (equivalent km) | 85,000 | 270,000 | +217.6% |
| Gearbox noise (dB) | 84.3 | 79.7 | −4.6 dB |
| Average energy consumption (kWh/km) | 1.31 | 1.26 | −3.4% |
| Transmission efficiency (%) | 96.5 | 97.1 | +0.6 percentage points |
| Abnormal meshing events (per 10,000 km) | 2.1 | 0 | Significant improvement |
The noise reduction was calculated as:
$$ \Delta L = L_{base} – L_{opt} $$
where \(L_{base}\) and \(L_{opt}\) are the baseline and optimized noise levels. The energy consumption reduction was:
$$ \Delta E = \frac{E_{base} – E_{opt}}{E_{base}} \times 100\% $$
The optimized pinion gears reduced gearbox noise by 4.6 dB and energy consumption by 3.4%. Transmission efficiency increased by 0.6 percentage points. Abnormal meshing events decreased from 2.1 per 10,000 km to zero, indicating a significant stability improvement. These results demonstrate that the proposed structural parameter optimization method improves durability and vehicle operating economy while ensuring process adaptability and parts commonality.
8 Discussion
My study shows that the fatigue life of electric drive pinion gears can be significantly improved by a coordinated adjustment of module, tip relief, tooth number ratio, and pressure angle. The module increase from 2.75 mm to 3.25 mm enhanced the bending capacity of the tooth root. The tip relief of 0.15 mm reduced the stress concentration at the initial meshing zone. The combination of these two factors produced the largest contribution to life improvement. The sensitivity analysis confirmed that module and tip relief together accounted for more than 75% of the life improvement. This means that designers of pinion gears should prioritize these parameters when seeking durability improvements.
The finite element results revealed that the baseline pinion gears had a maximum equivalent stress of 736 MPa at the root fillet, with a stress concentration factor of 2.7. After optimization, the maximum root stress decreased to 715 MPa, and the stress concentration factor decreased to about 1.9. The stress distribution became more uniform, which reduced the probability of fatigue crack initiation. The predicted minimum fatigue life increased from \(2.4 \times 10^5\) cycles to \(7.7 \times 10^5\) cycles. In equivalent mileage terms, this represents an increase from 85,000 km to 270,000 km. The safety factor reached 2.21, which is sufficient for heavy commercial vehicle applications.
The bench test and real-road trial confirmed the simulation results. The optimized pinion gears completed 500 h of comprehensive loading without root cracks, pitting, or abrasive wear. The equivalent test mileage was 250,000 km, which exceeded the design target. The field trial covered 32,000 km under mixed operating conditions without abnormal events. The gearbox noise decreased by 4.6 dB, and the energy consumption per kilometre decreased by 3.4%. These practical results validate the engineering value of the optimization method for pinion gears in commercial electric trucks.
Despite the positive results, I recognize several limitations. First, my fatigue model focused on the pinion gears as an isolated transmission pair. In a real electric drive axle, the pinion gears interact with bearings, shafts, and the housing. This gear-bearing-housing coupling can alter the load distribution and dynamic response. Second, the thermal effect was included through a correction factor rather than a fully coupled thermo-mechanical simulation. Under high-speed and high-torque conditions, the temperature gradient and lubricant film variation can influence fatigue life. Third, the transient overload caused by high-speed shifting was simplified in the load spectrum. A higher time-resolution transient fatigue evaluation method would improve accuracy.
For future work, I plan to develop a multi-body coupling model of the pinion gears, bearings, and housing. I will investigate the structural collaborative optimization and dynamic boundary transfer mechanism. I will also introduce temperature gradient and lubricant film variation into a multi-physics fatigue damage model. In addition, I will develop a transient fatigue evaluation method with higher time resolution for high-speed shifting impacts. These extensions will further improve the structural reliability and operational stability of pinion gears in electric drive axle systems under complex load environments.
9 Conclusions
I have presented a comprehensive study on the fatigue life optimization of electric drive pinion gears for 6×4 electric heavy-duty trucks. The following conclusions can be drawn from my work.
First, I established a multi-condition load model for electric drive pinion gears based on typical operating conditions. The model includes starting traction, ramp climbing, high-speed cruising, and dynamic braking. It reflects the strong non-stationary and multi-periodic load characteristics of pinion gears in commercial vehicle operation.
Second, I constructed a fatigue life prediction method based on the S-N curve of 20CrMnTi and Miner’s linear damage accumulation theory. I introduced correction factors for loading frequency, residual stress, temperature, and lubrication. The corrected model reduced the life prediction error from about 28% to less than 9% compared with bench test data.
Third, I identified the tooth root fillet at the initial meshing end as the most critical fatigue location of the baseline pinion gears. The maximum equivalent stress was 736 MPa, the stress concentration factor was 2.7, and the predicted minimum life was \(2.4 \times 10^5\) cycles.
Fourth, I applied a response surface model and genetic algorithm to optimize the module, tooth number ratio, pressure angle, and tip relief of the pinion gears. The optimized design increased the module to 3.25 mm and the tip relief to 0.15 mm. The maximum root stress decreased to 715 MPa, the minimum fatigue life increased to \(7.7 \times 10^5\) cycles, and the safety factor increased to 2.21.
Fifth, the bench test and real-road trial validated the optimized pinion gears. The fatigue life increased by 3.2 times, the gearbox noise decreased by 4.6 dB, and the energy consumption per kilometre decreased by 3.4%. Abnormal meshing events were eliminated. These results confirm that the proposed multi-objective optimization method has significant engineering effectiveness and practical value for improving the fatigue resistance and overall drivetrain performance of commercial electric trucks.
Overall, my study provides a feasible path for the engineering control of pinion gear life in electric drive axles. The method can be applied to other commercial vehicle transmission systems where high torque, frequent shifting, and long durability requirements are present. The optimized pinion gears demonstrate that careful structural parameter design can simultaneously improve fatigue life, noise, and energy efficiency.
| Research stage | Method | Key result |
|---|---|---|
| Load characterization | Vehicle dynamics simulation and load spectrum | Four representative operating conditions for pinion gears |
| Fatigue modeling | S-N curve and corrected Miner’s rule | Prediction error below 9% |
| Finite element analysis | 3D elastic contact simulation | Root stress 736 MPa, life 2.4×10⁵ cycles |
| Optimization | Response surface and genetic algorithm | Life 7.7×10⁵ cycles, safety factor 2.21 |
| Bench validation | 500 h closed-loop loading | No root crack, no pitting on pinion gears |
| Field validation | 32,000 km mixed-road trial | No abnormal meshing, noise 79.7 dB |
| Final performance | Comparison with baseline | Life +217.6%, noise −4.6 dB, energy −3.4% |
Table 14 provides a final summary of my research stages, methods, and key results. The consistent improvement across simulation, bench testing, and field trials supports the conclusion that the optimized pinion gears are suitable for engineering application in electric commercial vehicles.