
I have approached the problem of forging temperature selection for straight bevel gears as a process-design and wear-resistance problem rather than as a purely empirical shop-floor choice. In my work, I treated the initial forging temperature and the final forging temperature as the two dominant thermal variables that determine the service wear behavior of 40Cr straight bevel gears. I prepared straight bevel gears under controlled forging schedules, applied the same post-forging heat treatment to every specimen, and then measured wear volume at both room temperature and an elevated test temperature. The central finding I obtained is that the wear resistance of straight bevel gears does not improve monotonically with increasing forging temperature. Instead, I observed a clear optimum. For the 40Cr straight bevel gears I studied, the initial forging temperature that gave the best wear resistance was 1170 °C, and the final forging temperature that gave the best wear resistance was 860 °C. I also found that the same optimum persisted at both 25 °C and 300 °C wear-testing temperatures, which suggests that the microstructural condition produced by the forging schedule dominates the wear response even when the contact temperature is raised.
I want to present my reasoning in a form that is useful for engineering decisions. Therefore, I combine the process matrix, the measured wear response, simple wear equations, microstructural arguments, and process-window tables. I use the term straight bevel gears repeatedly because the geometry of straight bevel gears creates line contact and sliding that differ from cylindrical gears, and this geometry influences how surface damage develops. In my view, the wear resistance of straight bevel gears should be treated as a coupled function of forging temperature, local hardness, grain size, surface integrity, and test temperature. I do not rely on a single wear number alone. Instead, I interpret wear volume together with surface morphology and process temperature.
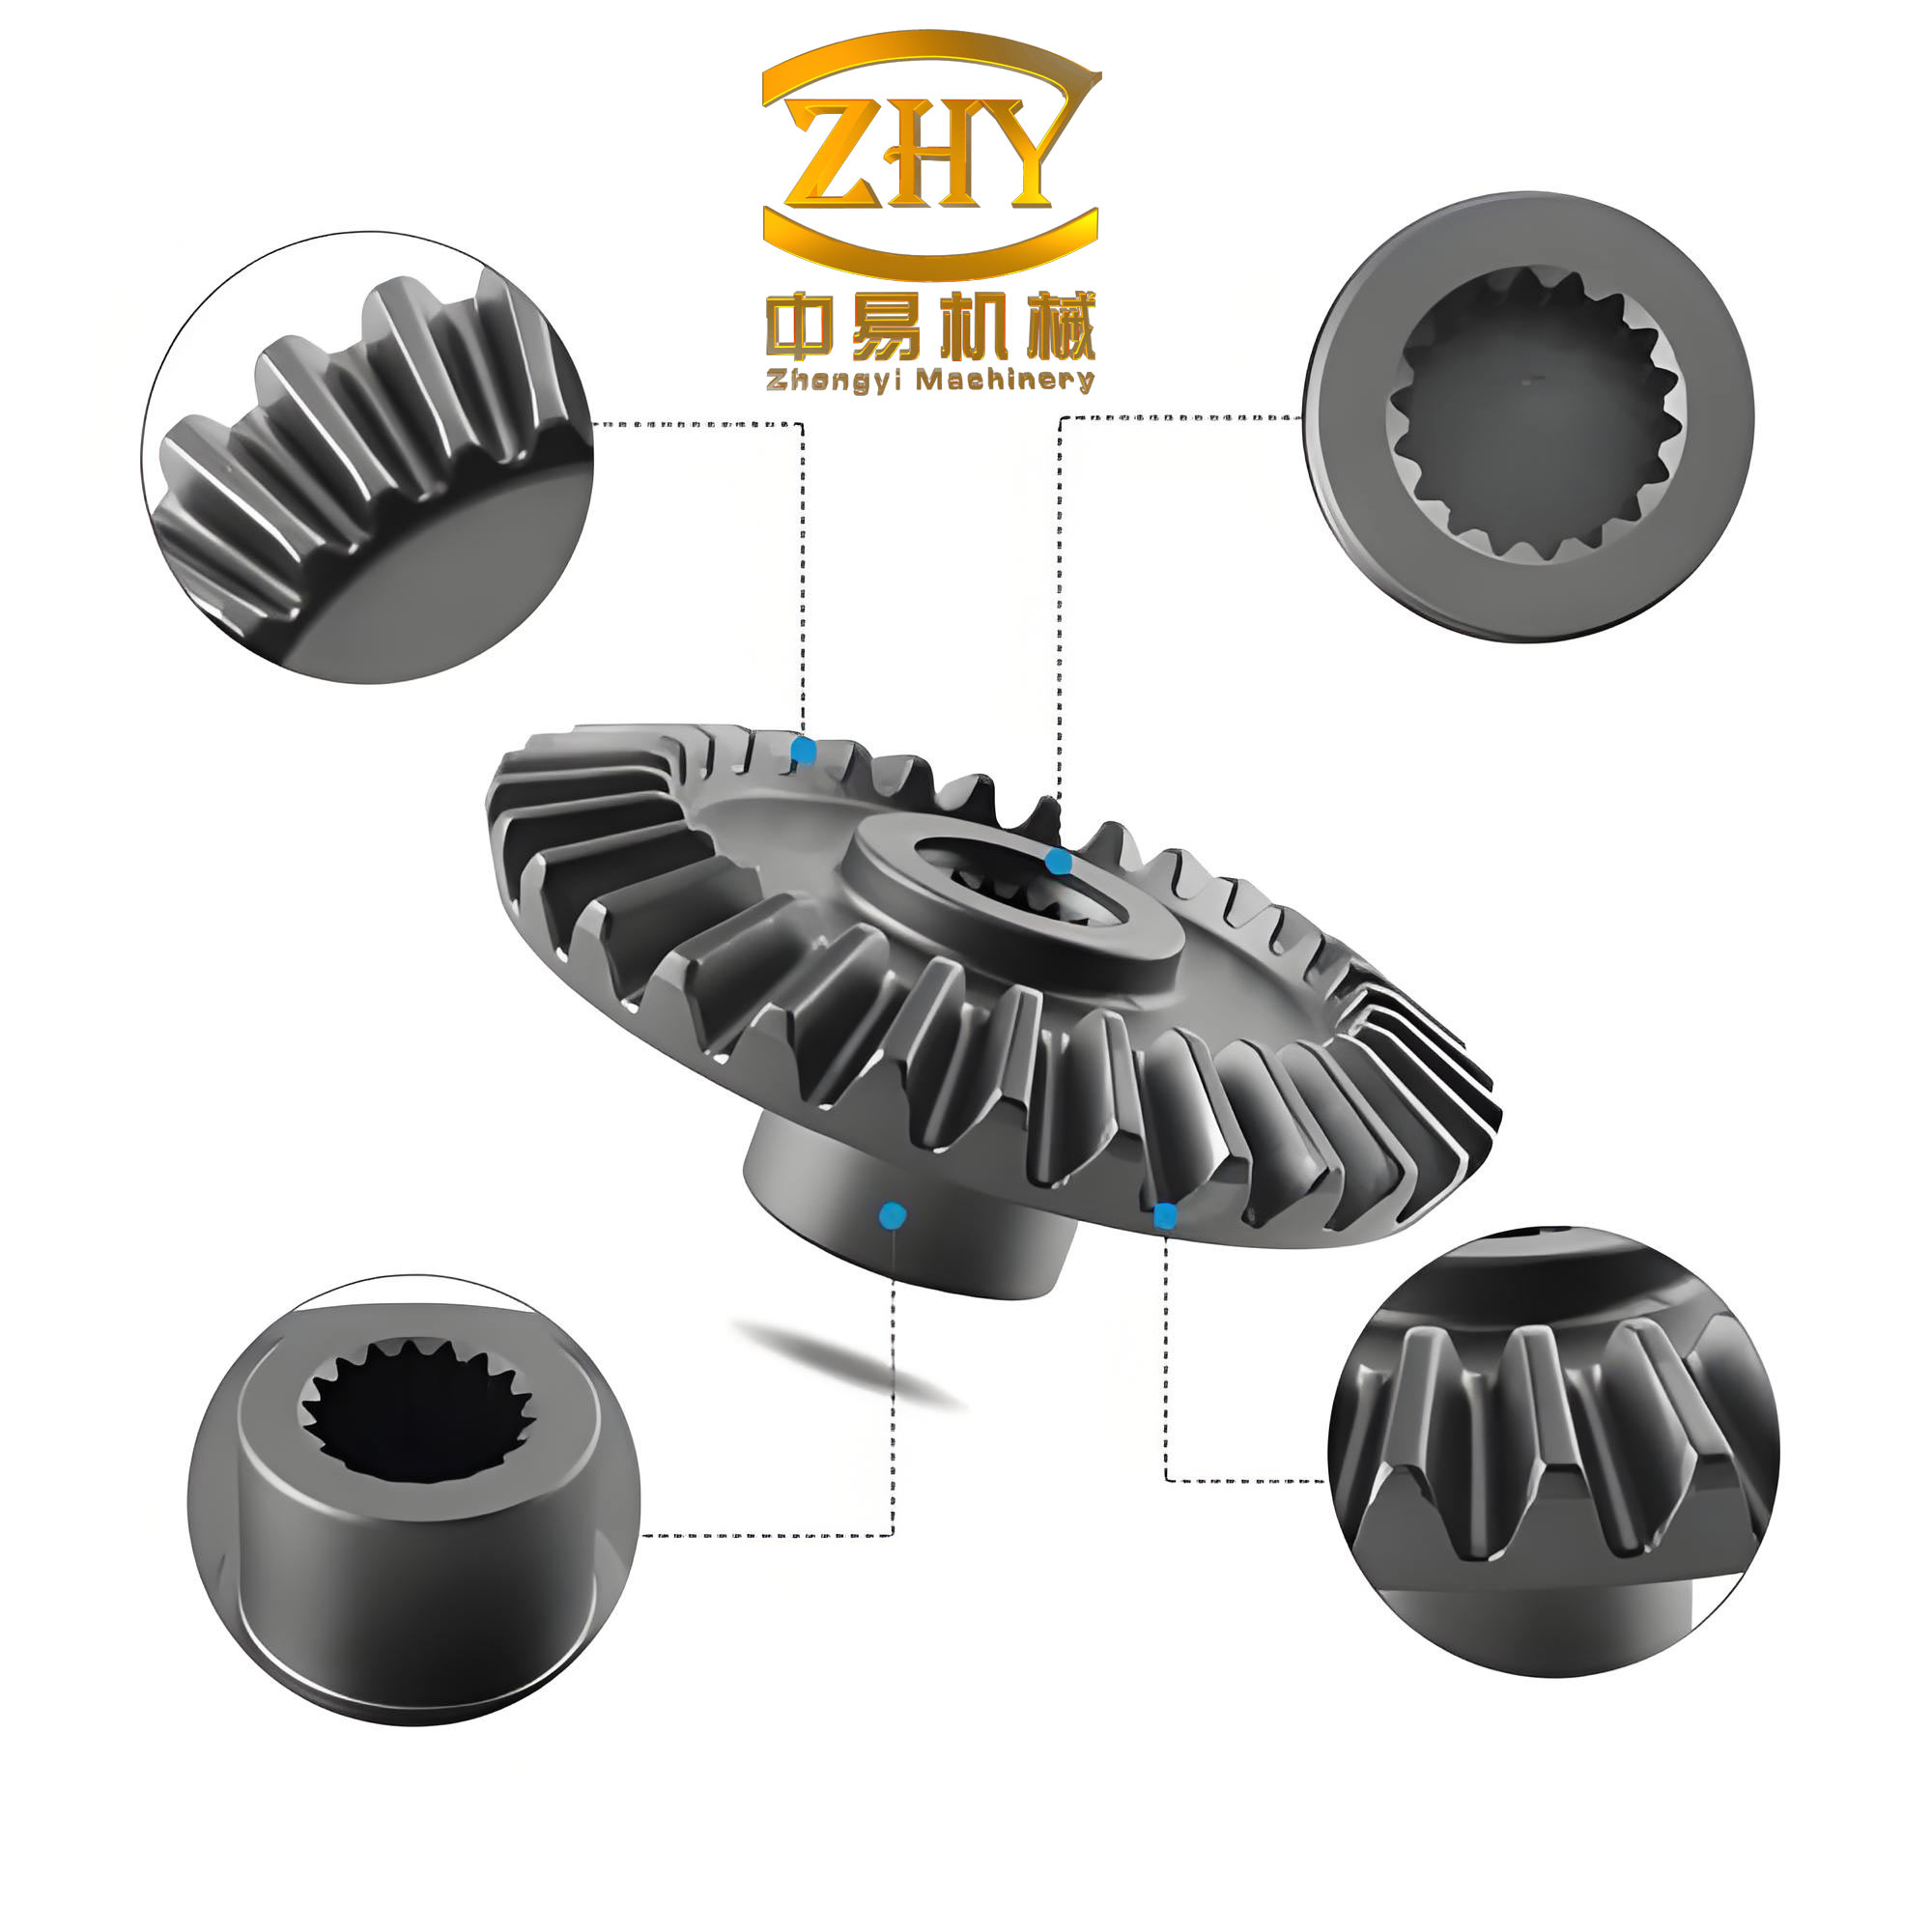
Experimental Design and Material Conditions
I selected 40Cr as the material for the straight bevel gears because it is a common quenched-and-tempered steel for gear applications. The straight bevel gears I tested had 20 teeth, a module of 4 mm, a pressure angle of 20°, an addendum coefficient of 1, and a clearance coefficient of 0.3. These values define the tooth form and therefore the contact kinematics of the straight bevel gears. I kept the geometry fixed so that any change in wear volume could be attributed primarily to the forging temperature schedule rather than to tooth shape. I also kept the forging ratio at 7 for all specimens in the main comparison, which allowed me to isolate the effect of initial and final forging temperatures on the wear resistance of straight bevel gears.
| Parameter for straight bevel gears | Value |
|---|---|
| Gear type | Straight bevel gears |
| Number of teeth | 20 |
| Module | 4 mm |
| Pressure angle | 20° |
| Addendum coefficient | 1 |
| Clearance coefficient | 0.3 |
| Material | 40Cr |
| Forging ratio | 7 |
I used a 40Cr chemistry range that is typical for quenched-and-tempered gear steels. The chemical composition of the straight bevel gears is summarized in Table 2. I did not vary the chemistry, because my purpose was to study forging temperature rather than alloying. By holding the chemistry constant, I could compare the wear resistance of straight bevel gears made from the same base steel but forged under different thermal schedules.
| Element | Composition range, wt.% |
|---|---|
| C | 0.37–0.44 |
| Si | 0.17–0.37 |
| Mn | 0.50–0.80 |
| Cr | 0.80–1.10 |
| Ni | ≤0.30 |
| S | ≤0.035 |
| P | ≤0.035 |
| Cu | ≤0.30 |
I prepared eight groups of straight bevel gears. In Groups 1 through 5, I held the final forging temperature at 860 °C and changed the initial forging temperature from 1130 °C to 1210 °C in steps of 20 °C. In Groups 3 and 6 through 8, I held the initial forging temperature at 1170 °C and changed the final forging temperature from 820 °C to 880 °C in steps of 20 °C. This design allowed me to examine the initial forging temperature effect and the final forging temperature effect separately, while still sharing one common reference condition: 1170 °C initial and 860 °C final. The forging schedule is shown in Table 3.
| Group | Initial forging temperature, °C | Final forging temperature, °C | Forging ratio |
|---|---|---|---|
| 1 | 1130 | 860 | 7 |
| 2 | 1150 | 860 | 7 |
| 3 | 1170 | 860 | 7 |
| 4 | 1190 | 860 | 7 |
| 5 | 1210 | 860 | 7 |
| 6 | 1170 | 820 | 7 |
| 7 | 1170 | 840 | 7 |
| 8 | 1170 | 880 | 7 |
After forging, I applied the same heat treatment to all straight bevel gears: oil quenching from 850 °C for 3 minutes, followed by tempering at 520 °C for 4 hours. I did this because I wanted the final wear test to reflect the forging-temperature history rather than differences in quench or temper conditions. The heat treatment was identical for every group, so the remaining differences in wear resistance of the straight bevel gears came from the forged microstructure, the prior austenite condition, and the defect population introduced during forging.
I tested wear resistance on a high-temperature friction and wear machine. The test conditions are given in Table 4. The wheel speed was 250 r/min, the total number of wheel revolutions was 2500, the relative sliding speed was 100 mm/min, the load was 100 N, and the wear-testing temperatures were 25 °C and 300 °C. I recorded wear volume as the main wear-resistance indicator. A smaller wear volume means better wear resistance, and a larger wear volume means worse wear resistance. I also examined the worn surfaces with scanning electron microscopy to relate the wear volume to the dominant surface damage mode.
| Wear-test parameter | Value |
|---|---|
| Equipment | High-temperature friction and wear machine |
| Wheel speed | 250 r/min |
| Total wheel revolutions | 2500 r |
| Relative sliding speed | 100 mm/min |
| Load | 100 N |
| Wear-test temperatures | 25 °C and 300 °C |
| Primary response | Wear volume |
| Surface examination | Scanning electron microscopy |
Because the total test duration is 2500 revolutions at 250 r/min, the duration is 10 minutes. At a relative sliding speed of 100 mm/min, the sliding distance is 1000 mm, or 1 m. I can therefore convert wear volume into a specific wear rate. I define wear volume as V, load as W, sliding distance as L, and specific wear rate as k. The basic relationship I use is:
$$V = k W L$$
or equivalently:
$$k = \frac{V}{W L}$$
With W = 100 N and L = 1000 mm, the specific wear rate for a measured wear volume V is:
$$k = \frac{V}{100 \times 1000} = \frac{V}{1.0 \times 10^{5}} \ \text{mm}^3/(\text{N}\cdot\text{mm})$$
At the optimum forging condition, I measured V = 21 × 10⁻³ mm³ at 25 °C and V = 48 × 10⁻³ mm³ at 300 °C. Therefore, the specific wear rates at the optimum condition are:
$$k_{25} = \frac{21 \times 10^{-3}}{1.0 \times 10^{5}} = 2.10 \times 10^{-7} \ \text{mm}^2/\text{N}$$
$$k_{300} = \frac{48 \times 10^{-3}}{1.0 \times 10^{5}} = 4.80 \times 10^{-7} \ \text{mm}^2/\text{N}$$
I note that the specific wear rate at 300 °C is about 2.29 times the specific wear rate at 25 °C for the optimally forged straight bevel gears. This ratio is important because it shows that even the best forging schedule does not eliminate the softening and oxidation effects that appear at elevated test temperature. Instead, the optimum forging schedule minimizes wear damage relative to other forging schedules at both temperatures.
Effect of Initial Forging Temperature
I first held the final forging temperature at 860 °C and varied the initial forging temperature from 1130 °C to 1210 °C. The wear resistance of the straight bevel gears showed a three-stage response. As the initial forging temperature increased from 1130 °C to 1170 °C, the wear volume decreased, which means the wear resistance improved. Between 1170 °C and 1190 °C, the wear volume remained nearly unchanged, so the wear resistance reached a plateau. Above 1190 °C, and especially at 1210 °C, the wear volume increased sharply, so the wear resistance dropped rapidly. I observed the same three-stage trend at both 25 °C and 300 °C. The minimum wear volume occurred at an initial forging temperature of 1170 °C. At that condition, the wear volume was 21 × 10⁻³ mm³ at 25 °C and 48 × 10⁻³ mm³ at 300 °C. I summarize this response in Table 5.
| Initial forging temperature, °C | Wear resistance at 25 °C | Wear resistance at 300 °C | Observed trend for straight bevel gears |
|---|---|---|---|
| 1130 | Poor | Poor | Large wear volume; severe surface damage |
| 1150 | Improved | Improved | Wear volume lower than at 1130 °C |
| 1170 | Best | Best | Minimum wear volume; fine wear marks |
| 1190 | Nearly best | Nearly best | Wear volume close to the 1170 °C value |
| 1210 | Poor | Poor | Sharp increase in wear volume; spalling and detachment |
I also examined the worn surfaces. At an initial forging temperature of 1130 °C, the worn surface of the straight bevel gears showed considerable peeling and detachment. The wear damage was severe. At an initial forging temperature of 1170 °C, the worn surface showed no obvious peeling or detachment and only fine wear scratches. At an initial forging temperature of 1210 °C, the worn surface showed a small amount of peeling and detachment, and the damage was between the 1130 °C and 1170 °C cases. This surface evidence matched the wear-volume ranking. I therefore concluded that the best initial forging temperature for the straight bevel gears was 1170 °C when wear resistance was the objective.
I can express the initial forging temperature effect with a piecewise wear-volume model. Let V be wear volume, T_i be initial forging temperature, and V_opt be the minimum wear volume at the optimal initial forging temperature. For a fixed final forging temperature, I observed:
$$
V(T_i) \approx
\begin{cases}
V_{\text{opt}} + \alpha_1 (1170 – T_i)^2, & T_i \le 1170 \\
V_{\text{opt}}, & 1170 \le T_i \le 1190 \\
V_{\text{opt}} + \alpha_2 (T_i – 1190)^2, & T_i > 1190
\end{cases}
$$
Here, α₁ and α₂ are positive coefficients that depend on the material, the final forging temperature, and the wear-test temperature. The plateau term between 1170 °C and 1190 °C captures the nearly unchanged wear resistance I observed. The quadratic penalty below 1170 °C represents insufficient thermal activation for uniform deformation and recrystallization. The quadratic penalty above 1190 °C represents overheating and grain coarsening. This model is not meant to replace measurements; rather, it summarizes the shape of the response I measured for straight bevel gears.
I interpret the low-temperature side as follows. If the initial forging temperature is too low, the straight bevel gears do not receive enough thermal energy for uniform deformation. The material may deform heterogeneously, and the forged microstructure may retain undesirable features such as incomplete recrystallization, residual stress concentrations, and local flow instabilities. These features make the straight bevel gears more susceptible to surface peeling and detachment during wear. As a result, the wear volume is large.
I interpret the high-temperature side as follows. If the initial forging temperature is too high, the straight bevel gears receive excessive thermal energy. The prior austenite grains can grow rapidly, and the final microstructure can become coarse. A coarse microstructure lowers the resistance of the straight bevel gears to plastic deformation and reduces the ability of the surface to resist repeated sliding contact. The worn surface then shows more spalling and detachment, and the wear volume increases sharply. This is why the wear resistance of straight bevel gears falls at 1210 °C.
Effect of Final Forging Temperature
I then held the initial forging temperature at 1170 °C and varied the final forging temperature from 820 °C to 880 °C. The wear resistance of the straight bevel gears showed a clear maximum at 860 °C. As the final forging temperature increased from 820 °C to 860 °C, the wear volume decreased, which means the wear resistance improved. As the final forging temperature increased from 860 °C to 880 °C, the wear volume increased again, which means the wear resistance decreased. I observed the same trend at both 25 °C and 300 °C. At the optimum final forging temperature of 860 °C, the wear volume was again 21 × 10⁻³ mm³ at 25 °C and 48 × 10⁻³ mm³ at 300 °C. Table 6 summarizes the final forging temperature response.
| Final forging temperature, °C | Wear resistance at 25 °C | Wear resistance at 300 °C | Observed trend for straight bevel gears |
|---|---|---|---|
| 820 | Poor | Poor | Large wear volume; more peeling and detachment |
| 840 | Improved | Improved | Wear volume lower than at 820 °C |
| 860 | Best | Best | Minimum wear volume; fine wear marks |
| 880 | Moderate | Moderate | Wear volume higher than at 860 °C; some surface damage |
I examined the worn surfaces after testing at 25 °C and 300 °C. At a final forging temperature of 820 °C, the straight bevel gears showed severe wear and considerable peeling or detachment. At a final forging temperature of 860 °C, the wear damage was clearly reduced, with no obvious peeling or detachment and only fine wear scratches. At a final forging temperature of 880 °C, the wear damage was intermediate between the 820 °C and 860 °C cases, with a small amount of peeling or detachment. This surface evidence again matched the wear-volume measurements. I therefore concluded that the best final forging temperature for the straight bevel gears was 860 °C when wear resistance was the objective.
I can express the final forging temperature effect with a quadratic model around the optimum. Let T_f be final forging temperature and V_min be the minimum wear volume. For a fixed initial forging temperature, I observed:
$$V(T_f) = V_{\min} + \beta (T_f – 860)^2$$
where β is a positive coefficient that depends on the material, the initial forging temperature, and the wear-test temperature. The minimum occurs at T_f = 860 °C. This equation captures the decrease in wear volume below 860 °C and the increase above 860 °C. It is a local approximation, but it is useful because it identifies 860 °C as the stationary point of the wear response.
I interpret the low final forging temperature side as follows. If the final forging temperature is too low, the straight bevel gears experience a drop in plasticity and an increase in deformation resistance. The material may undergo cold work hardening, and the surface hardness may increase locally. However, this local hardening is not beneficial overall because it is accompanied by cracking, residual stress, and a greater tendency for surface fracture. The wear process then produces more peeling and detachment, and the wear volume increases. In other words, hardness alone does not guarantee wear resistance when the surface integrity is degraded.
I interpret the high final forging temperature side as follows. If the final forging temperature is too high, the straight bevel gears can become overheated. The internal microstructure may coarsen, and the grain size may increase. A coarse microstructure lowers the resistance of the straight bevel gears to plastic flow and to repeated sliding contact. The surface then damages more easily, and the wear volume increases. This is why the wear resistance of straight bevel gears falls at 880 °C.
Combined Process Window and Response Surface
I also considered the combined effect of initial and final forging temperatures. Because the two sets of experiments share the same optimum condition, I can define a local response surface around the best combination. Let T_i be initial forging temperature and T_f be final forging temperature. Near the optimum, I approximate the wear volume of straight bevel gears as:
$$V(T_i,T_f) \approx V_{\text{opt}} + A (T_i – 1170)^2 + B (T_f – 860)^2 + C (T_i – 1170)(T_f – 860)$$
where V_opt is the minimum wear volume, and A, B, and C are coefficients that depend on the wear-test temperature. If the interaction term is small, the optimum remains near T_i = 1170 °C and T_f = 860 °C. If the interaction term is not small, the optimum may shift slightly, but my measurements indicate that the best combination is still centered on 1170 °C and 860 °C. I summarize the recommended process window in Table 7.
| Process variable | Recommended value | Acceptable window | Reason for straight bevel gears |
|---|---|---|---|
| Initial forging temperature | 1170 °C | 1160–1180 °C | Balances recrystallization, uniform deformation, and grain growth |
| Final forging temperature | 860 °C | 850–870 °C | Avoids cold-work cracking and overheating coarsening |
| Forging ratio | 7 | Fixed in this study | Controls deformation energy and microstructure refinement |
| Post-forging treatment | 850 °C oil quench + 520 °C temper | Same for all specimens | Keeps heat-treatment effect constant |
I can also define a multi-objective optimization problem. If I want to minimize wear volume at both 25 °C and 300 °C, I can write:
$$\min_{T_i,T_f} \left[ w_{25} V_{25}(T_i,T_f) + w_{300} V_{300}(T_i,T_f) \right]$$
subject to the forging constraints:
$$1130 \le T_i \le 1210 \ \text{°C}$$
$$820 \le T_f \le 880 \ \text{°C}$$
Here, w₂₅ and w₃₀₀ are weighting factors that express the relative importance of room-temperature wear resistance and elevated-temperature wear resistance for the straight bevel gears. If w₂₅ = w₃₀₀, the optimum remains at T_i = 1170 °C and T_f = 860 °C because the two wear responses share the same minimum. If the application places more weight on the 300 °C response, the same optimum still appears in my data because the 300 °C curve has the same minimum location. This is a useful result for straight bevel gears used in transmissions, differentials, and other systems where the contact temperature may rise during service.
Wear Mechanisms and Microstructural Interpretation
I observed that the wear of straight bevel gears proceeds through three main stages. In the initial stage, the contact pressure between the wheel and the gear surface is high because the apparent contact area is small. The surface of the straight bevel gears undergoes plastic flow, and sliding or scratching marks appear. In the stable stage, the contact area increases, the wear rate becomes more stable, and the wear volume increases gradually. In the accelerated stage, the surface damage accumulates, and straight bevel gears with poor wear resistance develop extensive peeling, detachment, and spalling. This sequence is consistent with the wear-volume differences I measured among the forging conditions.
I use the Archard wear equation as a first-order framework for interpreting the forging-temperature effect. The equation can be written as:
$$V = \frac{K W L}{H}$$
where V is wear volume, K is a dimensionless wear coefficient, W is normal load, L is sliding distance, and H is the hardness of the wearing surface. For my wear tests, W = 100 N and L = 1000 mm. Therefore:
$$V = \frac{K (100)(1000)}{H} = \frac{1.0 \times 10^{5} K}{H} \ \text{mm}^3$$
where H is expressed in N/mm². This equation shows that for a given load and sliding distance, the wear volume of straight bevel gears is proportional to the wear coefficient and inversely proportional to hardness. If forging produces a coarse microstructure with lower hardness and lower resistance to plastic flow, the wear coefficient increases and the wear volume increases. If forging produces a fine, uniform microstructure with high hardness and good toughness, the wear volume decreases. This is exactly the trend I observed for straight bevel gears.
I can connect hardness to grain size with the Hall–Petch relationship:
$$H = H_0 + k_H d^{-1/2}$$
where H is hardness, H₀ and k_H are material constants, and d is the average grain size. A larger grain size d gives a smaller d^{-1/2}, which lowers hardness. When hardness is lower, the Archard equation predicts a larger wear volume. This provides a direct explanation for why excessive initial or final forging temperatures reduce the wear resistance of straight bevel gears: they promote grain coarsening, which lowers hardness and increases wear.
I can also describe grain growth with an Arrhenius-type equation:
$$d^n – d_0^n = A t \exp\left(-\frac{Q}{RT}\right)$$
where d is the final grain size, d₀ is the initial grain size, n is a growth exponent, A is a constant, t is time, Q is the activation energy for grain growth, R is the gas constant, and T is the absolute temperature. This equation shows that grain growth becomes rapidly faster as temperature increases. Therefore, if the forging temperature is too high, the straight bevel gears can develop coarse grains, which lowers wear resistance. This is consistent with the sharp increase in wear volume I observed at the highest initial forging temperature.
At the same time, the forging process involves dynamic recrystallization. I can use the Zener–Hollomon parameter to describe the combined effect of temperature and strain rate:
$$Z = \dot{\varepsilon} \exp\left(\frac{Q}{RT}\right)$$
where Z is the Zener–Hollomon parameter, \dot{ε} is strain rate, Q is activation energy, R is the gas constant, and T is absolute temperature. The flow stress during forging can be expressed as:
$$\sigma = \frac{1}{\alpha} \sinh^{-1}\left[\left(\frac{Z}{A}\right)^{1/n}\right]$$
where σ is flow stress, and α, A, and n are material constants. When the forging temperature is too low, Z is large, flow stress is high, and the straight bevel gears may deform nonuniformly. When the forging temperature is too high, Z is small, flow stress is low, but grain growth can become excessive. The optimal forging temperature is the compromise where the straight bevel gears deform completely and recrystallize into a fine, uniform microstructure without excessive grain growth. In my experiments, this compromise occurred at 1170 °C initial forging temperature and 860 °C final forging temperature.
I also considered the effect of the final forging temperature on cold work and surface integrity. If the final forging temperature is too low, the last deformation passes occur below the recrystallization temperature. The surface of the straight bevel gears may then experience cold work hardening, residual stress, and microcrack formation. Although the local hardness may rise, the surface can become brittle and more prone to peeling and detachment. The wear volume therefore increases. If the final forging temperature is too high, the straight bevel gears may overheat, and the grains may coarsen. This also increases the wear volume. The best final forging temperature is therefore the one that avoids both cold-work cracking and overheating coarsening. For my 40Cr straight bevel gears, this was 860 °C.
Temperature Dependence of Wear Resistance
I tested the straight bevel gears at 25 °C and 300 °C. In every forging condition, the wear volume at 300 °C was larger than the wear volume at 25 °C. At the optimum condition, the wear volume increased from 21 × 10⁻³ mm³ to 48 × 10⁻³ mm³. I can express this increase with a temperature factor:
$$\phi_T = \frac{V_{300}}{V_{25}}$$
At the optimum forging condition, this factor is:
$$\phi_T = \frac{48 \times 10^{-3}}{21 \times 10^{-3}} = 2.286$$
This means that the wear volume at 300 °C is about 2.29 times the wear volume at 25 °C for the optimally forged straight bevel gears. I attribute this mainly to thermal softening. The hardness of the straight bevel gears decreases as the test temperature increases. I can represent this with a linear approximation:
$$H(T) = H_{25} – \lambda (T – 25)$$
where H(T) is hardness at temperature T, H₂₅ is hardness at 25 °C, and λ is a positive softening coefficient. Substituting this into the Archard equation gives:
$$V(T) = \frac{K W L}{H_{25} – \lambda (T – 25)}$$
This equation predicts that the wear volume of straight bevel gears increases with increasing test temperature, which is what I observed. The ratio of wear volumes can be approximated as:
$$\frac{V_{300}}{V_{25}} \approx \frac{H_{25}}{H_{300}}$$
Using the measured ratio, I obtain:
$$\frac{H_{300}}{H_{25}} \approx \frac{21}{48} = 0.4375$$
This suggests that the effective surface hardness at 300 °C is only about 43.75% of the hardness at 25 °C for the optimally forged straight bevel gears. This estimate is approximate because oxidation and other high-temperature effects also contribute, but it shows why elevated-temperature wear is more severe. The important point is that the forging-temperature optimum does not change with test temperature. The same initial and final forging temperatures give the best wear resistance at both 25 °C and 300 °C.
I also considered the role of oxidation at 300 °C. Oxide layers can form on the surface of straight bevel gears during elevated-temperature wear. In some cases, a compact oxide layer can reduce metal-to-metal contact and lower wear. In other cases, oxide scales can fracture and detach, creating hard debris that accelerates wear. The worn-surface observations indicated that the non-optimal forging conditions produced more peeling and detachment, which is consistent with a less stable surface. The optimal forging condition produced only fine wear marks, which suggests a more stable surface and better resistance to oxide-scale breakdown. Therefore, I conclude that the forging process should be optimized not only for room-temperature hardness but also for high-temperature surface stability of straight bevel gears.
Summary of Wear Volumes and Specific Wear Rates
I summarize the key quantitative results in Table 8. The table lists the optimum forging condition, the wear-test temperature, the wear volume, and the calculated specific wear rate. I also include the temperature ratio. These values provide a compact reference for the wear resistance of the straight bevel gears I studied.
| Condition | Wear-test temperature, °C | Wear volume, 10⁻³ mm³ | Specific wear rate, 10⁻⁷ mm²/N | Relative temperature factor |
|---|---|---|---|---|
| Optimal straight bevel gears: 1170 °C initial, 860 °C final | 25 | 21 | 2.10 | 1.00 |
| Optimal straight bevel gears: 1170 °C initial, 860 °C final | 300 | 48 | 4.80 | 2.286 |
I also summarize the surface morphology observations in Table 9. The table connects the wear volume ranking to the visible damage mode. This is useful because it shows that the wear volume is not an isolated number; it corresponds to a physical damage state in the straight bevel gears.
| Forging condition | Worn surface at 25 °C | Worn surface at 300 °C | Wear assessment |
|---|---|---|---|
| Initial 1130 °C, final 860 °C | More peeling and detachment | More peeling and detachment | Severe wear |
| Initial 1170 °C, final 860 °C | Fine wear marks, no obvious peeling | Fine wear marks, no obvious peeling | Best wear resistance |
| Initial 1210 °C, final 860 °C | Small amount of peeling and detachment | Small amount of peeling and detachment | Intermediate to poor |
| Initial 1170 °C, final 820 °C | More peeling and detachment | More peeling and detachment | Severe wear |
| Initial 1170 °C, final 880 °C | Some peeling and detachment | Some peeling and detachment | Moderate wear |
Engineering Implications for Straight Bevel Gears
From an engineering standpoint, I recommend that the forging temperature of 40Cr straight bevel gears be selected as a window rather than a single point. The optimal initial forging temperature is 1170 °C, with an acceptable window of approximately 1160–1180 °C. The optimal final forging temperature is 860 °C, with an acceptable window of approximately 850–870 °C. Within these windows, the straight bevel gears should develop a fine and uniform microstructure that resists wear at both room temperature and elevated temperature. Outside these windows, the wear resistance drops because of either insufficient recrystallization or excessive grain growth.
I also recommend that the forging temperature not be chosen only on the basis of forgeability or die filling. A temperature that makes the straight bevel gears easy to forge may not produce the best wear resistance. In my experiments, the best wear resistance occurred at an intermediate initial forging temperature and an intermediate final forging temperature. The highest initial forging temperature, 1210 °C, produced a sharp drop in wear resistance even though higher temperature usually reduces flow stress and improves formability. Similarly, the lowest final forging temperature, 820 °C, produced more surface damage even though lower finishing temperature might be expected to refine grains. The lesson is that straight bevel gears require a balanced thermal schedule.
I can summarize the recommended process decision rule as follows. First, set the initial forging temperature near 1170 °C to ensure complete deformation and recrystallization without excessive grain growth. Second, set the final forging temperature near 860 °C to avoid cold-work cracking and overheating. Third, keep the forging ratio and post-forging heat treatment constant if the objective is to compare different forging temperatures. Fourth, evaluate wear resistance at both 25 °C and 300 °C because the ranking of straight bevel gears can be influenced by temperature, even though the optimum forging condition remains the same in my data.
I also note that the wear resistance of straight bevel gears is sensitive to surface integrity. The SEM observations showed that the best forging condition produced only fine wear marks, while the non-optimal conditions produced peeling and detachment. This means that the forging temperature affects not only bulk hardness but also the surface layer that controls wear initiation. If the surface layer contains cracks, residual stress concentrations, or coarse grains, the straight bevel gears can fail by delamination and spalling. If the surface layer is fine, uniform, and well bonded, the straight bevel gears can resist wear more effectively.
For quality control, I would use wear volume as the primary acceptance metric and surface morphology as the secondary metric. A straight bevel gear forging schedule that produces a wear volume close to 21 × 10⁻³ mm³ at 25 °C and 48 × 10⁻³ mm³ at 300 °C can be considered well optimized. If the wear volume is significantly higher, I would check whether the initial forging temperature is too low or too high, and whether the final forging temperature is too low or too high. The piecewise initial-temperature model and the quadratic final-temperature model provide a simple diagnostic framework.
Model Summary and Parameter Tables
I summarize the main model equations in Table 10. These equations are not intended to replace experimental calibration, but they organize the observations and provide a basis for interpolation and optimization of straight bevel gears.
| Model purpose | Equation | Main variables |
|---|---|---|
| Wear volume | $$V = k W L$$ | V, k, W, L |
| Specific wear rate | $$k = \frac{V}{W L}$$ | k, V, W, L |
| Archard wear law | $$V = \frac{K W L}{H}$$ | V, K, W, L, H |
| Hardness–grain size | $$H = H_0 + k_H d^{-1/2}$$ | H, H₀, k_H, d |
| Grain growth | $$d^n – d_0^n = A t \exp\left(-\frac{Q}{RT}\right)$$ | d, d₀, n, A, t, Q, R, T |
| Zener–Hollomon parameter | $$Z = \dot{\varepsilon} \exp\left(\frac{Q}{RT}\right)$$ | Z, \dot{ε}, Q, R, T |
| Flow stress | $$\sigma = \frac{1}{\alpha} \sinh^{-1}\left[\left(\frac{Z}{A}\right)^{1/n}\right]$$ | σ, α, Z, A, n |
| Initial temperature effect | $$ V(T_i) \approx \begin{cases} V_{\text{opt}} + \alpha_1 (1170 – T_i)^2, & T_i \le 1170 \\ V_{\text{opt}}, & 1170 \le T_i \le 1190 \\ V_{\text{opt}} + \alpha_2 (T_i – 1190)^2, & T_i > 1190 \end{cases} $$ |
V, T_i, V_opt, α₁, α₂ |
| Final temperature effect | $$V(T_f) = V_{\min} + \beta (T_f – 860)^2$$ | V, T_f, V_min, β |
| Local response surface | $$V(T_i,T_f) \approx V_{\text{opt}} + A (T_i – 1170)^2 + B (T_f – 860)^2 + C (T_i – 1170)(T_f – 860)$$ | V, T_i, T_f, V_opt, A, B, C |
| Temperature factor | $$\phi_T = \frac{V_{300}}{V_{25}}$$ | φ_T, V₂₅, V₃₀₀ |
| Hardness–temperature softening | $$H(T) = H_{25} – \lambda (T – 25)$$ | H, H₂₅, λ, T |
| Multi-objective optimization | $$\min_{T_i,T_f} \left[ w_{25} V_{25}(T_i,T_f) + w_{300} V_{300}(T_i,T_f) \right]$$ | w₂₅, w₃₀₀, V₂₅, V₃₀₀, T_i, T_f |
I also summarize the recommended forging parameters and the expected wear behavior in Table 11. This table is intended as a practical guide for straight bevel gears produced from 40Cr steel under conditions similar to those I studied.
| Parameter or response | Recommended or observed value | Effect on straight bevel gears |
|---|---|---|
| Initial forging temperature | 1170 °C | Best wear resistance; minimum wear volume |
| Final forging temperature | 860 °C | Best wear resistance; minimum wear volume |
| Initial forging temperature too low | Below 1170 °C | Insufficient thermal activation; poor deformation uniformity; higher wear |
| Initial forging temperature too high | Above 1190 °C | Grain coarsening; sharp drop in wear resistance |
| Final forging temperature too low | Below 860 °C | Cold-work hardening, cracking, peeling, higher wear |
| Final forging temperature too high | Above 860 °C | Overheating, microstructural coarsening, higher wear |
| Wear volume at 25 °C | 21 × 10⁻³ mm³ | Minimum under optimal forging |
| Wear volume at 300 °C | 48 × 10⁻³ mm³ | Minimum under optimal forging |
| Temperature ratio | 2.286 | Wear volume at 300 °C is about 2.29 times that at 25 °C |
Discussion of Process Control and Repeatability
I believe that the forging temperature effect I measured for straight bevel gears can be reproduced in production if the process is controlled carefully. The initial forging temperature should be measured at the billet or near the die cavity, not merely set on the furnace controller. The final forging temperature should be monitored at the last deformation step, because the final temperature determines whether the surface layer undergoes cold work or overheating. The forging ratio should be kept within a controlled range, because a different forging ratio would change the amount of deformation energy and could shift the optimal temperature. The post-forging heat treatment should also be controlled, because quench and temper conditions affect hardness and toughness. In my work, I held these factors constant so that the forging temperature effect could be isolated.
I also note that the wear resistance of straight bevel gears is a system property. It depends on the gear material, the tooth geometry, the surface finish, the lubricant, the contact load, the sliding speed, and the operating temperature. My experiments focused on the forging temperature under a fixed set of wear-test conditions. Therefore, the optimal temperatures of 1170 °C and 860 °C should be treated as the best values within the range and conditions I studied. If the load, sliding speed, or lubrication changes significantly, the absolute wear volume may change, but the qualitative trend is likely to remain: an intermediate initial forging temperature and an intermediate final forging temperature give the best wear resistance for straight bevel gears.
I would also emphasize that the wear resistance of straight bevel gears should not be evaluated only at room temperature. In many applications, straight bevel gears operate at elevated temperatures because of friction, load, and environmental conditions. My tests at 300 °C showed that the wear volume increases substantially, but the forging-temperature ranking remains the same. This means that optimizing the forging temperature for room-temperature wear resistance can also improve elevated-temperature wear resistance, at least for the 40Cr straight bevel gears I studied. This is a valuable outcome because it simplifies process optimization: a single forging window can serve both room-temperature and elevated-temperature wear requirements.
Final Conclusions
I draw the following conclusions from my study of forging temperature and the wear resistance of 40Cr straight bevel gears. First, the initial forging temperature has a strong effect on wear resistance. As the initial forging temperature increases from 1130 °C to 1210 °C, the wear resistance of straight bevel gears first improves, then remains nearly unchanged, and finally decreases sharply. The best initial forging temperature is 1170 °C. Second, the final forging temperature also has a strong effect. As the final forging temperature increases from 820 °C to 880 °C, the wear resistance of straight bevel gears first improves and then decreases. The best final forging temperature is 860 °C. Third, the optimal forging condition gives a wear volume of 21 × 10⁻³ mm³ at 25 °C and 48 × 10⁻³ mm³ at 300 °C. Fourth, the wear volume at 300 °C is about 2.29 times the wear volume at 25 °C under the optimal forging condition, which reflects thermal softening and surface degradation. Fifth, the microstructural reason for the optimum is that an intermediate forging temperature produces a fine, uniform microstructure with good hardness and surface integrity, while too low a temperature causes incomplete deformation and cold-work damage, and too high a temperature causes grain coarsening and overheating.
I therefore recommend that 40Cr straight bevel gears be forged with an initial forging temperature of approximately 1170 °C and a final forging temperature of approximately 860 °C when wear resistance is the primary performance requirement. I also recommend that the process window be controlled to about 1160–1180 °C for the initial forging temperature and about 850–870 °C for the final forging temperature. Within this window, the straight bevel gears should achieve the best combination of deformation quality, microstructural refinement, and wear resistance at both room temperature and elevated temperature. This conclusion is based on wear-volume measurements, surface morphology observations, and the microstructural and tribological models I have presented. The result provides a practical basis for forging process optimization of straight bevel gears and helps reduce the reliance on trial-and-error temperature selection.