
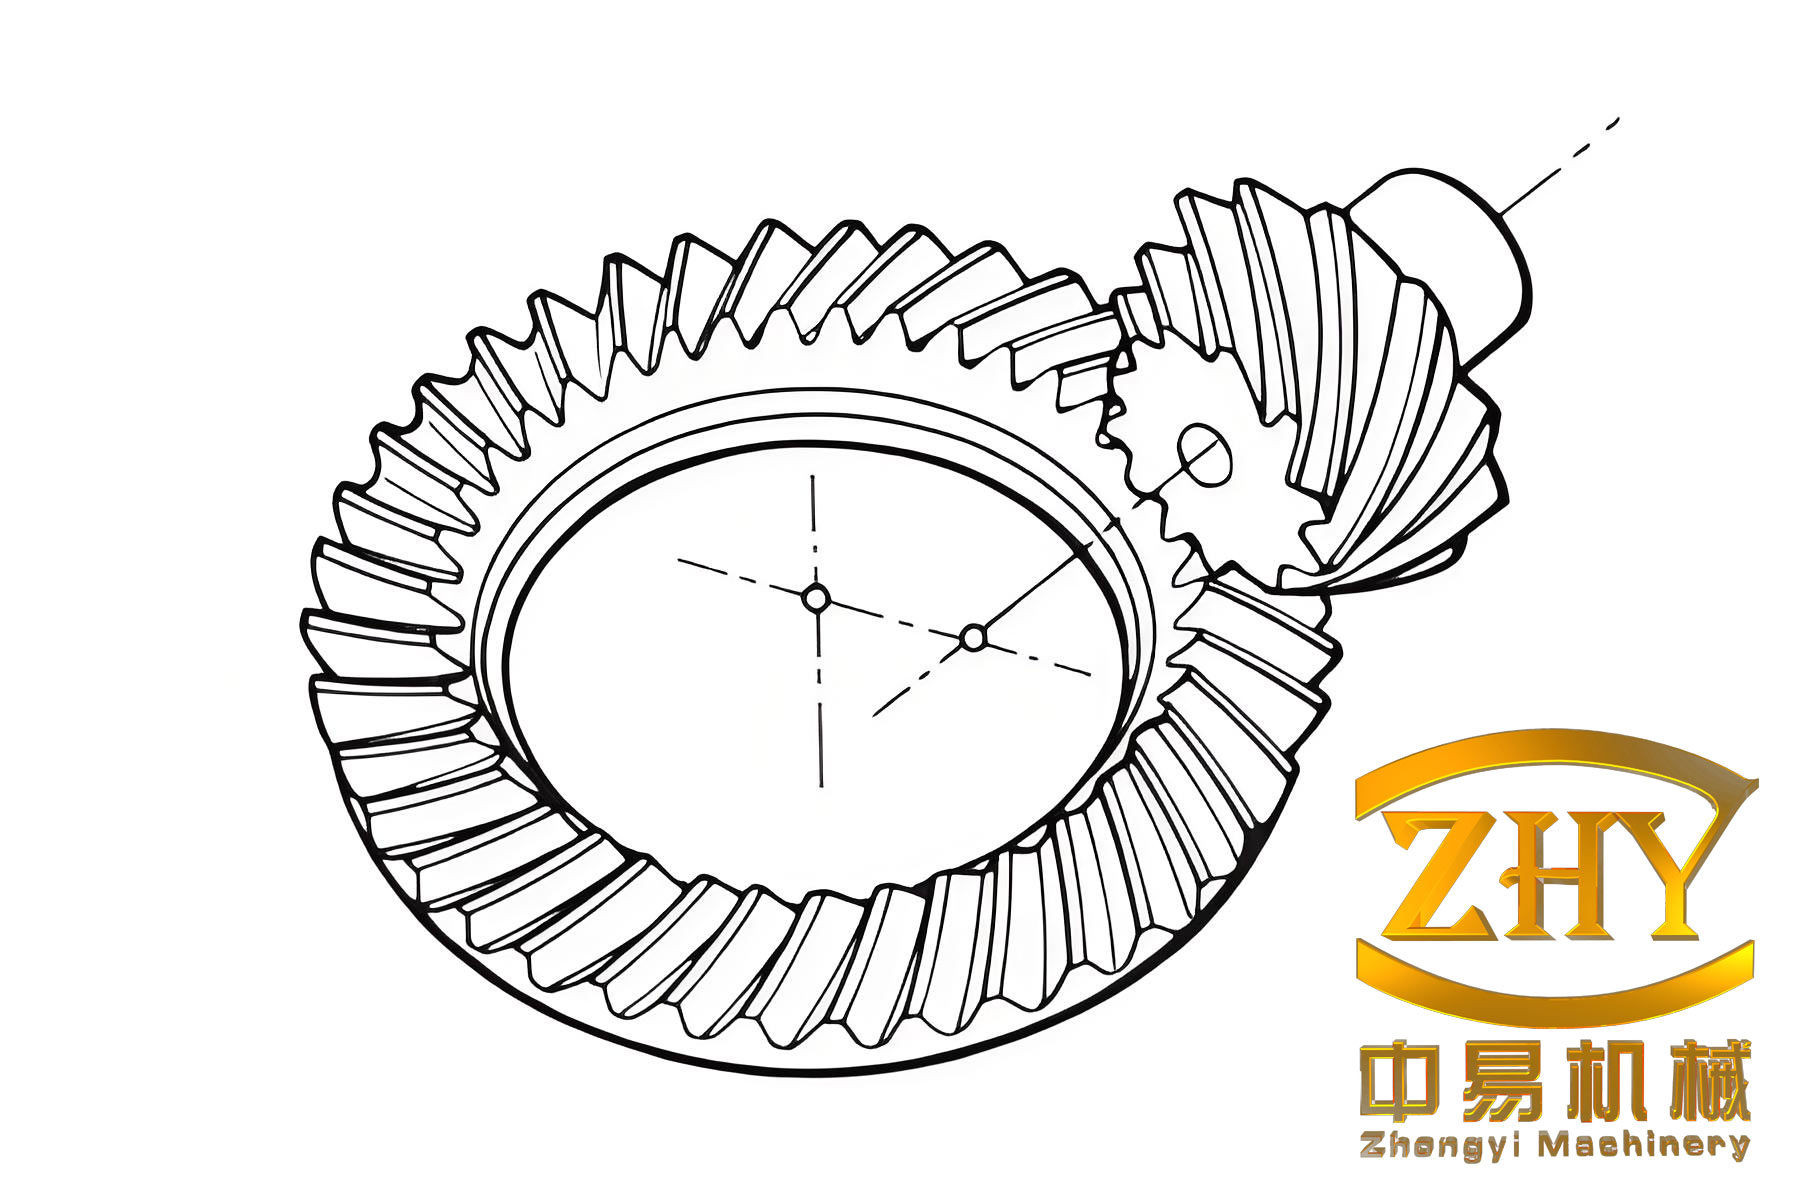
In my research, I focused on the lapping process of hypoid bevel gears used in the rear axle main reducer of a microcar. The hypoid bevel gear is one of the most important transmission components in the automotive driveline. It reduces speed, increases torque, and changes the direction of motion. Compared with other spiral bevel gears, the constant-depth hypoid bevel gear offers better NVH behavior, higher machining efficiency, and stronger load capacity. However, the lapping process, as the final manufacturing step of the hypoid bevel gear, directly determines the contact pattern consistency, tooth surface roughness, and transmission error. These three factors strongly influence the gear meshing noise and the overall NVH performance of the vehicle. I observed that unstable lapping quality caused high rear axle noise, poor contact pattern consistency, and a high rejection rate. Therefore, I systematically studied the lapping mechanism, lapping liquid matching, equipment parameter optimization, and quality control management for hypoid bevel gears.
1. Quality Status and NVH Influence of Hypoid Bevel Gear Lapping
I first investigated the production line of hypoid bevel gear lapping. The precision grade required for the hypoid bevel gear was level 7. The lapping quality standards that I used are summarized in Table 1. The contact pattern was inspected visually against a master board. The tooth surface roughness was measured with a profilometer. The transmission error was measured by a single-flank testing system. The meshing noise was evaluated by vehicle road tests.
| Lapping inspection item | Required range |
|---|---|
| Precision grade | Level 7 |
| Matched contact pattern | Along tooth length: 50%–70%; along tooth height: 55%–75% |
| Tooth surface roughness | $$R_a \leq 1\,\mu m;\quad R_{sk} \leq -0.4$$ |
| Transmission error | Drive side $$\leq 30\,\mu rad$$; coast side $$\leq 25\,\mu rad$$ |
| Meshing noise | $$\leq 65\,dB$$ |
From the production line, I found that the contact patterns after lapping varied significantly among hypoid bevel gear sets. Some contact patterns were located near the toe, some were near the heel, and others were too long or too short. This poor consistency made the meshing noise unstable. The tooth surface roughness Ra after lapping fluctuated between approximately $$0.75\,\mu m$$ and $$1.5\,\mu m$$, which was much wider than the desired range. The drive-side transmission error often exceeded the required limit of $$30\,\mu rad$$. The coast-side transmission error was generally acceptable, but the drive side remained a weak point. These observations indicated that the existing lapping process for the hypoid bevel gear was not sufficiently controlled.
To quantify the influence of lapping quality on vehicle NVH, I selected hypoid bevel gear sets with different contact patterns, roughness values, and transmission errors. I installed each set into the same rear axle assembly and conducted road tests under five-speed acceleration, five-speed coasting, and five-speed uniform deceleration. The test system consisted of a multichannel data acquisition front end, microphones, a rotational speed sensor, and NVH analysis software. The microphone was placed at the rear seat position. The meshing order of the hypoid bevel gear was tracked at 12.52 orders under the five-speed condition. The acceptance criterion was that the meshing-order noise should not exceed $$65\,dB$$ in any tested condition.
1.1 Effect of Contact Pattern on NVH
I compared two hypoid bevel gear sets whose contact patterns were substantially different while their roughness and transmission error remained within similar ranges. The first set had a contact pattern slightly toward the toe on both the convex and concave flanks. The second set had a contact pattern shifted toward the heel, especially on the concave flank. The NVH test results are summarized in Table 2. The first set showed lower meshing noise in all three operating conditions. The second set produced a strong peak near $$3100\,r/min$$ during acceleration and a very high peak during uniform deceleration. The heel-shifted contact pattern likely caused edge contact under load, which increased excitation and noise. Therefore, contact pattern position and size are critical for the hypoid bevel gear.
| Gear set | Five-speed acceleration peak / dB | Five-speed coasting peak / dB | Five-speed uniform deceleration peak / dB |
|---|---|---|---|
| Set with toe-centered contact | 59.36 | 57.12 | 62.53 |
| Set with heel-shifted contact | 65.67 | 61.29 | 73.23 |
1.2 Effect of Tooth Surface Roughness on NVH
I also compared two hypoid bevel gear sets with similar contact patterns and transmission errors but different tooth surface roughness. The roughness parameters Ra and Rsk were measured before and after lapping. The second set had a much lower Rsk after lapping, which indicated that more asperities had been removed. The vehicle NVH results are shown in Table 3. The smoother hypoid bevel gear set produced lower noise in every condition. In particular, the uniform deceleration noise was reduced by about $$11\,dB$$. This result confirmed that Rsk is more sensitive than Ra when evaluating the lapping quality of the hypoid bevel gear. A negative Rsk value indicates that the surface is dominated by valleys rather than peaks, which improves oil film formation and reduces meshing noise.
| Gear set | Roughness after lapping | Five-speed acceleration peak / dB | Five-speed coasting peak / dB | Five-speed uniform deceleration peak / dB |
|---|---|---|---|---|
| Set A | $$R_a = 1.0256\,\mu m,\; R_{sk} = -0.4112$$ | 68.67 | 68.43 | 68.48 |
| Set B | $$R_a = 0.94\,\mu m,\; R_{sk} = -0.8018$$ | 64.45 | 62.46 | 57.96 |
1.3 Effect of Transmission Error on NVH
Transmission error is another key characteristic of the hypoid bevel gear. It represents the difference between the actual angular position of the driven gear and the theoretical position. I used single-flank testing to measure the first-order transmission error. Two hypoid bevel gear sets with different transmission errors but similar contact patterns and roughness were selected. The results are given in Table 4. The set with lower transmission error produced lower noise in all conditions. The set with higher transmission error exceeded the $$65\,dB$$ limit during acceleration. Therefore, reducing the transmission error of the hypoid bevel gear is essential for NVH improvement.
| Gear set | Drive-side TE / $$\mu rad$$ | Coast-side TE / $$\mu rad$$ | Five-speed acceleration peak / dB | Five-speed coasting peak / dB | Five-speed uniform deceleration peak / dB |
|---|---|---|---|---|---|
| Set with high TE | 61.49 | 23.20 | 66.07 | 64.07 | 64.32 |
| Set with low TE | 26.18 | 8.93 | 62.29 | 60.59 | 62.42 |
2. Lapping Mechanism and Motion Model of Hypoid Bevel Gear
To optimize the lapping process of the hypoid bevel gear, I established a cutting model and a V/H motion control model. The lapping process removes a very small amount of metal from the tooth surface. A lapping liquid containing abrasive particles is injected into the meshing zone. A braking torque is applied to the driven gear. The meshing force presses the abrasive particles against the tooth surface, generating micro-cutting. The motion of the hypoid bevel gear pair is controlled by the V/H adjustment method. By changing the vertical offset V and the horizontal position H, the contact pattern can be moved along the tooth surface. The axial position J is used to control the meshing backlash.
2.1 Cutting Model
The normal force on the tooth surface can be resolved into three perpendicular components. For the hypoid bevel gear, the tangential force is related to the braking torque as follows:
$$F_t = \frac{2000 T}{d_m}$$
The radial and axial components can be written as:
$$F_r = \frac{F_t}{\cos\beta_m}\left(\tan\alpha_n\cos\delta + \sin\beta_m\sin\delta\right)$$
$$F_x = \frac{F_t}{\cos\beta_m}\left(\tan\alpha_n\sin\delta – \sin\beta_m\cos\delta\right)$$
By simplifying the contact between an abrasive particle and the tooth surface, I obtained the cutting depth of a single particle:
$$a_p = \sqrt{\frac{2F_{n0}}{\pi\delta_s \tan^2 \varepsilon}}$$
The maximum cutting depth in the lapping process can be expressed as:
$$a_{p,max} = \left(\frac{\eta d_m^3 p}{G \delta_s \tan^2 \varepsilon}\right)^{1/3}$$
The abrasive grain ratio is defined as:
$$G = \frac{6}{\pi n d_m^2 \eta}$$
In these equations, $$F_{n0}$$ is the normal force on a single abrasive particle, $$\delta_s$$ is the yield strength of the gear material, $$\varepsilon$$ is the half-angle of the abrasive cutting edge, $$\eta$$ is the volume fraction of abrasive, $$d_m$$ is the average abrasive diameter, $$p$$ is the contact pressure, and $$n$$ is the number of abrasive particles per unit area. These equations show that the maximum cutting depth increases with braking torque and abrasive diameter. It decreases with the number of abrasive particles and the abrasive grain ratio. A larger cutting depth produces a rougher tooth surface. Therefore, the lapping liquid and the equipment parameters must be matched to achieve the desired roughness and contact pattern.
2.2 V/H/J Motion Model
For the hypoid bevel gear, the tooth surface can be described by a family of parametric equations. The position vector and unit normal vector of the pinion and gear are:
$$\mathbf{r}_i = \mathbf{r}_i(u_i,\theta_i), \quad i=1,2$$
$$\mathbf{n}_i = \mathbf{n}_i(u_i,\theta_i), \quad i=1,2$$
After transformation into the fixed coordinate system of the lapping machine, the tooth surface equations become:
$$\mathbf{r}_h = \mathbf{r}_m(u_i,\theta_i,\phi_1,V,H,J)$$
$$\mathbf{n}_h = \mathbf{n}_h(u_i,\theta_i,\phi_1)$$
The meshing condition requires that the position vectors and normal vectors of the two tooth surfaces coincide at the contact point:
$$\mathbf{r}_{h1}(u_1,\theta_1;\phi_1,V,H,J)=\mathbf{r}_{h2}(u_2,\theta_2,\phi_2)$$
$$\mathbf{n}_{h1}(u_1,\theta_1;\phi_1)=\mathbf{n}_{h2}(u_2,\theta_2;\phi_2)$$
The equation of meshing can be written as:
$$\mathbf{n}_h^{(2)}\mathbf{v}_h^{(12)} = f(u_1,\theta_1,\phi_1,u_2,\theta_2,\phi_2,V,H,J)=0$$
The backlash control condition is:
$$H + J \tan\delta_2 + \sqrt{r_2^2 – E^2} – \sqrt{r_2^2 – V^2} = 0$$
Using these equations, I calculated the relationship between the V/H/J adjustments and the contact pattern movement. The V adjustment mainly moves the contact pattern along the tooth length direction. The H adjustment mainly moves the contact pattern along the tooth height direction. The J adjustment controls the backlash. By combining V, H, and J, the contact pattern of the hypoid bevel gear can be placed at the desired position. This model provided the theoretical basis for lapping path planning and parameter optimization.
2.3 Gear Parameters
The basic parameters of the hypoid bevel gear pair that I studied are listed in Table 5. The pinion had 10 teeth and the gear had 43 teeth. The pinion was left-handed and the gear was right-handed. The offset was $$25.00\,mm$$. The outer cone distance was approximately $$88.82\,mm$$ for the pinion and $$95.37\,mm$$ for the gear.
| Parameter | Pinion | Gear |
|---|---|---|
| Number of teeth | 10 | 43 |
| Module | — | 4.186 |
| Face width | 35.74 mm | 28 mm |
| Offset | 25.00 mm | — |
| Shaft angle | 90° | — |
| Outer cone distance | 88.82 mm | 95.37 mm |
| Outer diameter | 68.45 mm | 180.93 mm |
| Pitch diameter | — | 180.00 mm |
| Spiral direction | Left-hand | Right-hand |
| Cutting method | Formate | Generate |
3. Key Factors Influencing Hypoid Bevel Gear Lapping Quality
Based on the cutting model and the V/H/J motion model, I analyzed the main factors that affect the lapping quality of the hypoid bevel gear. These factors can be grouped into four categories: lapping liquid, equipment parameters, contact pattern, and lapping path. The lapping liquid determines the abrasive size, abrasive concentration, and lubrication. The equipment parameters include spindle speed, braking torque, and meshing backlash. The contact pattern before lapping determines the material removal distribution. The lapping path determines the movement of the contact pattern during the lapping cycle. Among these factors, I found that the lapping liquid and the equipment parameters have the most direct influence on roughness and transmission error. Therefore, I optimized these two aspects experimentally.
3.1 Lapping Liquid
The lapping liquid is a mixture of abrasive particles and suspension oil. The abrasive type, grit size, and mixing ratio affect the cutting depth and the surface finish of the hypoid bevel gear. I selected green silicon carbide as the abrasive because it has high hardness, good thermal conductivity, and strong cutting ability. The average hardness is about $$3200\text{–}3400\,HV$$. The suspension oil must keep the abrasive particles suspended, provide lubrication, and cool the contact zone. I used a high-suspension lapping oil. The density of the mixed lapping liquid can be estimated by:
$$\rho_{mix} = \frac{\rho_1 V_1 + \rho_2 V_2}{V_1+V_2}$$
For green silicon carbide, the density is about $$3.22\,g/cm^3$$. For the suspension oil, the density is about $$0.85\,g/cm^3$$. When the volume ratio of abrasive to oil is $$1:3$$, the mixed density is about $$1.54\,g/cm^3$$, which is close to the density of a commercial imported lapping liquid. I tested three mixing ratios: $$1:1$$, $$1:3$$, and $$1:5$$. The results are shown in Table 6. The ratio $$1:3$$ gave the lowest Ra and the most negative Rsk. A ratio of $$1:1$$ was too concentrated and produced poor flow. A ratio of $$1:5$$ was too dilute and reduced the cutting effect. Therefore, I selected $$1:3$$ as the optimal mixing ratio.
| Abrasive:oil volume ratio | Drive-side Ra / $$\mu m$$ | Drive-side Rsk | Coast-side Ra / $$\mu m$$ | Coast-side Rsk |
|---|---|---|---|---|
| 1:1 | 1.4611 | -0.0499 | 1.5203 | 0.0226 |
| 1:3 | 1.3209 | -0.2425 | 1.3850 | -0.2280 |
| 1:5 | 1.3396 | -0.1193 | 1.5150 | -0.1563 |
I also evaluated three abrasive grit sizes: 240#, 280#, and 320#. The results are shown in Table 7. As the grit number increased, the abrasive particle size decreased, and the roughness improved. The 320# abrasive produced the lowest Ra and the most negative Rsk without causing seizure or excessive lapping time. Therefore, I selected 320# green silicon carbide for the hypoid bevel gear lapping liquid.
| Abrasive grit | Drive-side Ra / $$\mu m$$ | Drive-side Rsk | Coast-side Ra / $$\mu m$$ | Coast-side Rsk |
|---|---|---|---|---|
| 240# | 1.3211 | -0.2425 | 1.2379 | -0.2056 |
| 280# | 1.2391 | -0.3533 | 1.2741 | -0.2183 |
| 320# | 1.1095 | -0.4967 | 1.1212 | -0.3050 |
3.2 Equipment Parameters
The equipment parameters include spindle speed, braking torque, and meshing backlash. The braking torque determines the normal pressure between the tooth surfaces. The spindle speed determines the cutting speed. The backlash determines how easily the abrasive particles enter the contact zone. I used an L9 orthogonal array to study the combined effects of these three factors. The factor levels are listed in Table 8. The levels were selected based on the machine capability and the hypoid bevel gear size. The spindle speed ranged from $$600$$ to $$1000\,r/min$$, the braking torque ranged from $$2$$ to $$5\,Nm$$, and the backlash ranged from $$0.07$$ to $$0.11\,mm$$.
| Level | Speed A / $$r/min$$ | Torque B / $$Nm$$ | Backlash C / $$mm$$ |
|---|---|---|---|
| 1 | 600 | 2 | 0.07 |
| 2 | 800 | 3.5 | 0.09 |
| 3 | 1000 | 5 | 0.11 |
3.3 Contact Pattern and Lapping Path
The contact pattern before lapping is very important for the hypoid bevel gear. If the contact pattern is near the toe or heel, or if it is too short or too long, the lapping process may not be able to correct it. I established a pre-lapping classification standard. The tooth surface was divided into six zones along the tooth length and three zones along the tooth height. The ideal pre-lapping contact pattern was located in the middle, slightly toward the toe, and centered in the tooth height direction. I classified the pre-lapping contact patterns into four categories and assigned different lapping paths to each category. This classification reduced the influence of subjective judgment and improved contact pattern consistency.
I also analyzed two common lapping paths: the back-track cycle and the ring cycle. In the back-track cycle, the contact pattern moves between a central point, a toe point, and a heel point. This path is simple and widely used. In the ring cycle, the contact pattern moves through several points arranged in a ring or figure-eight pattern. This path provides more uniform lapping but requires more setup effort. For the hypoid bevel gear studied here, I used the back-track cycle because it can be adjusted quickly for different pre-lapping contact patterns.
4. Orthogonal Optimization of Hypoid Bevel Gear Lapping Parameters
After selecting the lapping liquid, I optimized the equipment parameters using an orthogonal experiment. The factors were spindle speed A, braking torque B, and backlash C. Each factor had three levels. The L9 orthogonal array is shown in Table 9. Each trial was repeated three times, and the average values were used for analysis. The contact pattern was inspected first. Only gear sets with acceptable contact patterns were used for roughness and transmission error analysis. The drive-side and coast-side roughness and transmission error were measured.
| Trial | A: Speed / $$r/min$$ | B: Torque / $$Nm$$ | C: Backlash / $$mm$$ |
|---|---|---|---|
| 1 | 600 | 2 | 0.07 |
| 2 | 600 | 3.5 | 0.09 |
| 3 | 600 | 5 | 0.11 |
| 4 | 800 | 2 | 0.09 |
| 5 | 800 | 3.5 | 0.11 |
| 6 | 800 | 5 | 0.07 |
| 7 | 1000 | 2 | 0.11 |
| 8 | 1000 | 3.5 | 0.07 |
| 9 | 1000 | 5 | 0.09 |
4.1 Drive-Side Results
The drive-side roughness and transmission error results are shown in Table 10. The lowest Ra was obtained in trial 5, the lowest Rsk was obtained in trial 8, and the lowest transmission error was obtained in trial 7. The contact patterns after lapping were acceptable for all trials. The drive-side contact pattern was centered and slightly toward the toe. The coast-side contact pattern was also centered and slightly toward the toe. These results indicated that the lapping liquid and the selected parameter range were reasonable.
| Trial | Drive-side Ra / $$\mu m$$ | Drive-side Rsk | Drive-side TE / $$\mu rad$$ |
|---|---|---|---|
| 1 | 1.3453 | 0.1133 | 45.77 |
| 2 | 1.4404 | -0.1709 | 57.45 |
| 3 | 1.3041 | 0.0841 | 46.61 |
| 4 | 1.4504 | 0.0363 | 47.75 |
| 5 | 1.2516 | -0.1467 | 48.63 |
| 6 | 1.3343 | -0.1233 | 47.43 |
| 7 | 1.2543 | -0.4176 | 28.35 |
| 8 | 1.2805 | -0.7864 | 41.98 |
| 9 | 1.4574 | -0.1878 | 44.05 |
4.2 Range Analysis
I performed range analysis for Ra, Rsk, and transmission error. The range value R represents the influence of each factor. A larger R means a stronger influence. The range analysis results are shown in Table 11. For Ra, the influence order was B > A > C. For Rsk, the influence order was A > B > C. For transmission error, the influence order was A > B > C. The preferred levels were A3, B2, and C3 for Ra and transmission error, while the preferred levels for Rsk were A3, B2, and C1. By balancing the three responses, I obtained the combined preferred scheme A3B2C3: speed $$1000\,r/min$$, torque $$3.5\,Nm$$, and backlash $$0.11\,mm$$.
| Response | Factor A range | Factor B range | Factor C range | Influence order | Preferred scheme |
|---|---|---|---|---|---|
| Ra | 0.033 | 0.041 | 0.179 | B > A > C | A3B2C3 |
| Rsk | 0.473 | 0.292 | 0.158 | A > B > C | A3B2C1 |
| TE | 11.82 | 8.73 | 8.55 | A > B > C | A3B1C3 |
4.3 Regression Scoring Analysis
Because the three responses have different units and importance, I used a regression scoring method based on the least-squares principle. I assigned weights of 2, 3, and 2 to Ra, Rsk, and transmission error, respectively. The composite score was calculated as:
$$\text{Score} = 2 \times Ra + 3 \times Rsk + 2 \times TE$$
I then fitted a linear regression model:
$$Y = \beta_0 + \beta_1 x_1 + \beta_2 x_2 + \beta_3 x_3$$
The fitted coefficients were:
$$\beta = [173.43,\; -87.48,\; -29.99,\; -0.62]^T$$
Thus, the regression equation was:
$$Y = 173.4 – 87.48x_1 – 30x_2 – 0.62x_3$$
The regression scores are shown in Table 12. The range analysis of the regression scores gave the influence order A > C > B. The preferred scheme was again A3B2C3. This confirmed the result of the range analysis. The speed had the strongest influence, followed by backlash, and then torque.
| Trial | Ra / $$\mu m$$ | Rsk | TE / $$\mu rad$$ | Composite score | Regression score |
|---|---|---|---|---|---|
| 1 | 1.3453 | 0.1133 | 45.77 | 24.03 | 23.96 |
| 2 | 1.4404 | -0.1709 | 57.45 | 17.01 | 16.93 |
| 3 | 1.3041 | 0.0841 | 46.61 | 27.99 | 27.92 |
| 4 | 1.4504 | 0.0363 | 47.75 | 15.92 | 15.85 |
| 5 | 1.2516 | -0.1467 | 48.63 | 38.26 | 38.19 |
| 6 | 1.3343 | -0.1233 | 47.43 | 31.06 | 30.99 |
| 7 | 1.2543 | -0.4176 | 28.35 | 58.69 | 58.65 |
| 8 | 1.2805 | -0.7864 | 41.98 | 59.03 | 58.97 |
| 9 | 1.4574 | -0.1878 | 44.05 | 24.32 | 24.26 |
4.4 Analysis of Variance
I also performed an analysis of variance to evaluate the significance of each factor. The sum of squares, degrees of freedom, mean square, and F values are shown in Table 13. The results showed that speed A and backlash C were very significant, while torque B was not significant in the tested range. The error sum of squares was smaller than the factor sums of squares, which indicated that the experimental results were mainly caused by factor changes rather than random error. The optimal combination remained A3B2C3.
| Source | Sum of squares | Degrees of freedom | Mean square | F value | Significance |
|---|---|---|---|---|---|
| A | 981.43 | 2 | 490.72 | 12.83 | Very significant |
| B | 159.27 | 2 | 79.63 | 2.08 | Not significant |
| C | 882.06 | 2 | 441.03 | 11.53 | Very significant |
| Error | 76.48 | 2 | 38.24 | — | — |
| Total | 2099.25 | 8 | — | — | — |
4.5 Validation of the Optimized Scheme
The optimized scheme was not one of the nine trials, so I conducted a separate validation test. Three hypoid bevel gear sets were lapped with the new lapping liquid and the optimized parameters: speed $$1000\,r/min$$, torque $$3.5\,Nm$$, and backlash $$0.11\,mm$$. The results are shown in Table 14. For comparison, I also included one gear set lapped with the old parameters: speed $$800\,r/min$$, torque $$2\,Nm$$, and backlash $$0.07\,mm$$. The optimized hypoid bevel gear sets had lower Ra, more negative Rsk, and lower transmission error. The drive-side Ra decreased by about $$0.4\,\mu m$$. The Rsk decreased by about $$0.5$$ to $$0.7$$. The drive-side transmission error decreased by about $$15$$ to $$20\,\mu rad$$. The coast-side transmission error was below $$10\,\mu rad$$ for the optimized sets.
| Gear set | Drive-side Ra / $$\mu m$$ | Drive-side Rsk | Drive-side TE / $$\mu rad$$ | Coast-side Ra / $$\mu m$$ | Coast-side Rsk | Coast-side TE / $$\mu rad$$ |
|---|---|---|---|---|---|---|
| Optimized 1 | 0.9012 | -0.7290 | 26.18 | 0.8418 | -0.6425 | 7.268 |
| Optimized 2 | 0.8874 | -0.8227 | 27.74 | 0.8633 | -0.7533 | 8.799 |
| Optimized 3 | 0.9326 | -0.6029 | 31.29 | 0.9475 | -0.6932 | 10.12 |
| Old parameters | 1.3041 | -0.1065 | 46.61 | 1.2273 | 0.1102 | 14.50 |
I further installed the three optimized hypoid bevel gear sets into the same vehicle and performed NVH road tests. The results are shown in Table 15. All three sets passed the $$65\,dB$$ limit in all operating conditions. Two of them even stayed below $$60\,dB$$ in most conditions. The contact patterns after lapping were consistent and close to the product requirement. These results confirmed that the optimized lapping process is effective for the hypoid bevel gear.
| Gear set | Five-speed acceleration peak / dB | Five-speed coasting peak / dB | Five-speed uniform deceleration peak / dB |
|---|---|---|---|
| Optimized 1 | 57.30 | 59.00 | 58.63 |
| Optimized 2 | 62.92 | 59.57 | 62.36 |
| Optimized 3 | 59.51 | 55.68 | 58.20 |
5. Quality Control and Management of Hypoid Bevel Gear Lapping
To maintain the improved lapping quality in mass production, I established a set of quality control measures for the hypoid bevel gear. These measures include fixture accuracy control, lapping liquid management, and pre-lapping contact pattern classification.
5.1 Fixture Accuracy Control
The fixture accuracy directly affects the mounting distance of the hypoid bevel gear during lapping. If the runout of the fixture is too large, the meshing position will change, and the contact pattern will become inconsistent. I monitored the fixture accuracy over one month. The radial runout increased from about $$12\,\mu m$$ to $$16\,\mu m$$, and the end runout increased from about $$6\,\mu m$$ to $$10\,\mu m$$. Based on this trend, I set the upper limit for end runout at $$10\,\mu m$$ and the upper limit for radial runout at $$15\,\mu m$$. I also required a weekly fixture accuracy check. This control measure helps stabilize the lapping process of the hypoid bevel gear.
| Fixture item | Initial error / $$\mu m$$ | Error after half month / $$\mu m$$ | Upper limit / $$\mu m$$ | Check frequency |
|---|---|---|---|---|
| Pinion radial runout | 12 | 16 | 15 | Weekly |
| Pinion end runout | 6 | 10 | 10 | Weekly |
| Gear radial runout | 12 | 16 | 15 | Weekly |
| Gear end runout | 6 | 10 | 10 | Weekly |
5.2 Lapping Liquid Management
The lapping liquid is consumed during production. The abrasive particles also break or become dull. Therefore, I defined a management procedure for the hypoid bevel gear lapping liquid. The tank capacity was $$20\,L$$. I measured that about $$2\,L$$ of lapping liquid was consumed for every $$100$$ gear sets. To maintain the abrasive concentration, I added $$1\,L$$ of fresh lapping liquid every $$50$$ gear sets. A magnetic rod was placed in the tank to collect iron chips. I cleaned the iron chips every $$100$$ gear sets. Because cleaning removes some liquid, I added an extra $$0.5\,L$$ of fresh lapping liquid after each cleaning.
I also conducted a life test to determine the replacement interval. The Rsk value was used as the evaluation index because it reflects the removal of surface peaks. The results are shown in Table 16. When the number of lapped gear sets was below $$2000$$, the Rsk value remained between about $$-0.66$$ and $$-0.4$$. After about $$3200$$ sets, the Rsk value became stable near $$-0.1$$, which indicated that the lapping effect had deteriorated. Since the production line processed about $$200$$ sets per day, I set the full replacement interval at $$10$$ days, or $$2000$$ sets. The tank should be cleaned during replacement. This management rule ensures consistent lapping quality for the hypoid bevel gear.
| Number of lapped sets | Drive-side Rsk | Coast-side Rsk | Lapping condition |
|---|---|---|---|
| 200 | -0.66 | -0.64 | Excellent |
| 800 | -0.62 | -0.60 | Good |
| 1400 | -0.55 | -0.52 | Acceptable |
| 2000 | -0.45 | -0.42 | Acceptable limit |
| 2600 | -0.30 | -0.28 | Deteriorating |
| 3200 | -0.12 | -0.10 | Poor |
| 4000 | -0.10 | -0.08 | Unacceptable |
5.3 Pre-Lapping Contact Pattern Classification
I established a new classification standard for the pre-lapping contact pattern of the hypoid bevel gear. The tooth surface was divided into six zones along the tooth length and three zones along the tooth height. The best pre-lapping contact pattern is located in the middle, slightly toward the toe, and centered in the tooth height direction. I defined four categories: centered slightly toward the toe, centered slightly toward the heel, toe-shifted, and heel-shifted. Each category was assigned a specific lapping path and parameter adjustment strategy. For example, a toe-shifted contact pattern requires more lapping time at the heel position. A heel-shifted contact pattern requires more lapping time at the toe position. This classification reduces subjective judgment and improves contact pattern consistency. The classification rules are summarized in Table 17.
| Category | Contact pattern position | Recommended lapping action |
|---|---|---|
| I | Middle, slightly toward toe | Standard back-track cycle |
| II | Middle, slightly toward heel | Increase toe dwell time |
| III | Toe-shifted | Increase heel dwell time |
| IV | Heel-shifted | Increase toe dwell time and reduce heel pressure |
6. Results and Discussion
My study showed that the lapping quality of the hypoid bevel gear can be significantly improved by matching the lapping liquid and optimizing the equipment parameters. The new lapping liquid used 320# green silicon carbide and a suspension oil with an abrasive-to-oil ratio of $$1:3$$. The optimized equipment parameters were speed $$1000\,r/min$$, torque $$3.5\,Nm$$, and backlash $$0.11\,mm$$. Compared with the original process, the drive-side Ra decreased by about $$0.4\,\mu m$$, the Rsk decreased by about $$0.6$$, and the transmission error decreased by about $$18\,\mu rad$$. The vehicle NVH tests showed that all optimized hypoid bevel gear sets passed the $$65\,dB$$ requirement, and some sets achieved below $$60\,dB$$. The contact pattern consistency was also improved. These results demonstrate that the lapping process of the hypoid bevel gear is a key factor in the NVH performance of the rear axle.
I also found that the Rsk parameter is more sensitive than Ra for evaluating the lapping quality of the hypoid bevel gear. A more negative Rsk indicates that more surface peaks have been removed, which improves the contact condition and reduces noise. Therefore, I recommend using both Ra and Rsk as acceptance criteria for hypoid bevel gear lapping. The transmission error should also be controlled, especially on the drive side, because the drive side often carries the main load during acceleration.
The quality control measures that I established, including fixture accuracy limits, lapping liquid addition and replacement intervals, and pre-lapping contact pattern classification, help maintain the optimized lapping quality in mass production. The fixture end runout should not exceed $$10\,\mu m$$, and the radial runout should not exceed $$15\,\mu m$$. The lapping liquid should be replenished with $$1\,L$$ every $$50$$ sets, iron chips should be cleaned every $$100$$ sets, and the full liquid should be replaced every $$10$$ days or $$2000$$ sets. These rules are practical and easy to implement on the production line.
7. Conclusions
In my research, I systematically studied the lapping process of the hypoid bevel gear used in a microcar rear axle. The main conclusions are as follows.
First, the contact pattern, tooth surface roughness, and transmission error of the hypoid bevel gear have significant effects on vehicle NVH. A heel-shifted contact pattern, a high Ra, a positive Rsk, and a large transmission error all increase meshing noise. The Rsk parameter is especially important for evaluating lapping quality.
Second, I established a cutting model and a V/H/J motion model for the hypoid bevel gear. The cutting depth increases with braking torque and abrasive size and decreases with the number of abrasive particles. The V/H/J adjustments can move the contact pattern along the tooth surface and control the backlash. These models provide a theoretical basis for lapping parameter optimization.
Third, I selected a new lapping liquid for the hypoid bevel gear. The optimal abrasive was 320# green silicon carbide, the suspension oil was a high-suspension lapping oil, and the abrasive-to-oil volume ratio was $$1:3$$. This lapping liquid produced lower Ra and more negative Rsk than the original liquid.
Fourth, I optimized the lapping equipment parameters using an orthogonal experiment and a least-squares regression scoring method. The optimal parameters were speed $$1000\,r/min$$, torque $$3.5\,Nm$$, and backlash $$0.11\,mm$$. The analysis of variance showed that speed and backlash were significant factors, while torque was less significant in the tested range.
Fifth, the optimized hypoid bevel gear lapping process reduced the drive-side Ra by about $$0.4\,\mu m$$, reduced Rsk by about $$0.6$$, and reduced transmission error by about $$18\,\mu rad$$. The vehicle NVH tests confirmed that the optimized gears met the $$65\,dB$$ requirement and showed improved contact pattern consistency.
Sixth, I established practical quality control measures for the hypoid bevel gear lapping process. These measures include fixture accuracy limits, lapping liquid management rules, and pre-lapping contact pattern classification. They help stabilize the lapping quality in mass production.
Overall, my research provides a comprehensive approach to improving the lapping quality of the hypoid bevel gear. The results can be used to reduce rear axle noise, improve vehicle NVH performance, and increase the acceptance rate of hypoid bevel gear manufacturing. Future work can focus on more advanced lapping path planning and on the chemical and physical analysis of imported lapping liquids to further improve the performance of self-mixed lapping liquids for the hypoid bevel gear.