
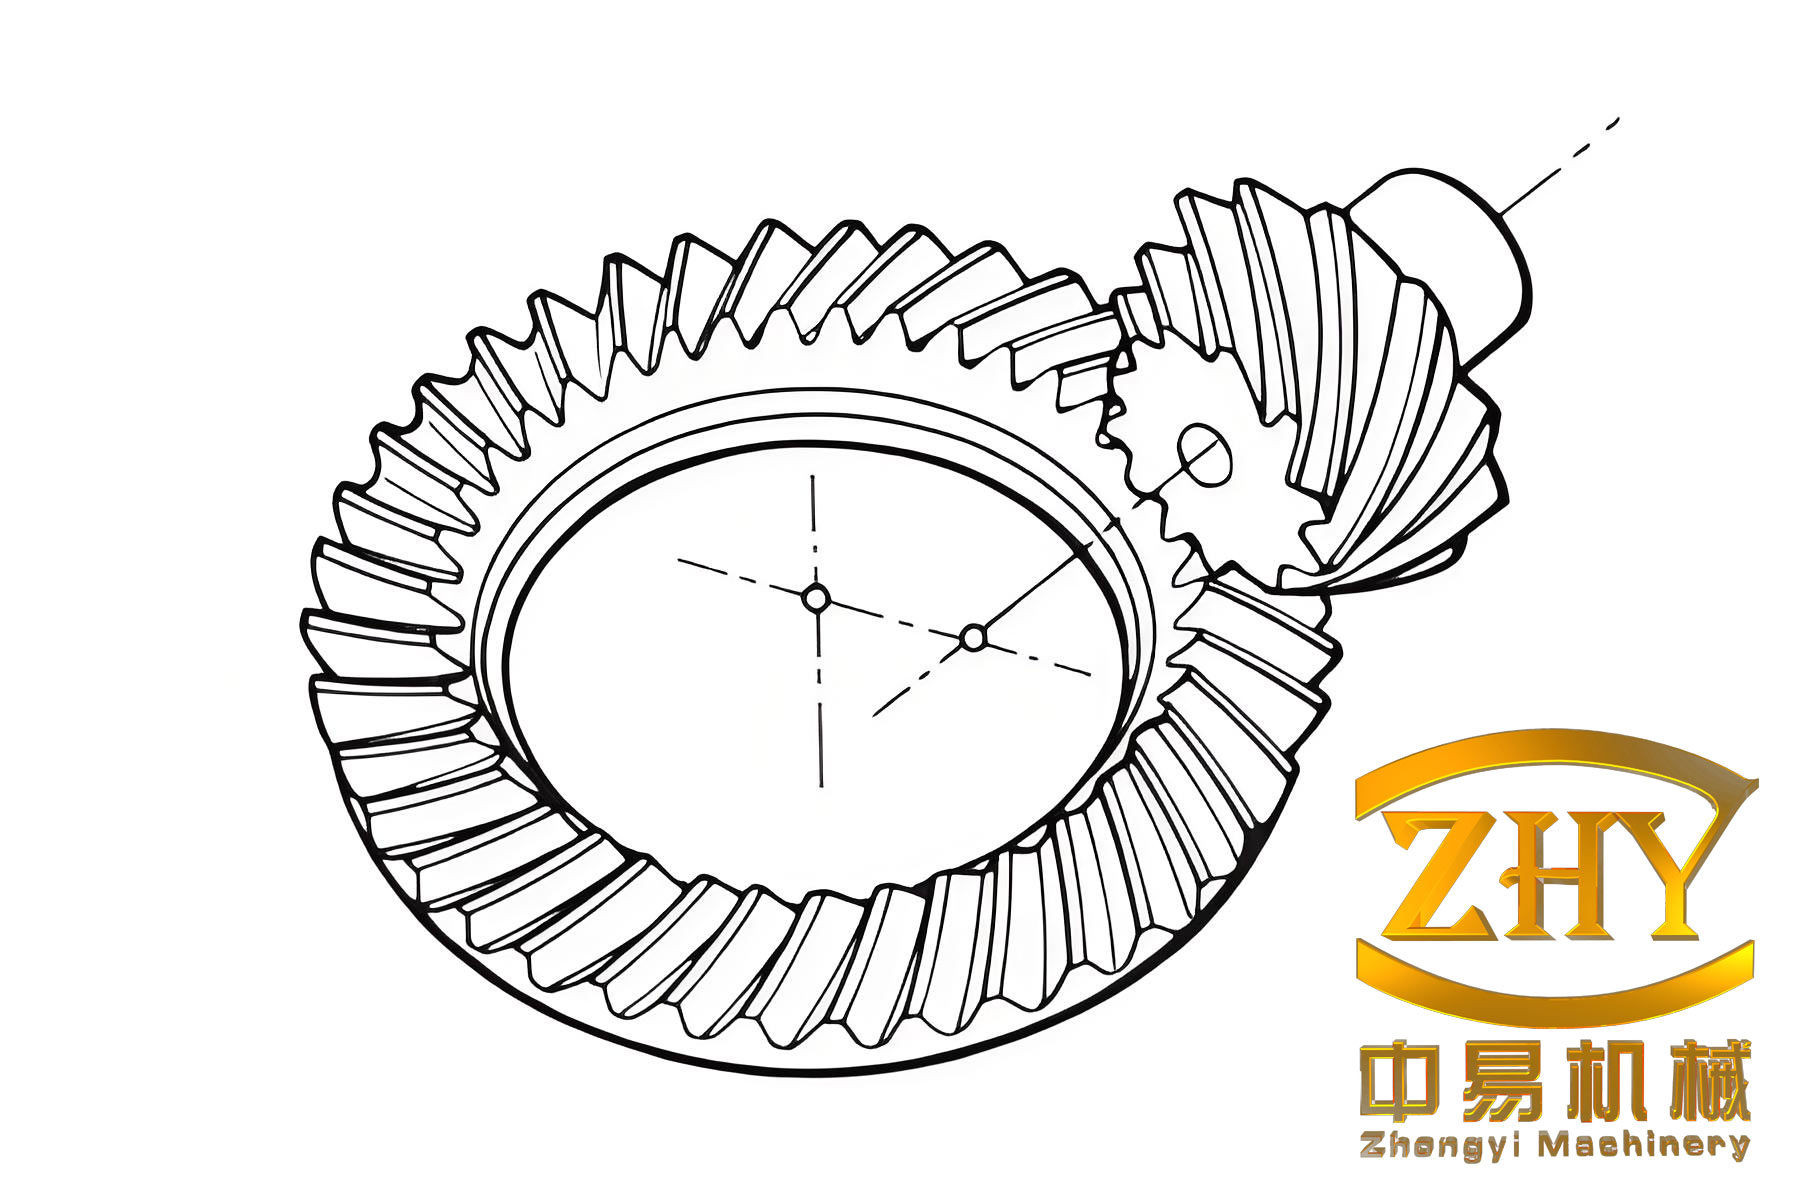
High reduction hypoid gears, which I refer to as HRH gears throughout this study, are a specialized evolution of conventional hypoid bevel gears. They combine a very small pinion tooth number with a large wheel tooth number, and they can achieve extremely high ratios while preserving the favorable meshing behavior of hypoid bevel gears. In my work, I focused on the dynamic meshing performance of these gears because their applications increasingly require high speed, high load capacity, low noise, and long precision life. I designed a point-contact tooth surface topology, established accurate mathematical models, performed kinematic and finite element simulations, and validated the results through rolling tests, vibration measurements, and transmission efficiency experiments.
The motivation for studying HRH gears is closely related to the limitations of other high-ratio transmissions. Worm gears often suffer from low efficiency and high axial forces. Planetary gear trains contain many components and require complex manufacturing and maintenance. Cycloidal and harmonic reducers also present difficult manufacturing and cost challenges. In contrast, hypoid bevel gears can be manufactured and ground with hard tooth surfaces, which gives them excellent accuracy retention. HRH gears inherit these advantages and can provide a compact, hollow-output, high-ratio solution. Their axial adjustability also makes them less sensitive to assembly errors and thermal expansion. For ratios above 60, HRH gears can still maintain transmission efficiency above 80%, which is comparable to current cycloidal reducers and offers room for further improvement through geometric design.
My research therefore addresses the complete chain from tooth surface generation to experimental verification. I began with the pitch cone design of hypoid bevel gears, introduced a longitudinal displacement coefficient, and established the geometric constraints for HRH gears. I then proposed a bidirectional cutter modification for the wheel and a general generating method for the pinion. This combination compensates for the insufficient curvature of the wheel tooth profile while reducing the difficulty of pinion machining. Based on these models, I constructed an ease-off surface, optimized the pinion machining parameters, built a precise three-dimensional model, and carried out meshing simulations. Finally, I conducted rolling tests, dynamic performance tests, and transmission efficiency tests on a 3:60 HRH gear pair.
Geometric Design and Mathematical Model
Hypoid bevel gears transmit motion between skew axes. Their pitch cones are tangent at a common node, and the basic ratio relationship can be written as
$$ \frac{z_1}{z_2}=\frac{R_1\sin\delta_1\cos\beta_1}{R_2\sin\delta_2\cos\beta_2} $$
where \(z\) is the tooth number, \(R\) is the pitch cone distance, \(\delta\) is the pitch cone angle, and \(\beta\) is the spiral angle. The subscripts 1 and 2 denote the pinion and the wheel, respectively. For HRH gears, the wheel usually has a large pitch cone angle, and the pinion has very few teeth. This makes the design of the pitch cones and the tooth height taper especially important. I introduced a longitudinal displacement coefficient \(k_p\) to adjust the pitch cone distance and the pitch diameter. The modified pitch cone distance and pitch diameter can be expressed as
$$ R_m = R_2 + \Delta R, \quad \Delta R = \frac{b_2}{2}(1-k_p) $$
$$ d_e = d_{e2} – b_2 k_p \sin\delta_2 $$
where \(b_2\) is the wheel face width and \(d_{e2}\) is the outer pitch diameter of the wheel. When \(k_p\) is positive, the node moves toward the outer end, the root angle becomes smaller, and the pinion outer diameter increases. This longitudinal displacement provides additional freedom for matching the pitch cones and controlling the tooth height taper. I summarized the influence of \(k_p\) in Table 1.
| Longitudinal displacement coefficient \(k_p\) | Tooth height taper | Pitch cone angle (pinion) | Pitch cone angle (wheel) | Outer diameter (pinion) | Outer diameter (wheel) |
|---|---|---|---|---|---|
| Increase | Weaken | Increase | Decrease | Increase | Unchanged |
| Decrease | Strengthen | Decrease | Increase | Decrease | Unchanged |
For HRH gears, the design pitch cone and the cutting pitch cone are not identical. The misalignment angle between them is
$$ \Delta = \theta_{f1} + \theta_{f2} $$
where \(\theta_{f1}\) and \(\theta_{f2}\) are the root angles of the pinion and the wheel. To ensure correct meshing, I applied local conjugate point contact through tooth surface modification. The relationship between the actual and theoretical normal curvatures along the tooth height and tooth length directions can be described by the Euler-Betrand formula. For the wheel, the actual longitudinal and transverse curvatures are
$$ A_f = A_0 \cos^2\theta_{fi}, \quad B_f = A_0 \sin^2\theta_{fi} $$
I found that when the root angle is small, the actual tooth surface approaches the theoretical surface, and the conjugate condition becomes better. Therefore, HRH gears are preferably designed as constant-depth gears.
Several limiting conditions must be considered. The limit pressure angle is
$$ \tan\alpha_{\lim} = \frac{R_2\sin\beta_2 – R_1\sin\beta_1}{R_2\tan\delta_2 + R_1\tan\delta_1}\cos\varepsilon’ $$
where \(\varepsilon’\) is the offset angle. To avoid meshing limit points, I required \(\alpha_{\lim} < 8^\circ\). The limit curvature radius is
$$ r_{\lim} = \frac{\tan\beta_1 – \tan\beta_2}{\frac{\tan\beta_1}{R_1} – \frac{\tan\beta_2}{R_2} – \frac{\tan\alpha_{\lim}}{\cos\beta_1\cos\beta_2}\left(\frac{1}{R_1\tan\delta_1} – \frac{1}{R_2\tan\delta_2}\right)} $$
For a good meshing performance, I ensured that \(|r_{\lim}/r_c – 1| \le 0.01\), where \(r_c\) is the cutter radius. I also imposed constraints on the wheel pitch cone angle, the tooth numbers, the offset distance, the spiral angles, and the minimum slot width. Using these constraints, I calculated the geometric parameters for a 3:60 HRH gear pair, as listed in Table 2.
| Geometric parameter | Pinion | Wheel |
|---|---|---|
| Number of teeth | 3 | 60 |
| Hand of spiral | Left | Right |
| Face width (mm) | 28.979 | 20 |
| Mid-point spiral angle (deg) | 72 | 32.8983 |
| Pitch cone angle (deg) | 10.9919 | 75.8605 |
| Face cone angle (deg) | 10.9919 | 75.8605 |
| Root cone angle (deg) | 10.9919 | 75.8605 |
| Outer diameter (mm) | 27.9074 | 145 |
| Mid-point whole tooth height (mm) | 3.614 | 3.614 |
| Offset distance (mm) | 40 | – |
For the wheel, I adopted a forming method with a modified cutter. The cutter profile was modified along the \(w\) direction by a quadratic parabola. The modification curve and its derivative are
$$ w_c = a_1 (u_c – u_0)^2, \quad w_c’ = 2 a_1 (u_c – u_0) $$
where \(a_1\) is the profile curvature parameter and \(u_0\) is the reference point position. The modified pressure angle becomes
$$ \alpha_2(u_c) = \alpha_0 + \arctan(w_c’) $$
The cutter surface in the cutter coordinate system can be written as
$$ \mathbf{r}_c = \begin{bmatrix} (r_0 \pm u_c \sin\alpha_2)\cos\theta_c \\ (r_0 \pm u_c \sin\alpha_2)\sin\theta_c \\ u_c \cos\alpha_2 \end{bmatrix} $$
$$ \mathbf{n}_c = \begin{bmatrix} \cos\alpha_2\cos\theta_c \\ \cos\alpha_2\sin\theta_c \\ \sin\alpha_2 \end{bmatrix} $$
I also introduced a longitudinal curvature modification to form a point contact. The combined cutter surface equation becomes
$$ \mathbf{r}_{ci} = \begin{bmatrix} r_0 \pm (u_c \sin\alpha_i)\cos\theta_i \\ r_0 \pm (u_c \sin\alpha_i)\sin\theta_i \\ u_c \cos\alpha_i \end{bmatrix} $$
$$ \mathbf{n}_{ci} = \begin{bmatrix} \cos\alpha_i\cos\theta_i \\ \cos\alpha_i\sin\theta_i \\ \pm\sin\alpha_i \end{bmatrix} $$
where \(r_0\) is the cutter tip radius, and \(\alpha_i\) is the pressure angle. The wheel tooth surface and its normal were obtained by coordinate transformation from the cutter coordinate system to the wheel coordinate system. The transformation matrix includes the radial cutter position, the angular cutter position, the axial setting, the wheel mounting angle, and the vertical offset. The final wheel surface equation can be expressed as
$$ \mathbf{r}_2 = \mathbf{M}_{2m}\mathbf{M}_{mc}\mathbf{r}_c, \quad \mathbf{n}_2 = \mathbf{L}_{2m}\mathbf{L}_{mc}\mathbf{n}_c $$
For the pinion, I used a conjugate surface method. The pinion tooth surface was derived from the wheel surface by the meshing equation
$$ \mathbf{n}_2 \cdot \mathbf{v}_{21} = 0 $$
where \(\mathbf{v}_{21}\) is the relative velocity between the wheel and the pinion. The relative velocity in the wheel coordinate system is
$$ \mathbf{v}_{21} = \begin{bmatrix} \omega_{2z} y_2 – \omega_{2x} z_2 \\ \omega_{2x} z_2 – \omega_{2z} x_2 \\ \omega_{2x} y_2 – \omega_{2y} x_2 \end{bmatrix} $$
By substituting the wheel normal vector and the relative velocity into the meshing equation, I obtained a nonlinear equation containing the cutter parameters and the wheel rotation angle. Eliminating the rotation angle gave the pinion tooth surface equation. This mathematical model provided the basis for the point contact topology design.
Point Contact Topology Design
Conjugate hypoid bevel gears form line contact, which is sensitive to installation errors and can produce severe dynamic excitation. Therefore, modern designs prefer point contact. After modifying the wheel cutter, the wheel profile curvature is partially compensated. In the longitudinal direction, the different forming curvature radii of the wheel and pinion cutters create a curvature difference, which produces point contact. To control the meshing performance, I proposed a point contact topology modification method based on the ease-off surface.
I used the surface synthesis method to solve the pinion machining parameters. The core idea is that the pinion tooth surface and its second-order osculating surface have the same differential geometric properties. The osculating surface can be expressed as
$$ z = 0.5 k_x x^2 + \tau_x x y + 0.5 k_y y^2 $$
where \(k_x\) and \(k_y\) are normal curvatures, and \(\tau_x\) is the geodesic torsion. When the torsion is zero, the principal curvatures are \(k_x\) and \(k_y\). I constructed an ease-off surface between the conjugate pinion surface and the modified pinion surface. In the neighborhood of the reference point, the ease-off surface can be represented by
$$ z_d = 0.5 k_a x_d^2 + 0.5 k_b y_d^2 $$
where \(k_a\) and \(k_b\) are the principal curvatures of the ease-off surface. The contact ellipse is obtained by taking the contour \(z_d = 0.00635\) mm. The semi-major and semi-minor axes are
$$ a = \sqrt{\frac{8 z_d}{k_a}}, \quad b = \sqrt{\frac{8 z_d}{k_b}} $$
The angle between the first principal direction and the contact path tangent is
$$ q = \arctan\sqrt{\frac{k_a}{k_b}} $$
The normal curvature along the contact path is
$$ k_s = k_a \cos^2 q + k_b \sin^2 q $$
This curvature reflects the first derivative of the instantaneous transmission ratio function and determines the transmission error. The ease-off surface also provides the contact path, the differential curvature, and the transmission error. I optimized the pinion machining parameters by iteratively adjusting the cutter modification parameters and the contact ellipse parameters. The optimization flow starts with preset cutter modification and contact ellipse parameters, solves the surface synthesis equations, builds the ease-off surface, analyzes the contact performance, and updates the parameters until the design requirements are met.
For the 3:60 HRH gear pair, the optimized machining parameters are listed in Table 3. The wheel was machined by the forming method with a modified cutter, and the pinion was machined by the generating method. The cutter tip radius for the pinion was 37.6 mm, and the pressure angle was 20.5°. The radial cutter position was 51.9712 mm, the angular cutter position was 75.5564°, the axial setting was –0.2667 mm, the vertical offset was 39.9843 mm, the wheel mounting angle was 10.9919°, the bed position was –1.525318 mm, and the roll ratio was 19.9492.
| Machining parameter | Pinion | Wheel concave | Wheel convex |
|---|---|---|---|
| Profile curvature parameter \(a_1\) | – | 0.014 | 0.014 |
| Reference position \(u_0\) (mm) | – | 1.4 | 1.4 |
| Cutter tip radius \(r_c\) (mm) | 37.6 | 37.4 | 37.4 |
| Cutter pressure angle \(\alpha_c\) (deg) | 20.5 | 19.0 | 19.0 |
| Radial cutter position \(S_r\) (mm) | 51.9712 | 53.1513 | 53.1513 |
| Angular cutter position \(q\) (deg) | 75.5564 | 42.2143 | 42.2143 |
| Axial setting \(X_G\) (mm) | -0.2667 | 5.3428 | 5.3428 |
| Vertical offset \(E_m\) (mm) | 39.9843 | – | – |
| Wheel mounting angle \(\gamma\) (deg) | 10.9919 | 74.7639 | 74.7639 |
| Bed position \(X_b\) (mm) | -1.525318 | – | – |
| Roll ratio \(i_m\) | 19.9492 | – | – |
After solving the machining parameters, I constructed the ease-off surface for the entire tooth surface. The normal modification amount is
$$ z_d = (\mathbf{r}_s – \mathbf{r}_1)\cdot\mathbf{n}_1 $$
where \(\mathbf{r}_s\) is the pinion contact surface and \(\mathbf{r}_1\) is the conjugate pinion surface. The ease-off surface showed that the modification amounts at the entry and exit ends were 26.11 μm and 34.86 μm, respectively. The contact ellipse was located in the middle of the tooth surface, slightly toward the toe. The contact path and the transmission error curve indicated that the overlap ratio exceeded 5. The transmission error at the gear pair alternation point was –1.002 μm, and the first and sixth transmission error curves crossed each other. These factors ensure the precision and smoothness of the HRH transmission.
To build a precise three-dimensional model, I divided the tooth surface into a grid using the rotary projection principle. For a grid with \(m\) rows and \(n\) columns, the boundary points were calculated from the face cone, pitch cone, and root cone angles. The coordinates of the interior points were obtained by intersecting lines between the boundaries. The three-dimensional coordinates were related to the projection coordinates by
$$ x_{ij} = X, \quad y_{ij} = \sqrt{Y^2 + Z^2} $$
I generated 13 rows and 47 columns for both the wheel and the pinion. The boundary point coordinates are listed in Table 4. The data points were imported into a three-dimensional modeling software, and the tooth surfaces were trimmed and arrayed to form the complete gears. The three-dimensional meshing simulation showed five pairs of teeth in contact at the same time, confirming an overlap ratio of 5. The instantaneous contact area was elliptical and located in the middle of the tooth surface, which agreed with the ease-off analysis.
| Position | Pinion \((x, y, z)\) (mm) | Wheel \((x, y, z)\) (mm) |
|---|---|---|
| Toe convex addendum | (-6.776, 6.05, 37.41) | (52.35, 2.436, 8.725) |
| Toe convex dedendum | (-3.341, -4.922, 34.87) | (53.1, 0.99, 5.948) |
| Heel convex addendum | (13.33, -3.162, 60.62) | (69.21, 19.1, 13.61) |
| Heel convex dedendum | (9.363, 5.468, 60.76) | (70.45, 17.11, 10.83) |
| Toe concave addendum | (-0.777, 6.205, 37.03) | (52.39, -1.167, 8.725) |
| Toe concave dedendum | (-8.613, 1.437, 34.27) | (53.11, -0.031, 5.948) |
| Heel concave addendum | (7.96, -11.19, 60.79) | (70.39, 14.15, 13.61) |
| Heel concave dedendum | (-2.987, -10.94, 62.55) | (70.8, 15.61, 10.83) |
Kinematic Simulation and Finite Element Contact Analysis
I used a multibody dynamics software to analyze the kinematic behavior of the HRH gear pair. The three-dimensional models were assembled according to the mounting distance and imported into the simulation environment. I set the units to MMKS, assigned the material properties, and defined the revolute joints for both gears. The contact between the gear teeth was modeled by the impact function method. The contact force consists of an elastic force and a damping force. The impact function is
$$ F_{\text{impact}} = k q^e + c_{\max} \frac{dq}{dt} \text{step}(q) $$
where \(k\) is the stiffness coefficient, \(e\) is the force exponent, \(q\) is the penetration depth, and \(c_{\max}\) is the maximum damping coefficient. The stiffness coefficient was calculated from the equivalent radius and the elastic modulus:
$$ k = \frac{4}{3} R^{1/2} E^* $$
$$ \frac{1}{R} = \frac{1}{R_1} + \frac{1}{R_2}, \quad E^* = \frac{E}{2(1-\sigma^2)} $$
where \(R_1\) and \(R_2\) are the equivalent radii of the pinion and the wheel, \(E\) is the elastic modulus, and \(\sigma\) is the Poisson ratio. The contact parameters used in the simulation are listed in Table 5.
| Parameter | Value |
|---|---|
| Stiffness coefficient (N/mm) | \(4.10167 \times 10^5\) |
| Force exponent | 1.5 |
| Damping | 1640.669 |
| Penetration depth (mm) | 0.1 |
| Static friction coefficient | 0.08 |
| Dynamic friction coefficient | 0.06 |
| Static transition velocity (mm/s) | 0.1 |
| Friction transition velocity (mm/s) | 10 |
The material properties of the HRH gears are given in Table 6. Both gears were made of 20CrMnTi steel. The density was \(7.8 \times 10^{-6}\) kg/mm\(^3\), the elastic modulus was \(2.07 \times 10^5\) N/mm\(^2\), and the Poisson ratio was 0.25.
| Component | Material | Density (kg/mm\(^3\)) | Elastic modulus (N/mm\(^2\)) | Poisson ratio |
|---|---|---|---|---|
| Wheel | 20CrMnTi | \(7.8 \times 10^{-6}\) | \(2.07 \times 10^5\) | 0.25 |
| Pinion | 20CrMnTi | \(7.8 \times 10^{-6}\) | \(2.07 \times 10^5\) | 0.25 |
I simulated three input speeds: 710 rpm, 1410 rpm, and 2100 rpm. For each speed, I applied two loads: 50 Nm and 200 Nm. The simulation time was 1 s with 10000 steps. The angular acceleration amplitude of the wheel in the radial direction was extracted for each operating condition. The peak values at the meshing frequencies are summarized in Table 7.
| Harmonic order | 710 rpm, 50 Nm | 710 rpm, 200 Nm | 1410 rpm, 50 Nm | 1410 rpm, 200 Nm | 2100 rpm, 50 Nm | 2100 rpm, 200 Nm |
|---|---|---|---|---|---|---|
| 1 | 953.6 | 226.3 | 2260.5 | 389.2 | 3367.4 | 698.1 |
| 2 | 2896.6 | 591.2 | 3990.8 | 712.8 | 7817.5 | 1183.3 |
| 3 | 788.7 | 312.7 | 843.7 | 464.5 | 2879.8 | 565.9 |
| 4 | 1022.7 | 216.2 | 1171.8 | 511.1 | 2135.4 | 773.7 |
| 5 | 1063.5 | 238.4 | 2482.1 | 339.3 | 3191.6 | 328.5 |
| 6 | 1514.3 | 247.2 | 1608.4 | 245.2 | 1675.3 | 290.0 |
| 7 | 985.8 | 192.3 | 2977.4 | 231.7 | 1362.4 | 291.0 |
| 8 | 1095.6 | 173.1 | 1370.6 | 127.0 | 2020.5 | 238.4 |
| 9 | 637.2 | 225.0 | 851.1 | 293.1 | 2022.4 | 367.4 |
| 10 | 1019.3 | 119.8 | 1145.1 | 141.0 | 1024.6 | 349.1 |
The simulation results show that the angular acceleration peaks occur at the meshing frequency harmonics. The second harmonic is the dominant one. When the load is increased from 50 Nm to 200 Nm, the angular acceleration amplitude decreases significantly, and the sidebands are reduced. This indicates that a higher load makes the transmission smoother and reduces the meshing impact. When the speed increases, the angular acceleration amplitude increases. The trend is consistent for all harmonics. Therefore, selecting an appropriate speed and increasing the working load within a certain range can reduce the meshing vibration excitation.
I also performed a finite element contact analysis using a commercial finite element software. The analysis type was dynamic implicit. I divided the gears into single teeth to reduce the computational cost. The single tooth models were meshed with tetrahedral elements of type C3D10M. The mesh size was 0.4 mm. After meshing, the wheel single tooth had 58478 nodes and 39275 elements, while the pinion single tooth had 193907 nodes and 131455 elements. The complete wheel mesh had 935648 nodes and 628400 elements, and the complete pinion mesh had 581721 nodes and 394365 elements. The finite element model is shown in the previous sections.
I applied three load cases: 100 Nm, 200 Nm, and 300 Nm. The instantaneous contact stress on the wheel tooth surface was obtained. The contact area was elliptical and located in the middle of the tooth surface, slightly toward the toe. The stress distribution was reasonable, with higher values in the center and lower values at the edges. As the load increased, the contact area expanded, and the overlap ratio increased. The maximum contact stress values for the three loads were 1459.34 MPa, 1674.82 MPa, and 2145.6 MPa, respectively. The contact stress variation over one full meshing cycle is summarized in Table 8.
| Load (Nm) | Main contact stress range (MPa) | Maximum contact stress (MPa) | Maximum root bending stress (MPa) |
|---|---|---|---|
| 100 | 800–1200 | 1459.34 | 280.24 |
| 200 | 1000–1400 | 1674.82 | 466.25 |
| 300 | 1200–1700 | 2145.60 | 634.04 |
The root bending stress also increased with the load. For 100 Nm, the root bending stress stabilized between 150 and 250 MPa. For 200 Nm, it stabilized between 300 and 500 MPa. For 300 Nm, it stabilized between 400 and 600 MPa. The stress distribution along the tooth surface was smooth, and no edge contact was observed. These results confirmed that the point contact design provides a uniform load distribution and a high overlap ratio.
Dynamic Performance and Transmission Efficiency Tests
I manufactured the 3:60 HRH gear pair and performed a rolling test on a gear rolling machine. The tooth surfaces were coated with red lead powder. After several meshing cycles, the contact pattern was obtained. The contact pattern was elliptical and located in the middle of the wheel tooth surface, slightly toward the toe. The contact patterns on all teeth were similar in size, and no edge contact was observed. The experimental contact pattern agreed well with the simulation results, which verified the feasibility of the point contact design method.
I built a closed gearbox test rig for the HRH gear pair. The pinion was the input, and the wheel output was through a hollow shaft. The test rig consisted of a drive motor, torque sensors, the HRH gearbox, and a magnetic powder brake. The motor was a variable-frequency motor with a rated power of 30 kW. The torque sensor on the input side had a rated torque of 50 Nm, and the torque sensor on the output side had a rated torque of 1000 Nm. The magnetic powder brake had a rated torque of 400 Nm. The load was controlled by a loading controller. The test rig layout and equipment parameters are listed in Table 9.
| Equipment | Model | Parameters |
|---|---|---|
| Drive motor | CEMA YP-50-30-4 | Rated power 30 kW |
| Torque sensor I | JC1A | Rated torque 50 Nm |
| Torque sensor II | JC2C | Rated torque 1000 Nm |
| Torque meter | JW-3 | – |
| Magnetic powder brake | CZ40 | Rated torque 400 Nm |
| Loading controller | WLK-3A | – |
Vibration signals were acquired using a multichannel data acquisition system with piezoelectric accelerometers. The sensors were mounted at the output gear meshing position in three directions: vertical, axial, and horizontal. The sampling bandwidth was 1600 Hz, and the sampling frequency was 4096 Hz. The tests were conducted at three input speeds: 710 rpm, 1410 rpm, and 2100 rpm, with two loads: 50 Nm and 200 Nm. The vibration acceleration spectra were analyzed in the frequency domain.
For the 1410 rpm and 50 Nm condition, the meshing frequency harmonics were clearly visible in all three channels. The second harmonic had the largest amplitude: 0.4434 m/s\(^2\) in the vertical direction, 0.2138 m/s\(^2\) in the axial direction, and 0.3672 m/s\(^2\) in the horizontal direction. When the load was increased to 200 Nm, the vibration amplitudes decreased. The second harmonic remained dominant in the vertical and horizontal directions, with amplitudes of 0.1586 m/s\(^2\) and 0.13 m/s\(^2\), respectively. The axial amplitude was 0.07108 m/s\(^2\). The sidebands increased with load, which may be caused by the flexibility of the test rig and the coupling misalignment. However, the overall trend of decreasing vibration with increasing load was consistent with the simulation.
The vibration acceleration amplitudes in the vertical direction for the three speeds and two loads are summarized in Table 10. The maximum amplitude appeared at the fourth meshing harmonic for 710 rpm and at the first meshing harmonic for 1410 rpm. In all cases, the peaks were related to the pinion shaft frequency. The vibration signal was strongest in the frequency band of 100–200 Hz, which indicates that the natural frequency of the system has a significant influence on the vibration amplitude. As the speed increased, the vibration acceleration increased. As the load increased, the vibration acceleration decreased. These trends agree with the simulation results.
| Speed (rpm) | Load (Nm) | Dominant harmonic | Vertical vibration amplitude (m/s\(^2\)) |
|---|---|---|---|
| 710 | 50 | 4 | 0.1716 |
| 710 | 200 | 4 | 0.1170 |
| 1410 | 50 | 1 | 0.3547 |
| 1410 | 200 | 1 | 0.4820 |
| 2100 | 50 | 1 | 0.8505 |
| 2100 | 200 | 1 | 0.3116 |
I also measured the transmission efficiency of the HRH gearbox. The input and output torques were recorded simultaneously using two torque meters. The tests were conducted at three speeds: 1500 rpm, 1800 rpm, and 2400 rpm. The wheel load ranged from 83 Nm to 295 Nm. The transmission efficiency was calculated as the ratio of output power to input power. The average efficiencies are listed in Table 11.
| Speed (rpm) | Load range (Nm) | Maximum efficiency (%) | Minimum efficiency (%) | Average efficiency (%) |
|---|---|---|---|---|
| 1500 | 83–295 | 79.43 | 76.80 | 78.12 |
| 1800 | 83–295 | 81.35 | 77.81 | 79.58 |
| 2400 | 83–295 | 82.09 | 78.66 | 80.38 |
The transmission efficiency increased with speed and decreased with load. The highest efficiency was 82.09%, and the lowest was 76.8%. The average efficiency over all conditions was about 79.45%. Several factors influenced the efficiency, including misalignment of the couplings, installation errors, power losses in the bearings and seals, oil viscosity and temperature, and the gearbox structure. The experimental results showed a consistent trend with the simulation and confirmed the feasibility of the HRH gear design.
Conclusions and Future Work
In this study, I investigated the dynamic meshing performance of high reduction hypoid gears. I proposed a point contact tooth surface design method based on the conventional machining method of hypoid bevel gears. I established the geometric model of the constant-depth HRH gear, derived the wheel and pinion tooth surface equations, and introduced a bidirectional cutter modification to compensate for the insufficient wheel profile curvature. I constructed an ease-off surface and optimized the pinion machining parameters to achieve a desired contact path, differential curvature, and transmission error. The numerical model and the three-dimensional meshing simulation showed that the contact pattern was elliptical, located in the middle of the tooth surface, and the overlap ratio exceeded 5.
I built a kinematic model in a multibody dynamics environment and analyzed the angular acceleration of the wheel under different speeds and loads. The angular acceleration peaks occurred at the meshing frequency harmonics, and the second harmonic was dominant. Increasing the speed increased the vibration, while increasing the load decreased the vibration. I also performed a finite element contact analysis. The contact stress and root bending stress were calculated for loads of 100 Nm, 200 Nm, and 300 Nm. The stress distribution was uniform, and the contact area expanded with load. The maximum contact stress reached 2145.6 MPa at 300 Nm, and the maximum root bending stress was 634.04 MPa.
I conducted rolling tests, vibration tests, and transmission efficiency tests. The experimental contact pattern agreed well with the simulation. The vibration acceleration was dominated by the second meshing harmonic, and the vertical direction showed the strongest signal. The transmission efficiency increased with speed and decreased with load. The highest efficiency was 82.09%, and the average efficiency was about 79.45%. The experimental results validated the design method and the simulation procedure.
For future work, I plan to develop a more comprehensive dynamic model that includes lubrication, friction, and thermal effects. I also intend to improve the finite element mesh for the pinion by using hexahedral elements to reduce computational cost. In addition, I will include oil temperature and noise measurements in the experiments and extend the load and speed ranges. These improvements will further enhance the understanding of high reduction hypoid gears and support their application in precision robotic joints, machine tool indexing, and other high-performance transmission systems.