
Introduction
Miter gears, particularly in the form of double-helical or herringbone configurations, are widely employed in high-speed and heavy-load transmission systems such as aero-engines, marine propulsion, mining machinery, and automotive drivetrains. Their advantages include compact size, minimal axial force, high load-carrying capacity, and superior transmission efficiency. However, in high-speed and heavy-load operations, the microscopic topography of the tooth contact surface significantly influences the meshing efficiency, lubrication state, and power loss of miter gears. The present work focuses on the external meshing pair of a miter gear planetary transmission system used in an aero-engine. I combine dynamic modeling, mixed elastohydrodynamic lubrication, and genetic algorithm-based optimization to investigate the effects of manufacturing precision, rotational speed, and real surface topography on the lubrication condition and power loss of miter gears. Furthermore, I optimize the working tooth surface of the external meshing pair to reduce friction loss and improve transmission performance. The key contributions are summarized as follows: (1) a 16-degree-of-freedom dynamic model of a miter gear pair considering tooth surface friction is established; (2) real 3D surface topographies of miter gears with grades 5, 6, and 7 are extracted using a laser confocal microscope; (3) the influence of microscopic morphology on film thickness ratio, oil film load-carrying ratio, and power loss is analyzed; and (4) a genetic algorithm is employed to perform comprehensive tooth surface modification, achieving reduced transmission error and more uniform load distribution. Throughout this article, the term “miter gears” refers to the double-helical configuration unless otherwise specified. The findings provide a theoretical foundation for the design and optimization of high-performance miter gears.
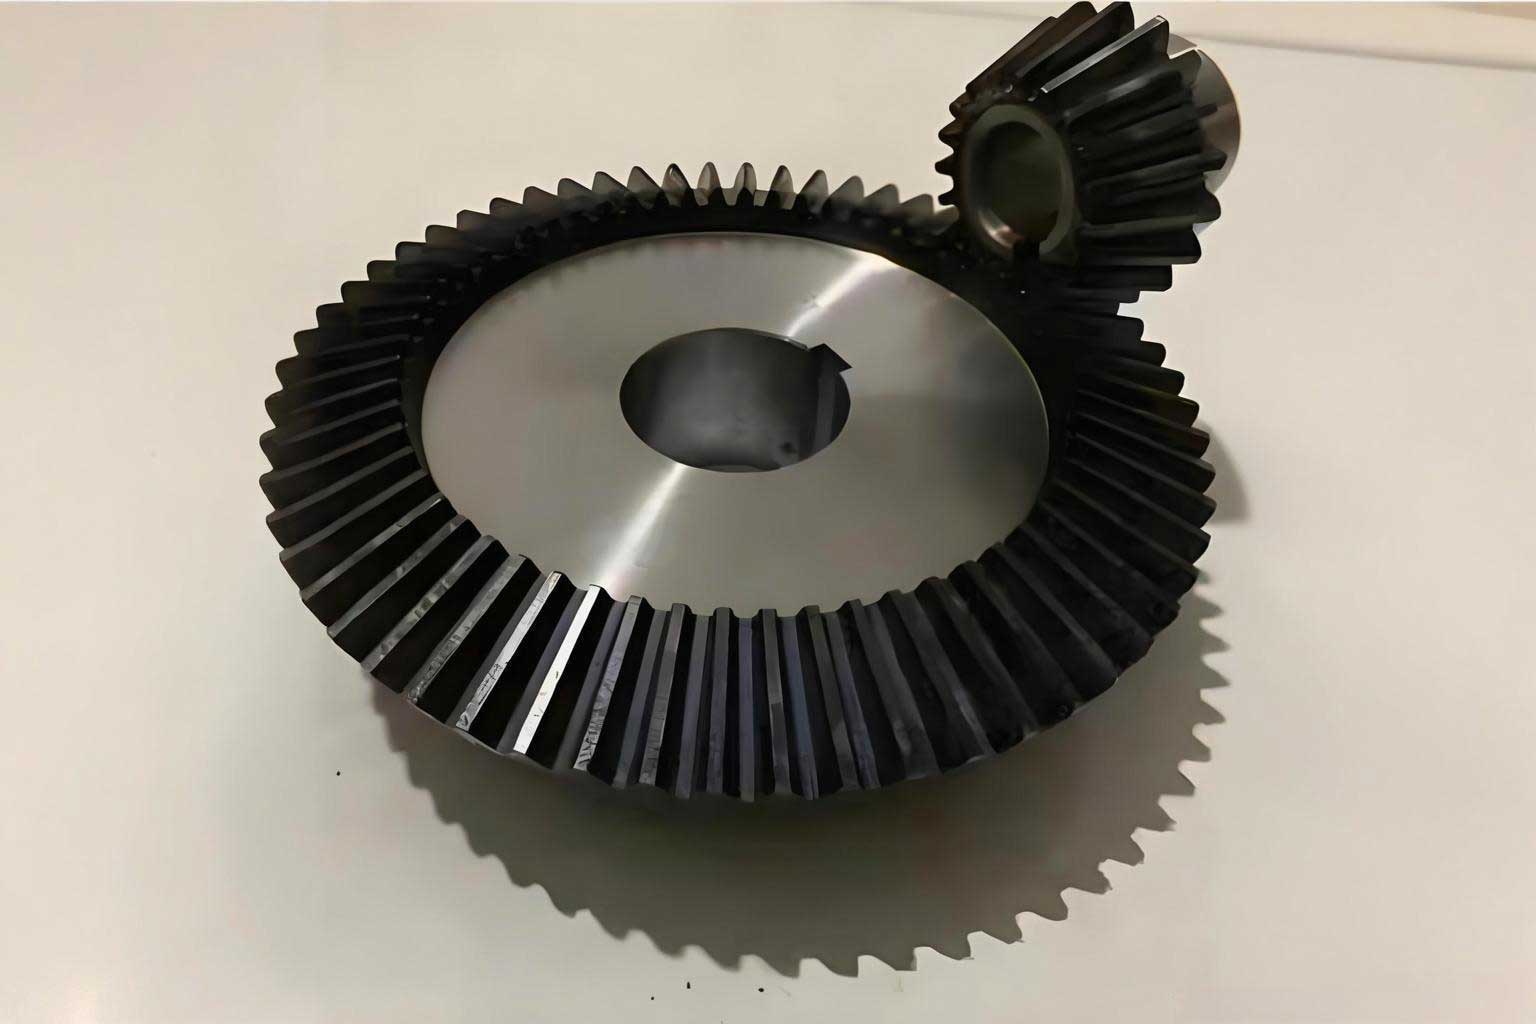
Meshing Characteristics of Miter Gears
Miter gears differ from spur gears because of their helical angle, which causes the contact line to gradually engage from one end to the other. This time-varying contact line length creates significant challenges in analyzing meshing force, friction, and power loss. For a miter gear pair, the contact line length changes with the rotation angle. When the transverse contact ratio \(\varepsilon_\alpha\) is greater than the axial contact ratio \(\varepsilon_\beta\), the contact line length \(L\) for the \(i\)-th pair of teeth can be expressed as:
$$L = \begin{cases}
0, & 0 < s < \varepsilon_\beta P_b \\
\frac{s – \varepsilon_\beta P_b}{\sin\beta}, & \varepsilon_\beta P_b < s < \varepsilon_\alpha P_b \\
\frac{(\varepsilon_\alpha – \varepsilon_\beta)P_b}{\sin\beta}, & \varepsilon_\alpha P_b < s < \varepsilon_\beta P_b + P_b \\
\frac{(\varepsilon_\alpha + \varepsilon_\beta)P_b – s}{\sin\beta}, & \varepsilon_\beta P_b + P_b < s < \varepsilon_\alpha P_b + P_b \\
0, & \varepsilon_\alpha P_b + P_b < s < P_b
\end{cases}$$
When \(\varepsilon_\alpha < \varepsilon_\beta\), the contact line length is given by:
$$L = \begin{cases}
0, & 0 < s < \varepsilon_\alpha P_b \\
\frac{s}{\sin\beta}, & \varepsilon_\alpha P_b < s < \varepsilon_\beta P_b \\
\frac{\varepsilon_\alpha P_b}{\sin\beta}, & \varepsilon_\beta P_b < s < \varepsilon_\alpha P_b + P_b \\
\frac{(\varepsilon_\alpha + \varepsilon_\beta)P_b – s}{\sin\beta}, & \varepsilon_\alpha P_b + P_b < s < \varepsilon_\beta P_b + P_b \\
0, & \varepsilon_\beta P_b + P_b < s < P_b
\end{cases}$$
For a miter gear pair with \(N\) simultaneous contact lines, the total contact line length is \(L_{\text{total}} = 2\sum_{i=1}^{N} L_i\). The curvature radii at any point \(K\) on the contact line are calculated as:
$$R_{1K} = R_{t1} – l\sin\beta, \quad R_{2K} = R_{t2} + l\sin\beta$$
where \(R_{t1}\) and \(R_{t2}\) are the curvature radii at the front end of the contact line. The normal curvature radii are \(R_{1K} = \frac{R_{tK1}}{\cos\beta}\) and \(R_{2K} = \frac{R_{tK2}}{\cos\beta}\). The relative sliding velocity \(v_s\), rolling velocity \(v_r\), slide-to-roll ratio \(SR\), and entrainment velocity \(v_e\) are defined as:
$$v_s = v_{t1} – v_{t2}, \quad v_r = v_{t1} + v_{t2}, \quad SR = \frac{v_s}{v_r}, \quad v_e = \frac{v_{t1} + v_{t2}}{2}$$
These kinematic parameters are essential for evaluating the friction coefficient and power loss in miter gears.
Dynamic Model of Miter Gears Considering Tooth Surface Friction
I established a 16-degree-of-freedom dynamic model for the external meshing pair of a miter gear planetary transmission system using the lumped-mass method. The model comprises a driving gear 1, a driving gear 3, a driven gear 2, and a driven gear 4, representing the left and right helical halves. The generalized displacement vector is:
$$\mathbf{X} = [x_1, y_1, z_1, \theta_1, x_2, y_2, z_2, \theta_2, x_3, y_3, z_3, \theta_3, x_4, y_4, z_4, \theta_4]^T$$
The dynamic equations are derived from Newton’s second law. For the left driving gear (gear 1), the equations in \(x\), \(y\), \(z\), and \(\theta\) directions are:
$$m_1 \ddot{x}_1 + C_{x1} \dot{x}_1 + K_{x1} x_1 = -F_{fL} + F_{xL}$$
$$m_1 \ddot{y}_1 + C_{y1} \dot{y}_1 + K_{y1} y_1 = -F_{yL} + F_{fL} \sin\beta$$
$$m_1 \ddot{z}_1 + C_{z1} \dot{z}_1 + K_{z1} z_1 = -F_{zL}$$
$$J_1 \ddot{\theta}_1 = T_1 – F_{zL} r_1 – M_{fL}$$
Similar equations apply to the other gears, with appropriate subscripts. The meshing force \(F\) is:
$$F = K_m \delta + C_m \dot{\delta}$$
where the relative displacement along the line of action is:
$$\delta_{12} = (x_1 – x_2)\cos\beta + (y_1 – y_2)\sin\beta + r_1\theta_1 – r_2\theta_2 – e_{12}$$
$$\delta_{34} = (x_4 – x_3)\cos\beta + (y_4 – y_3)\sin\beta + r_4\theta_4 – r_3\theta_3 – e_{34}$$
The friction force \(F_f = \mu F \sigma\), where \(\mu\) is the friction coefficient and \(\sigma\) is the direction coefficient. To eliminate rigid-body displacement, I introduce relative coordinates:
$$u_{12} = r_1\theta_1 + r_2\theta_2, \quad u_{34} = r_3\theta_3 + r_4\theta_4, \quad u_{13} = r_1\theta_1 – r_3\theta_3, \quad u_{24} = r_2\theta_2 – r_4\theta_4$$
After non-dimensionalization with time scale \(\tau = \omega_n t\), displacement scale \(b_c = 10^{-5} \mu m\), and equivalent mass \(m_e = \frac{I_1 I_2}{I_1 r_2^2 + I_2 r_1^2}\), the system reduces to:
$$\mathbf{M}\ddot{\mathbf{p}} + \mathbf{C}\dot{\mathbf{p}} + \mathbf{K}\mathbf{p} = \mathbf{F}$$
where \(\mathbf{p}\) is the new displacement vector. The damping matrix \(\mathbf{C}\) is assumed to be Rayleigh damping: \(\mathbf{C} = \alpha \mathbf{M} + \beta \mathbf{K}\), with \(\alpha = 1.35 \times 10^{-6}\) and \(\beta = 0.05\). The equations are solved numerically using the ode45 function in MATLAB, which implements the fourth-fifth order Runge-Kutta method. This yields the dynamic meshing force and displacement responses.
Mixed Lubrication Friction Coefficient Model
In real miter gear contacts, the surfaces are not perfectly smooth; thus, a mixed lubrication friction coefficient model is necessary. I adopt a weighted combination of boundary lubrication friction coefficient \(\mu_{DC}\) and elastohydrodynamic lubrication (EHL) friction coefficient \(\mu_{FL}\):
$$\mu_{ML} = f_\lambda \mu_{FL} + (1 – f_\lambda) \mu_{DC}$$
The weighting function \(f_\lambda\) is given by:
$$f_\lambda = 0.84 \lambda^{0.23}$$
where \(\lambda\) is the film thickness ratio, defined as:
$$\lambda = \frac{h_{\min}}{\sqrt{Ra_1^2 + Ra_2^2}}$$
Here, \(h_{\min}\) is the minimum oil film thickness, and \(Ra_1\), \(Ra_2\) are the surface roughness values. The boundary friction coefficient for steel alloys is taken as \(\mu_{DC} = 0.227\). The EHL friction coefficient is calculated using the well-known formula:
$$\mu_{FL} = 10^{b_1} \cdot \left[ \lg(\nu_0) \right]^{b_2} \cdot \left[ \lg(SR) \right]^{b_3} \cdot \left[ \lg(v_e) \right]^{b_4} \cdot \left[ \lg(P_h) \right]^{b_5} \cdot \left[ \lg(R) \right]^{b_6} \cdot \left[ \lg(Ra) \right]^{b_7} \cdot \left[ \lg(\eta) \right]^{b_8} \cdot \left[ \lg(V_s) \right]^{b_9}$$
The coefficients \(b_1\) to \(b_9\) are listed in Table 1.
| Coefficient | Value |
|---|---|
| \(b_1\) | -8.916 |
| \(b_2\) | 1.033 |
| \(b_3\) | 1.036 |
| \(b_4\) | -0.354 |
| \(b_5\) | 2.812 |
| \(b_6\) | -0.100 |
| \(b_7\) | 0.752 |
| \(b_8\) | -0.390 |
| \(b_9\) | 0.620 |
Here, \(\nu_0\) is the dynamic viscosity of the lubricant in cps, \(Ra\) is the root-mean-square surface roughness in \(\mu m\), \(R\) is the equivalent curvature radius in m, \(P_h\) is the maximum Hertzian contact stress, \(v_e\) is the entrainment velocity, and \(V_s\) is the relative sliding velocity. The Hertzian contact stress is computed as:
$$P_h = \frac{2q}{\pi} \sqrt{\frac{E’}{R}}, \quad \frac{1}{E’} = \frac{1-\mu_1^2}{E_1} + \frac{1-\mu_2^2}{E_2}$$
where \(q\) is the unit normal load, and \(E’\) is the equivalent elastic modulus. The lubricant is ISO VG 32 mineral oil, with a kinematic viscosity of 30 mm²/s at 40°C and 5.2 mm²/s at 100°C. The dynamic viscosity at 40°C is 26.31 mPa·s, and at 100°C it is 4.56 mPa·s. The input power is 4000 kW, the driving gear speed is 7463 r/min, and the driven gear speed is 7640 r/min. These conditions are used throughout the simulations for miter gears.
Friction Force, Power Loss, and Efficiency Calculation
The dynamic meshing force \(F(t)\) obtained from the dynamic model is divided by the time-varying contact line length \(L(t)\) to yield the unit normal load:
$$q(t) = \frac{F(t)}{L(t)}$$
The friction force \(F_f\) is obtained by integrating the local friction along the contact line:
$$F_f = \sum_{n=1}^{m} \int_{l_a}^{l_b} \mu(t,q,x) q(t,x) \sigma(x) \, ds$$
The instantaneous power loss \(P_f(t)\) for the \(i\)-th meshing tooth pair is computed by integrating the product of friction force and sliding velocity along the contact line:
$$P_f(t) = \sum_{n=1}^{m} \int_{l} \mu(t,q,x) q(t,x) v_s(x) \, ds = \sum_{n=1}^{m} \int_{l} \mu(t,q,x) q(t,x) x \omega \sin\beta \, ds$$
The average power loss is obtained by integrating over one meshing period \(T_m\):
$$\overline{P_f} = \frac{1}{T_m} \int_{t_1}^{t_1+T_m} P_f(t) \, dt$$
The meshing efficiency of the miter gear pair is then:
$$\eta = 1 – \frac{\overline{P_f}}{P_{\text{input}}}$$
For the baseline case without modification, the power loss is 7.7086 kW, corresponding to a meshing efficiency of 99.614%.
Extraction of Real Surface Topography for Miter Gears
I used an OLYMPUS OLS4000 laser confocal microscope to extract the real 3D surface topography of miter gear teeth. The microscope provides high-resolution measurements with a magnification range of 108x to 17280x. Three grades of miter gears were selected: grade 5, grade 6, and grade 7. For each grade, one tooth surface was measured at nine points uniformly distributed along three contact lines (a, b, and c). The helical angle is 26.969°. The surface roughness values at each measurement point are listed in Table 2.
| Grade | Point 1 | Point 2 | Point 3 | Point 4 | Point 5 | Point 6 | Point 7 | Point 8 | Point 9 |
|---|---|---|---|---|---|---|---|---|---|
| 5 | 0.487 | 0.535 | 0.388 | 0.321 | 0.307 | 0.38 | 0.282 | 0.434 | 0.37 |
| 6 | 0.485 | 0.773 | 0.667 | 0.997 | 0.797 | 0.731 | 0.667 | 1.205 | 1.461 |
| 7 | 1.136 | 1.244 | 0.932 | 1.105 | 0.454 | 0.327 | 0.487 | 0.683 | 2.109 |
The theoretical roughness values according to gear accuracy standards are 0.4 \(\mu m\) for grade 5, 0.8 \(\mu m\) for grade 6, and 1.6 \(\mu m\) for grade 7. The measured values show considerable scatter, which affects the local lubrication state. The minimum oil film thickness, film thickness ratio, and oil film load-carrying ratio are computed using the measured roughness values. The film thickness ratio \(\lambda\) is defined earlier, and the oil film load-carrying ratio \(\gamma\) is given by:
$$\gamma = \frac{0.37}{1 + 1.21 \lambda^{0.61}} \cdot \lambda^{1.26}$$
For the miter gears, the lubrication regimes are classified as boundary lubrication (\(\lambda \leq 1\)), mixed lubrication (\(1 < \lambda \leq 3\)), and full EHL (\(\lambda > 3\)).
Effect of Microscopic Morphology on Film Thickness Ratio and Load Sharing
I analyzed the film thickness ratio along the tooth profile for grades 5, 6, and 7 miter gears at input speeds of 4500, 5500, 6500, and 7463 r/min. The results show that the film thickness ratio increases with rotational speed, indicating better lubrication at higher speeds. Along the tooth profile, the film thickness ratio increases from the root to the pitch point and then decreases towards the tip, with the maximum near the pitch point. This is because the equivalent curvature radius is largest at the pitch point, leading to a thicker oil film.
When the real microscopic morphology is considered, the film thickness ratio deviates from the theoretical smooth-surface value. For grade 5 miter gears, the film thickness ratio remains between 1 and 3 for speeds above 4500 r/min, indicating mixed lubrication. For grade 6 miter gears, the film thickness ratio is below 1 for speeds below 7463 r/min, indicating boundary lubrication, but improves near the recess point at higher speeds. For grade 7 miter gears, the theoretical film thickness ratio is below 1, but the measured roughness is lower than the theoretical value, so the actual film thickness ratio is higher, leading to improved lubrication. In general, the real topography causes significant fluctuations in the film thickness ratio, and the effect is more pronounced for rougher surfaces.
The weighting coefficient \(f_\lambda\) and oil film load-carrying ratio \(\gamma\) are directly affected by the film thickness ratio. For grade 5 miter gears, the oil film load-carrying ratio exhibits an arch shape, with higher values at the engage and disengage points and lower values at the pitch point. When the microscopic morphology is considered, local variations occur depending on the actual roughness. For grade 6 miter gears, the load-carrying ratio increases with speed and reaches a maximum at the pitch point. For grade 7 miter gears, the load-carrying ratio is generally higher when real topography is used because the actual roughness is smaller than the theoretical value, resulting in better lubrication.
Effect of Microscopic Morphology on Power Loss
The power loss of miter gears is strongly influenced by the lubrication state. I computed the instantaneous power loss along the tooth profile for different grades and speeds. The results show that power loss is highest near the engage and disengage points and lowest near the pitch point. This is because the oil film thickness is largest at the pitch point, reducing friction and power loss. As the rotational speed increases, the power loss decreases for the same meshing position. Higher gear accuracy (lower roughness) also reduces power loss. When the real microscopic morphology is considered, the power loss varies locally, and the fluctuation amplitude depends on the actual surface roughness. For grade 5 miter gears, the power loss curve is parabolic with a minimum at the pitch point. For grade 6 and 7 miter gears, similar trends are observed, but the absolute values are higher due to rougher surfaces.
Tooth Surface Modification Optimization Using Genetic Algorithm
To further improve the meshing performance of miter gears, I performed a comprehensive tooth surface modification using a genetic algorithm in Romax Designer. The objectives were to minimize transmission error, Hertzian contact stress, and local power loss, while achieving uniform load distribution along the contact line. The design variables are the tooth lead slope, lead crown, involute slope, and involute crown for both the driving and driven gears. The ranges for the driving gear are: lead slope 0–20 \(\mu m\), lead crown 0–40 \(\mu m\), involute slope -40–40 \(\mu m\), and involute crown 0–40 \(\mu m\). For the driven gear, the lead slope range is -40–0 \(\mu m\), and the other ranges are the same. The genetic algorithm parameters are: 20 generations, crossover probability 0.2, mutation probability 0.3, and population size 50.
After 1000 candidate evaluations, the optimal modification parameters for the driving gear are: lead crown 0.50702 \(\mu m\), lead slope 19.30 \(\mu m\), involute crown 16.86 \(\mu m\), and involute slope -20.88 \(\mu m\). For the driven gear, the optimal parameters are: lead crown 2.83 \(\mu m\), lead slope 2.35 \(\mu m\), involute crown 20.92 \(\mu m\), and involute slope -9 \(\mu m\). These modifications are applied to the right tooth flanks of the miter gears.
The optimized transmission error for the driving gear is reduced to 0.86 \(\mu m\), compared to 2.6568 \(\mu m\) before modification, a reduction of 1.7968 \(\mu m\). The maximum Hertzian contact stress is reduced to 1097 MPa, a decrease of 2.1%. The maximum unit normal load is reduced to 644 N/mm, a decrease of 3.6%. The power loss is reduced to 5.758 kW, and the meshing efficiency increases to 99.702%, an improvement of 0.1%. Moreover, the load distribution along the contact line becomes more uniform, and the stress concentration at one end of the miter gear is significantly alleviated.
| Parameter | Before Modification | After Modification | Improvement |
|---|---|---|---|
| Transmission error (\(\mu m\)) | 2.6568 | 0.86 | 67.6% reduction |
| Max Hertzian stress (MPa) | 1120 | 1097 | 2.1% reduction |
| Max unit normal load (N/mm) | 668 | 644 | 3.6% reduction |
| Power loss (kW) | 7.7086 | 5.758 | 25.3% reduction |
| Meshing efficiency (%) | 99.614 | 99.702 | 0.1% increase |
Discussion
The results demonstrate that the microscopic morphology of miter gear teeth plays a critical role in determining the lubrication regime and power loss. For high-precision miter gears (grade 5), the lubrication is generally in the mixed regime, and the real topography can either improve or deteriorate local lubrication depending on the local roughness. For lower-precision miter gears (grade 7), the theoretical smooth-surface analysis predicts boundary lubrication, but the actual measured roughness is often lower than the theoretical value, leading to better-than-expected lubrication. This highlights the importance of using real surface topography in efficiency calculations for miter gears.
The dynamic model with 16 degrees of freedom successfully captures the coupling between the left and right helical halves of the miter gears. The friction force and power loss are strongly dependent on the slide-to-roll ratio, Hertzian contact stress, and normal load. The mixed lubrication friction coefficient model provides a more realistic prediction than the pure EHL model, especially when the film thickness ratio is low. The genetic algorithm optimization effectively reduces transmission error and improves load distribution, confirming that tooth surface modification is a powerful tool for enhancing the performance of miter gears.
In summary, I have established a comprehensive framework for analyzing and optimizing the meshing efficiency of miter gears considering microscopic morphology. The framework includes dynamic modeling, mixed lubrication friction, real topography extraction, and genetic algorithm-based modification. The findings provide valuable insights for the design of high-performance miter gears in aerospace and other demanding applications.
Conclusion
In this work, I investigated the meshing efficiency and tooth surface optimization of miter gears considering microscopic morphology. The main conclusions are:
1. A 16-degree-of-freedom dynamic model of a miter gear pair considering tooth surface friction was developed. The model was solved using the Runge-Kutta method, yielding dynamic meshing forces and power losses.
2. A mixed lubrication friction coefficient model combining boundary and EHL friction was adopted. The model accounts for real surface roughness through the film thickness ratio and weighting function.
3. Real 3D surface topographies of grade 5, 6, and 7 miter gears were extracted using a laser confocal microscope. The measured roughness values deviate from theoretical values, significantly affecting the film thickness ratio and oil film load-carrying ratio.
4. The film thickness ratio and oil film load-carrying ratio increase with rotational speed and reach a maximum near the pitch point. Real topography causes local fluctuations, with rougher surfaces showing greater variation.
5. Power loss is highest near the engage and disengage points and lowest near the pitch point. Higher speeds and higher gear accuracy reduce power loss.
6. Genetic algorithm-based tooth surface modification reduced transmission error by 1.7968 \(\mu m\), maximum Hertzian stress by 2.1%, and maximum unit normal load by 3.6%. The meshing efficiency increased by 0.1%, and load distribution became more uniform.
Future work could extend the dynamic model to include the entire planetary gear train and investigate the influence of microscopic morphology on system-level dynamics. Experimental validation of the transmission efficiency with real miter gears under various operating conditions would also be valuable.
Nomenclature
| Symbol | Description |
|---|---|
| \(\beta\) | Helical angle |
| \(\varepsilon_\alpha\) | Transverse contact ratio |
| \(\varepsilon_\beta\) | Axial contact ratio |
| \(P_b\) | Base pitch |
| \(L\) | Contact line length |
| \(R_{1K}, R_{2K}\) | Curvature radii at point K |
| \(v_s\) | Sliding velocity |
| \(v_r\) | Rolling velocity |
| \(SR\) | Slide-to-roll ratio |
| \(v_e\) | Entrainment velocity |
| \(\mu_{ML}\) | Mixed lubrication friction coefficient |
| \(\mu_{FL}\) | EHL friction coefficient |
| \(\mu_{DC}\) | Boundary friction coefficient |
| \(f_\lambda\) | Weighting function |
| \(\lambda\) | Film thickness ratio |
| \(h_{\min}\) | Minimum oil film thickness |
| \(Ra\) | Surface roughness |
| \(P_h\) | Hertzian contact stress |
| \(q\) | Unit normal load |
| \(\gamma\) | Oil film load-carrying ratio |
| \(P_f\) | Power loss |
| \(\eta\) | Meshing efficiency |