
I begin with the single-tooth meshing interval because a large-module rack and pinion gear system does not share load uniformly throughout its entire working cycle. In many heavy-lifting applications, a rack and pinion gear pair passes through a repeating sequence of multi-tooth contact, single-tooth contact, and again multi-tooth contact. During the single-tooth interval, the entire transmitted load is carried by one tooth pair, so the local contact stress, root bending stress, and mesh stiffness become more severe than those in the multi-tooth interval. My objective is therefore to quantify the single-tooth strength and stiffness behavior of a large-module rack and pinion gear transmission under several representative operating conditions, and then to validate the theoretical and numerical predictions with a dedicated experimental bench.
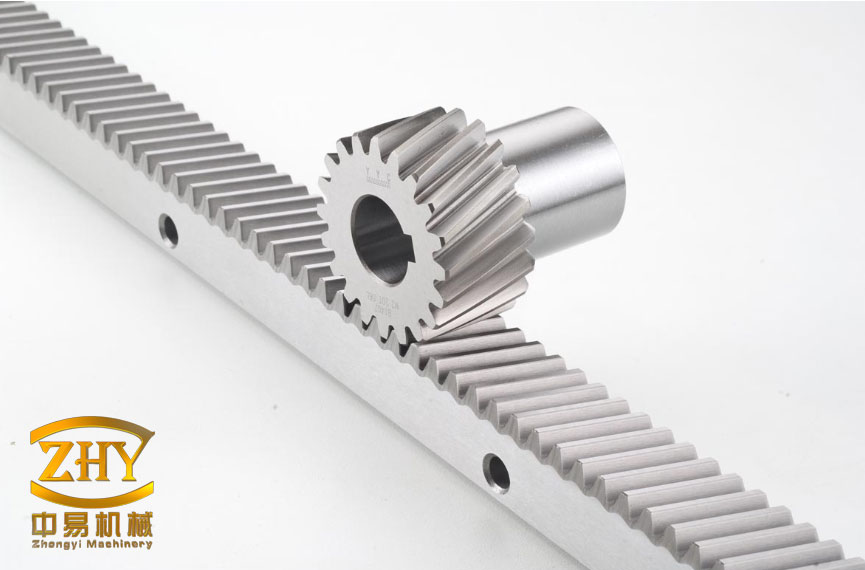
The rack and pinion gear drive used in heavy ship-lift and offshore lifting machinery has several distinctive features. It must carry very large loads, operate at low speed, tolerate misalignment and environmental variation, and maintain stable braking and positioning. These requirements make the rack and pinion gear contact and root strength a central design concern. In my study, I treat the rack and pinion gear pair as a fundamental load-transfer element and focus on the single-tooth portion of the meshing cycle. I use a scaled experimental rack and pinion gear bench, theoretical formulas, finite element analysis, and strain measurements to examine the same physical phenomena from three complementary directions.
Experimental Bench and Rack and Pinion Gear Parameters
I built a vertical rack and pinion gear hoisting-mechanism test bench to reproduce representative loading states of a large rack and pinion gear drive. The bench contains two rack and pinion gear transmission chains mounted on a simulated lifting platform. Each chain is driven by a motor, a speed and torque meter, and a bevel planetary reducer. To keep the platform level during lifting and lowering, I control the motor parameters through a programmable logic controller and also connect the two transmission chains rigidly through a bevel gear shaft. A hydraulic loading device is placed at the center of the platform, and a pressure sensor measures the real-time force in the hydraulic system. Motor speed, rotation direction, hydraulic cylinder stroke direction, and pressure can all be adjusted from the same control cabinet. The rack support columns are strengthened by triangular truss structures, and the tops of the columns are connected by box beams to improve the overall structural stiffness and stability of the rack and pinion gear bench.
The rack and pinion gear geometry is summarized below. The values in parentheses correspond to a full-scale reference machine, while the values outside the parentheses are those of my scaled test bench. The rack and pinion gear contact and bending behavior are strongly influenced by module, face width, pitch diameter, pressure angle, and the center distance to the rack datum line.
| Parameter | Value |
|---|---|
| Module m (mm) | 18 (62.667) |
| Number of gear teeth Z1 | 17 (16) |
| Pitch diameter d1 (mm) | 306 (1002.672) |
| Pressure angle alpha (degrees) | 20 |
| Gear face width b1 (mm) | 100 (610) |
| Rack face width b2 (mm) | 150 |
| Rack height H (mm) | 80 |
| Addendum coefficient ha* | 1 |
| Clearance coefficient c* | 0.25 |
| Center-to-rack-datum distance L (mm) | 153 |
The rack and pinion gear pair in my bench is made from the same material, so the elastic modulus, Poisson ratio, density, ultimate strength, yield strength, and hardness are identical for the gear and the rack. The material properties used in the theoretical model and finite element model are listed below.
| Parameter | Value |
|---|---|
| Elastic modulus E (N/mm2) | 2.11 x 10^5 |
| Poisson ratio mu | 0.29 |
| Density rho (g/mm3) | 7.85 x 10^-3 |
| Ultimate strength sigma_b (MPa) | 710 |
| Yield strength sigma_s (MPa) | 510 |
| Hardness | 280 HB |
Theoretical Strength of the Rack and Pinion Gear Tooth
For the bending strength of the rack and pinion gear tooth, I use the standard root bending stress formulation. The dangerous section is determined by the 30-degree tangent method, and the tooth is treated as a cantilever-like body loaded near the flank. The bending stress at the root of the rack and pinion gear tooth can be written as
$$ \sigma_F = \frac{K_F F’_n Y_{Fa} Y_{Sa} Y_\varepsilon}{b_1 m} $$
where K_F is the load factor, F’_n is the equivalent force applied to the gear in the bending-strength calculation, Y_Fa is the tooth form factor, Y_Sa is the stress correction factor when the load acts at the tooth tip, Y_epsilon is the contact ratio factor, b1 is the gear face width, and m is the module. In my calculation, I use K_F = 1.95, Y_Fa = 2.22, and Y_Sa = 1.53. The contact ratio factor is computed from the contact ratio as
$$ Y_\varepsilon = 0.25 + \frac{0.75}{\varepsilon_\alpha} = 0.679 $$
with the contact ratio of the rack and pinion gear pair given by
$$ \varepsilon_\alpha = 1.7478 $$
Because the full-scale rack and pinion gear has a much larger module and face width than my test bench, I use a scaling concept to reproduce comparable stress levels. For the bending stress, when the product b1 m is reduced by a factor a, the load applied to the bench should also be reduced by the same factor so that the stress remains comparable. Therefore, the bending load applied to the experimental rack and pinion gear is
$$ F’_n = \frac{F_n}{a} = \frac{F_n}{6.1 \times 3.4815} = 0.047 F_n $$
where F_n is the load on the full-scale rack and pinion gear. Substituting this scaled load into the bending stress formula gives the bending stress of the experimental rack and pinion gear under equivalent conditions:
$$ \sigma_F = \frac{K_F F’_n Y_{Fa} Y_{Sa} Y_\varepsilon}{b_1 m} $$
For contact strength, I use a Hertz-type contact stress model modified for a rack and pinion gear pair. The contact stress is
$$ \sigma_H = Z_E Z_H Z_\varepsilon \sqrt{\frac{v+1}{v}\frac{K_H F”_n}{b_1 d_1}} $$
where Z_E is the elastic coefficient, Z_H is the node region coefficient, Z_epsilon is the contact ratio coefficient, v is the gear-to-rack ratio, K_H is the contact load factor, F”_n is the equivalent contact load, and d1 is the pitch diameter of the gear. Since the rack and pinion gear transmission has a rack, the ratio v tends to infinity, and the expression simplifies accordingly. I use K_H = 1.28 in the contact calculation.
The elastic coefficient is calculated from the elastic properties of the rack and pinion gear materials:
$$ Z_E = \sqrt{\frac{1}{\pi \left(\frac{1-\mu_1^2}{E_1}+\frac{1-\mu_2^2}{E_2}\right)}} = 191.482 $$
Because the gear and rack are made of the same material, mu1 = mu2 = mu and E1 = E2 = E. The node region coefficient is
$$ Z_H = \frac{1}{\sqrt{\sin\alpha \cos\alpha}} = 1.764 $$
and the contact ratio coefficient is
$$ Z_\varepsilon = \sqrt{\frac{4-\varepsilon_\alpha}{3}} = 0.86645 $$
The torque acting on the gear is related to the contact force by
$$ T_1 = F”_n \frac{d_1}{2} $$
To obtain contact stress levels comparable to the full-scale rack and pinion gear, I scale the contact load according to the product b1 d1. When b1 d1 is reduced by a factor u, the applied load should be reduced by the same factor. Thus the contact load on the experimental rack and pinion gear is
$$ F”_n = \frac{F_n}{u} = \frac{F_n}{6.1 \times 3.28} = 0.05 F_n $$
I examine six representative operating conditions. These conditions differ in misload depth, wind direction, acceleration or deceleration state, and lifting or lowering direction. The full-scale loads and the corresponding scaled bending and contact loads applied to the rack and pinion gear test bench are listed below. In the sign convention, positive values indicate that the upper tooth flank is loaded during ascent or that the lower tooth flank is loaded during descent; negative values indicate the opposite flank loading direction.
| Condition | Operating state | Full-scale load Fn (kN) | Bench bending load F’n (kN) | Bench contact load F”n (kN) |
|---|---|---|---|---|
| 1 | -10 cm misload, headwind, accelerated ascent | 396 | 18.65 | 19.81 |
| 2 | +10 cm misload, headwind, constant-speed descent | -583 | -27.45 | -29.16 |
| 3 | -5 cm misload, tailwind, constant-speed ascent | -770 | -36.25 | -38.52 |
| 4 | +5 cm misload, headwind, accelerated descent | 957 | 45.06 | 47.87 |
| 5 | +5 cm misload, tailwind, decelerated ascent | -1207 | -56.83 | -60.38 |
| 6 | -5 cm misload, tailwind, decelerated descent | 1362 | 64.13 | 68.14 |
Single-Tooth Stiffness Model for the Rack and Pinion Gear
Stiffness describes the ability of the rack and pinion gear tooth to resist deformation under load. I define the mesh stiffness as the ratio of the normal contact force to the total deformation along the line of action:
$$ k = \frac{F”_n}{\delta} $$
For a single rack and pinion gear tooth, the total deformation can be decomposed into Hertz contact deformation, bending deformation, shear deformation, axial compression deformation, and gear-body foundation deformation. Correspondingly, the total stiffness is a series combination of Hertz contact stiffness, bending stiffness, shear stiffness, axial compression stiffness, and foundation stiffness:
$$ \frac{1}{k_t} = \frac{1}{k_h} + \frac{1}{k_b} + \frac{1}{k_s} + \frac{1}{k_a} + \frac{1}{k_f} $$
The energy stored in the single-tooth rack and pinion gear contact can be expressed as
$$ U_t = \frac{F”_n{}^2}{2k_t} = U_h + U_b + U_s + U_a + U_f $$
and therefore
$$ U_t = \frac{F”_n{}^2}{2}\left(\frac{1}{k_h} + \frac{1}{k_b} + \frac{1}{k_s} + \frac{1}{k_a} + \frac{1}{k_f}\right) $$
The Hertz contact stiffness of the rack and pinion gear pair is treated as constant during the single-tooth engagement interval:
$$ k_h = \frac{\pi E b_1}{4(1-\mu^2)} $$
To compute the tooth-body flexibility, I model a single tooth as a variable cross-section cantilever beam fixed at the root circle. I set the tooth central axis as the X-axis and the line perpendicular to the X-axis at the root as the Y-axis. The normal force on the rack and pinion gear tooth is decomposed into axial and transverse components:
$$ F_X = F”_n \sin\alpha_1 $$
$$ F_Y = F”_n \cos\alpha_1 $$
When these forces are translated to the X-axis, they generate an additional bending moment:
$$ M = F_Y h – F_X d $$
The distance from the meshing point to the Y-axis is
$$ d = r_b\left[(\alpha_1+\theta_f)\sin\alpha_1 + \cos\alpha_1 – \cos\theta_f\right] $$
and the vertical distance from the meshing point to the tooth central axis is
$$ h = r_b\left[(\alpha_1+\theta_f)\cos\alpha_1 – \sin\alpha_1\right] $$
The half-angle of the root circle is
$$ \theta_f = \frac{2\pi}{2Z_1} = 10.588^\circ $$
The bending stiffness contribution of the single rack and pinion gear tooth is obtained by integrating the strain energy along the tooth profile:
$$ \frac{1}{k_b} = \int_{\theta_f-\alpha_1}^{\theta_f} \frac{3\left\{1+\cos\alpha_1\left[(\theta_f-\alpha)\sin\alpha-\cos\alpha\right]\right\}^2(\theta_f-\alpha)\cos\alpha}{2Eb_1\left[\sin\alpha+(\theta_f-\alpha)\cos\alpha\right]} d\alpha $$
The shear stiffness contribution is
$$ \frac{1}{k_s} = \int_{\theta_f-\alpha_1}^{\theta_f} \frac{1.2(1+\mu)(\theta_f-\alpha)\cos\alpha \cos^2\alpha_1}{Eb_1\left[\sin\alpha+(\theta_f-\alpha)\cos\alpha\right]} d\alpha $$
The axial compression stiffness contribution is
$$ \frac{1}{k_a} = \int_{\theta_f-\alpha_1}^{\theta_f} \frac{(\theta_f-\alpha)\cos\alpha \sin^2\alpha_1}{2Eb_1\left[\sin\alpha+(\theta_f-\alpha)\cos\alpha\right]} d\alpha $$
The foundation stiffness due to gear-body deformation is
$$ k_f = \frac{F”_n}{\delta_f} $$
where the foundation deformation is
$$ \delta_f = \frac{F”_n \cos^2\alpha_1}{b_1 E}\left[L^*\left(\frac{u_f}{S_f}\right)^2 + M^*\left(\frac{u_f}{S_f}\right) + P^*(1+Q^*\tan\alpha_1)\right] $$
The root arc length is
$$ S_f = 2\theta_f r_f = 48.23\ \mathrm{mm} $$
with root radius r_f = 130.5 mm. The distance from the meshing point to the root arc along the tooth centerline is
$$ u_f = \frac{r_b}{\cos\alpha_1} – r_f $$
The base radius is
$$ r_b = \frac{mZ_1}{\cos\alpha} $$
The dimensionless coefficients L*, M*, P*, and Q* are functions of the root angle and the internal-to-root radius ratio. For my rack and pinion gear geometry, the calculated values are listed below.
| Coefficient | Value |
|---|---|
| L* | 6.8826 |
| M* | 1.3699 |
| P* | 3.2166 |
| Q* | 0.3472 |
The single-tooth interval of the rack and pinion gear is determined by the contact ratio. Since epsilon_alpha = 1.7478, the angular width of the single-tooth interval is
$$ \theta = \frac{360^\circ}{Z_1}(2-\varepsilon_\alpha) = 5.34^\circ $$
I divide the single-tooth interval into ten equal parts and compute the stiffness at each meshing position. The critical meshing angle range for the single rack and pinion gear tooth is
$$ \alpha_1 \in [11.27^\circ, 29.767^\circ] $$
This interval is important because the rack and pinion gear tooth experiences its largest share of the total load during this period. The stiffness model therefore provides a position-dependent measure of how the single tooth resists deformation as the contact point moves along the flank.
Finite Element Simulation of the Rack and Pinion Gear
I created a three-dimensional model of the rack and pinion gear pair and assembled it in a CAD environment. The model was then imported into finite element software for static structural analysis. The gear and rack were assigned the same material properties. I used a global mesh size of 10 mm and refined the contact region with a local mesh size of 5 mm. The resulting finite element model contained 50,264 elements and 10,732 nodes. A revolute joint was applied to the inner cylindrical surface of the gear, and torque was applied at the gear shaft. The bottom of the rack was fixed. This setup allowed me to examine the stress distribution in the single-tooth rack and pinion gear contact region under each operating condition.
The torques applied to the gear shaft for the bending-strength and contact-strength simulations are shown below. The magnitudes correspond to the scaled loads in the previous table.
| Condition | Bending simulation torque (10^6 N mm) | Contact simulation torque (10^6 N mm) |
|---|---|---|
| 1 | 2.68 | 2.85 |
| 2 | -3.94 | -4.19 |
| 3 | -5.20 | -5.54 |
| 4 | 6.46 | 6.88 |
| 5 | -8.15 | -8.68 |
| 6 | 9.20 | 9.80 |
The static analysis results show that the root bending stress of the rack and pinion gear increases as the meshing point moves deeper along the tooth flank. This occurs because the effective bending moment arm at the root becomes larger as the contact point approaches the tip region, while the root section remains fixed. In cantilever terms, a larger moment arm under the same transmitted force produces a larger root stress. Therefore, the maximum bending stress in the single-tooth interval occurs later in the engagement process. The finite element results agree closely with the theoretical bending stress calculated from the standard formula. The differences between the theoretical and simulated bending stresses are 2.40%, 3.82%, 3.92%, 4.00%, 4.01%, and 4.01% for the six conditions.
The contact stress of the rack and pinion gear behaves somewhat differently. Because the rack and pinion gear pair is installed in a standard manner, the contact stress changes abruptly near the beginning of the meshing interval, around a rotation angle of about 1 degree, and then varies more smoothly. The simulated contact stresses are also close to the theoretical values. The differences are 5.37%, 5.32%, 1.28%, 2.39%, 3.73%, and 4.08% for the six conditions. These small differences support the use of the theoretical contact model for preliminary strength assessment of the rack and pinion gear pair.
The comparison between theoretical and simulated stresses is summarized below.
| Condition | Theoretical bending stress (MPa) | Simulated bending stress (MPa) | Bending error (%) | Theoretical contact stress (MPa) | Simulated contact stress (MPa) | Contact error (%) |
|---|---|---|---|---|---|---|
| 1 | 46.50 | 47.64 | 2.40 | 258.15 | 244.28 | 5.37 |
| 2 | 68.46 | 65.84 | 3.82 | 313.22 | 329.91 | 5.32 |
| 3 | 90.42 | 86.87 | 3.92 | 359.97 | 355.37 | 1.28 |
| 4 | 112.38 | 107.88 | 4.00 | 401.31 | 391.70 | 2.39 |
| 5 | 141.74 | 136.05 | 4.01 | 450.68 | 433.88 | 3.73 |
| 6 | 159.94 | 153.53 | 4.01 | 478.74 | 498.29 | 4.08 |
For the rack and pinion gear design, the bending stress results indicate that the root region must be protected against stress concentration. The root fillet should be smoothly rounded, and local geometry changes should be introduced cautiously to avoid sharp transitions. Surface strengthening and appropriate heat treatment can improve the contact fatigue resistance of the rack and pinion gear flanks. Since the contact stress is high under the heavier conditions, surface hardness, residual compressive stress, and lubrication conditions all have a direct influence on pitting, wear, and scuffing behavior.
Stiffness Simulation of the Single Rack and Pinion Gear Tooth
I used static structural analysis to evaluate the single-tooth stiffness of the rack and pinion gear. The inner cylindrical surface of the gear was again constrained by a revolute joint, and the bottom of the rack was fixed. For each meshing position, I applied the corresponding torque and extracted the rotation angle deformation about the gear axis. The mesh stiffness under torque loading can be expressed as
$$ k = \frac{T_1}{r_b^2 \Delta\theta} $$
where T1 is the applied torque, r_b is the base radius of the gear, and Delta theta is the angular deformation at the selected meshing position. In the finite element model, the angular deformation was obtained from the Z-direction displacement of the gear and the pitch radius. The custom result expression used the ratio of the Z displacement to the pitch radius, with the output converted to an angle.
I selected nine equally spaced meshing positions within the single-tooth interval of the rack and pinion gear. At each position, I calculated the angular deformation and then evaluated the stiffness. The finite element results show a clear trend: for every operating condition, the single-tooth stiffness increases as the rotation angle increases. In addition, at the same meshing position, a larger applied load produces a larger stiffness. This trend is consistent with the strength behavior of the rack and pinion gear. The reason is that the early part of the single-tooth interval contains mesh-in impact and vibration, so the local deformation is relatively large. As the contact point moves along the flank and the engagement becomes more stable, the total deformation decreases, and the stiffness rises.
The observed stiffness trend is summarized below. The table expresses the relative direction of change rather than a single absolute value, because the stiffness is position-dependent and condition-dependent.
| Condition | Stiffness trend with rotation angle | Stiffness trend with load magnitude | Consistency with strength trend |
|---|---|---|---|
| 1 | Increases | Increases with load | Consistent |
| 2 | Increases | Increases with load | Consistent |
| 3 | Increases | Increases with load | Consistent |
| 4 | Increases | Increases with load | Consistent |
| 5 | Increases | Increases with load | Consistent |
| 6 | Increases | Increases with load | Consistent |
The stiffness results have practical meaning for the rack and pinion gear drive. A single tooth that is stiffer at a given position will deform less under the same load, which can reduce dynamic transmission error and improve positioning accuracy. However, if the stiffness changes too abruptly between adjacent meshing positions, it can excite vibration. Therefore, profile modification and lead crowning may be used to smooth the transition of the rack and pinion gear mesh stiffness. The combined consideration of strength and stiffness is necessary for reliable operation of a large-module rack and pinion gear system.
Experimental Verification of the Rack and Pinion Gear Strength
I performed static and dynamic tests on the rack and pinion gear bench to verify the theoretical and finite element results. The strain measurement system recorded the root bending stress of the gear under different operating conditions. Because the tooth flanks are in direct contact and squeezing during meshing, attaching strain gauges directly on the contact surface would damage them. Therefore, I measured the root bending stress rather than the contact stress. The strain gauges were oriented along the tooth profile direction so that the measured strain corresponded to the bending stress component calculated in the theoretical model. I placed gauges at two types of locations: the center of the gear root where the finite element analysis predicted the maximum stress, and the edge of the gear root. The center gauge captured the maximum stress value, while the edge gauge helped verify the finite element stress distribution.
The experimental conditions are listed below. Positive and negative signs indicate the direction of the platform movement and the corresponding hydraulic loading state.
| Condition | Operating state | Bench pressure state | Pressure magnitude (10^4 N) |
|---|---|---|---|
| 1 | -10 cm misload, headwind, accelerated ascent | No load plus bench self-weight | 0 + 1.9 |
| 2 | +10 cm misload, headwind, constant-speed descent | Hydraulic cylinder plus bench self-weight | -(0.9 + 1.9) |
| 3 | -5 cm misload, tailwind, constant-speed ascent | Hydraulic cylinder plus bench self-weight | -(1.8 + 1.9) |
| 4 | +5 cm misload, headwind, accelerated descent | Hydraulic cylinder plus bench self-weight | (2.7 + 1.9) |
| 5 | +5 cm misload, tailwind, decelerated ascent | Hydraulic cylinder plus bench self-weight | -(3.6 + 1.9) |
| 6 | -5 cm misload, tailwind, decelerated descent | Hydraulic cylinder plus bench self-weight | (4.5 + 1.9) |
Only one of the two rack and pinion gear transmission chains was instrumented. Therefore, the measured bending stress from one chain was compared with twice the simulated value for a single rack and pinion gear pair, since the two chains share the platform load. The data were recorded over a ten-second interval and averaged to reduce fluctuations caused by wiring noise, hydraulic pressure variation, and dynamic effects. The comparison among theoretical calculation, finite element simulation, and experimental measurement is shown below.
| Condition | Theoretical bending stress (MPa) | Simulated bending stress (MPa) | Experimental bending stress (MPa) | Theoretical-experimental error (%) | Simulation-experimental error (%) |
|---|---|---|---|---|---|
| 1 | 46.50 | 47.64 | 50.02 | 7.57 | 5.00 |
| 2 | 68.46 | 65.84 | 74.48 | 8.79 | 13.12 |
| 3 | 90.42 | 86.87 | 96.76 | 7.01 | 11.38 |
| 4 | 112.38 | 107.88 | 103.38 | 8.01 | 4.17 |
| 5 | 141.74 | 136.05 | 141.68 | 0.04 | 4.14 |
| 6 | 159.94 | 153.53 | 167.56 | 4.76 | 9.14 |
The experimental results are consistent with both the theoretical and finite element predictions. The theoretical-experimental errors for the root bending stress are 7.57%, 8.79%, 7.01%, 8.01%, 0.04%, and 4.76%. The simulation-experimental errors are 5.00%, 13.12%, 11.38%, 4.17%, 4.14%, and 9.14%. Most errors are close to or below 10%. Conditions 2 and 3 show somewhat larger simulation-experimental differences, which may be related to insufficient hydraulic pressure loading time or early stress data acquisition during the experiment. Overall, the measured rack and pinion gear root stresses validate the theoretical model, the finite element model, and the scaling approach. The experiment also provides a useful benchmark for subsequent dynamic simulation and fatigue assessment of the rack and pinion gear pair.
Discussion
The single-tooth interval of a large-module rack and pinion gear is the most critical part of the meshing cycle. My theoretical analysis, finite element simulation, and strain measurement all show that the root bending stress increases as the contact point moves through the single-tooth region. The contact stress is also high, especially under heavy-load conditions. The stiffness simulation shows that the single-tooth stiffness increases with rotation angle and with load magnitude. This means that the rack and pinion gear pair becomes locally more resistant to deformation as the engagement stabilizes, but the early part of the single-tooth interval may experience larger deformation and more pronounced dynamic excitation.
For design improvement, I consider several measures. First, the root fillet of the rack and pinion gear should be optimized to reduce stress concentration. A larger fillet radius, a controlled root relief, or a carefully designed root profile can lower the maximum bending stress. Second, the tooth flank of the rack and pinion gear can be strengthened by carburizing, nitriding, induction hardening, or shot peening, depending on the required hardness depth and residual stress distribution. Third, profile modification and lead crowning can smooth the transition of contact and stiffness, reducing impact at the beginning of the single-tooth interval. Fourth, lubrication and surface finish are important because the contact stress is high and the rack and pinion gear operates under low-speed, heavy-load conditions. A suitable lubricant film can reduce friction, wear, and scuffing risk.
The results also suggest that the strength and stiffness of a rack and pinion gear should not be evaluated separately. Strength indicates resistance to failure, while stiffness indicates resistance to deformation. A rack and pinion gear design that satisfies bending and contact strength requirements may still suffer from excessive deformation, transmission error, or vibration if the mesh stiffness variation is not controlled. Therefore, a comprehensive assessment should combine stress analysis, stiffness analysis, dynamic analysis, and experimental validation.
Conclusions
I studied the single-tooth strength and stiffness of a large-module rack and pinion gear transmission using a scaled experimental bench, theoretical formulas, finite element simulation, and strain measurement. The following conclusions can be drawn from my work.
1. The single-tooth interval of the rack and pinion gear is determined by the contact ratio. For the analyzed rack and pinion gear pair, the contact ratio is 1.7478, and the single-tooth interval is 5.34 degrees. The critical meshing angle range for the single tooth is from 11.27 degrees to 29.767 degrees.
2. The root bending stress of the rack and pinion gear increases as the meshing point moves deeper into the single-tooth interval. The theoretical and simulated bending stresses agree within about 4 percent for all six operating conditions. The contact stress remains relatively stable after an initial abrupt change near the beginning of engagement, and the theoretical and simulated contact stresses agree within about 6 percent.
3. The single-tooth stiffness of the rack and pinion gear increases with rotation angle and with load magnitude. This trend is consistent with the strength variation. The stiffness behavior indicates that the early part of the single-tooth interval is more flexible and more likely to experience impact and vibration, while the later part is stiffer and more stable.
4. The experimental root bending stresses are in good agreement with the theoretical and finite element results. Most errors are around 10 percent or less. The deviations in some conditions are likely caused by hydraulic loading time, data acquisition timing, and experimental uncertainty. The validation confirms that the scaled rack and pinion gear bench can reproduce the essential strength behavior of a large rack and pinion gear transmission.
5. The combined strength and stiffness analysis provides a useful basis for the design, condition monitoring, and dynamic modeling of large-module rack and pinion gear systems. Future work should extend the single-tooth results to the full multi-tooth, single-tooth, and multi-tooth alternating cycle, and should include wear, lubrication, and dynamic load effects in the rack and pinion gear model.