
In my design work, I have focused on a new type of speed hump that does more than force vehicles to slow down. I approached the problem from a first-person engineering perspective: I wanted to create a device that absorbs part of the kinetic energy lost by a passing vehicle, converts that energy into electrical energy, stores it, and also produces useful traffic data. The central mechanical idea I use is a set of rack and pinion gears that transforms the vertical motion of a speed hump into rotary motion for a generator. By combining rack and pinion gears with a speed-multiplying gear train, a rectifier, a battery, and modular sensors, I can make a speed hump that is safer, quieter, more comfortable, and more sustainable than a conventional rigid hump. The same rack and pinion gears also allow the moving deck to return smoothly through a spring-loaded reset cycle. My aim is not only energy recovery but also a complete digital infrastructure node at the road surface.
1. First-Person Design Position
I began with a simple question: why should a speed hump waste the energy of every vehicle that crosses it? A traditional hump converts vehicle kinetic energy into heat, noise, vibration, and mechanical wear. I asked whether I could redesign the hump so that the same event becomes a small power plant. My answer is a modular speed hump in which rack and pinion gears form the core transmission. I use the phrase rack and pinion gears repeatedly because this mechanism is the bridge between the linear input from the vehicle and the rotary input required by an electromagnetic generator. I do not treat the hump as a passive obstacle. I treat it as an energy-harvesting interface.
I also wanted the design to be practical. A speed hump must survive rain, dust, salt, temperature changes, repeated impact, and heavy vehicles. Therefore, I placed the rack and pinion gears, the gear train, the generator, and the energy storage electronics inside a protected box. The moving deck is the only part exposed to tires. The rack and pinion gears are lubricated and sealed. The modular sensor package can be added or removed without changing the mechanical core. In this way, I can adapt the same rack and pinion gears platform to urban roads, campuses, parking lots, industrial sites, and toll zones.
2. Energy Storage Context
Energy storage is becoming a central technology for low-carbon transport and smart cities. I see the speed hump as a distributed energy resource. It is not a replacement for large-scale batteries or pumped hydro, but it can supply local loads such as streetlights, sensors, cameras, warning signs, and emergency communication devices. Because the energy source is vehicle motion, the system also connects directly to traffic behavior. I can measure speed, weight, and flow while harvesting energy. The rack and pinion gears make this dual function possible because they provide a predictable relationship between displacement and rotation.
| Energy Transition Indicator | 2030 Target | 2050 Target | Relevance to My Speed Hump |
|---|---|---|---|
| Total primary energy consumption (standard coal equivalent, 10^8 t) | 60.0 | 55.0 | Lower total demand increases the value of local recovery. |
| Non-fossil share of primary energy (%) | 28.6 | 61.0 | My design supports distributed renewable and recovery-based electricity. |
| Renewable share of primary energy (%) | 23.3 | 47.7 | Vehicle kinetic energy recovery becomes a small but useful complement. |
| Distributed generation need | High | Very high | Roadside energy harvesting can reduce local grid burden. |
The general energy balance I use for the device is:
$$ E_{harvested} = \eta_{system} E_{vehicle,lost} $$
where Evehicle,lost is the portion of vehicle kinetic energy that would otherwise be dissipated by the hump, and ηsystem is the overall efficiency from tire contact to battery storage. I define the instantaneous power as:
$$ P = \tau \omega $$
where τ is torque and ω is angular velocity. The rack and pinion gears convert a linear force and linear velocity into torque and angular velocity, so they are directly involved in this power equation. Without rack and pinion gears, the vertical motion would be difficult to convert efficiently into generator rotation.
3. Conventional Speed Hump Limitations
I examined conventional speed humps from the viewpoint of energy, comfort, safety, and maintenance. A rigid hump creates a sudden vertical displacement. The vehicle suspension responds with a damped oscillation. The tire, wheel, and chassis receive an impact. The driver and passengers feel discomfort. The road surface and the hump itself wear faster. Noise increases. In dense areas, repeated humps can disturb residents. I list the main problems and my design responses in the following table.
| Conventional Issue | Physical Cause | Consequence | My Design Response |
|---|---|---|---|
| Rigid impact | Sudden vertical displacement | Discomfort and component wear | Moving deck and rack and pinion gears absorb motion. |
| Energy waste | Kinetic energy becomes heat and noise | No useful output | Generator and battery recover a fraction of energy. |
| High noise | Tire-suspension impact | Residential disturbance | Smooth guided motion reduces peak acceleration. |
| Poor adaptability | Fixed geometry | No data, no modularity | Modular sensors and rack and pinion gears core. |
| Maintenance difficulty | Exposed materials and non-standard parts | High repair cost | Sealed box, standard components, replaceable modules. |
I do not claim that a speed hump can recover all vehicle energy. I claim that it can recover a useful fraction while improving the vehicle-road interaction. The rack and pinion gears are the key to controlled motion rather than uncontrolled impact.
4. Design Objectives and Metrics
I set measurable objectives before selecting components. I wanted the hump to slow vehicles, reduce peak vertical acceleration, recover energy, store energy, measure speed, estimate weight, count traffic, and remain maintainable. I also wanted the design to use standard parts and standard manufacturing processes. The rack and pinion gears allow me to use standard gear modules and rack lengths. The following table summarizes my objectives and verification methods.
| Objective | Metric | Target | Verification Method |
|---|---|---|---|
| Speed control | Vehicle speed reduction | Meaningful reduction at crossing | Speed sensor and field test |
| Comfort | Peak vertical acceleration | Lower than rigid hump | Accelerometer and simulation |
| Energy recovery | Electrical energy per crossing | Positive net output | Generator power logging |
| Storage | Battery charge per day | Sufficient for local loads | Energy audit |
| Speed measurement | Speed error | Within acceptable range | Calibrated speed test |
| Weight estimation | Weight error with multi-unit fusion | Reduced after speed correction | Known load test |
| Traffic flow | Count and flow rate | Accurate over time windows | Manual and camera comparison |
| Maintainability | Mean time to repair | Low | Module replacement test |
5. Design Concept
My design concept is a speed hump with a moving deck supported by a box. When a tire presses the deck, the deck moves downward. A push rod transfers this motion to a rack. The rack drives a pinion. Together, the rack and pinion gears convert linear motion into rotation. The pinion shaft then enters a speed-multiplying gear train. The gear train rotates a DC generator. The generator output is rectified, conditioned, and stored in a battery. A return spring resets the deck after the vehicle passes. Sensors measure the generator response and the deck displacement. The same rack and pinion gears therefore serve mechanical transmission, energy conversion, and signal generation.
I use the term rack and pinion gears in the plural because the system can use one or more rack-and-pinion pairs. A single central pair may be sufficient for light traffic. A multi-pair layout can distribute load and reduce stress. In a heavy-duty version, I can place rack and pinion gears on both sides of the moving deck. This symmetry reduces twisting and improves durability. The rack and pinion gears also allow a modular design: the rack length, pinion diameter, and gear ratio can be changed without redesigning the entire hump.
6. Overall Structure
The device has an outer box, a moving deck, a push-rod linkage, a rack, a pinion, a speed-increasing gear train, a generator, a rectifier and conditioning circuit, a battery, a return spring, and optional sensors. I place all precision parts inside the box. The box is anchored to the ground. The top surface of the moving deck is the tire contact surface. The rack and pinion gears are sealed and lubricated. The sensor module can include speed, weight, flow, and communication units. The following table lists the main components and their functions.
| Component | Function | Preferred Material or Type | Design Note |
|---|---|---|---|
| Outer box | Protect internal parts | Coated steel or composite | Anchored to road base |
| Moving deck | Receive tire load | Reinforced polymer or metal | Textured top surface |
| Push rod | Transfer vertical motion | Alloy steel | Guided to prevent buckling |
| Rack | Linear gear element | Hardened steel | Part of the rack and pinion gears |
| Pinion | Rotary gear element | Hardened steel | Meshes with rack |
| Gear train | Increase speed | Standard spur or helical gears | Three-stage preferred |
| Generator | Convert rotation to electricity | Permanent-magnet DC generator | Low starting torque |
| Rectifier | Convert AC to DC if needed | Diode bridge | Low voltage drop |
| Battery | Store electrical energy | Li-ion or LiFePO4 | Protected enclosure |
| Return spring | Reset deck | Compression or torsion spring | Preload adjusted |
| Sensors | Measure speed, weight, flow | Magnetic, optical, or strain | Modular |
7. Working Principle
When a vehicle crosses the hump, the tire pushes the moving deck downward. The displacement is:
$$ \Delta y = h_0 – h_1 $$
where h0 is the initial deck height and h1 is the pressed height. The push rod transfers this displacement to the rack. If the pinion radius is rp, the rack displacement x and pinion rotation angle θ are related by:
$$ x = r_p \theta $$
The linear velocity of the rack is:
$$ v_{rack} = r_p \omega_{pinion} $$
Thus, the rack and pinion gears impose a direct kinematic relationship. If the pinion rotates, the rack translates. If the rack translates, the pinion rotates. I use this relationship to convert the vertical motion of the deck into rotation. The pinion shaft drives the speed-increasing gear train. The output angular velocity is:
$$ \omega_{out} = i_{total} \omega_{in} $$
where itotal is the total gear ratio of the speed-increasing train. The generator produces a voltage proportional to its angular velocity:
$$ V = K_e \omega_{gen} $$
The current depends on the generator voltage, the battery voltage, and the internal resistance:
$$ I = \frac{V – V_b}{R_a} $$
The electrical power is:
$$ P_e = V I $$
The energy stored over one crossing is:
$$ E_b = \int_{0}^{T} \eta_c P_e dt $$
where ηc is the charging efficiency and T is the crossing duration. The return spring then pushes the rack back. The rack and pinion gears reverse their motion, the deck returns to its initial height, and the device is ready for the next vehicle.
8. Rack and Pinion Gears
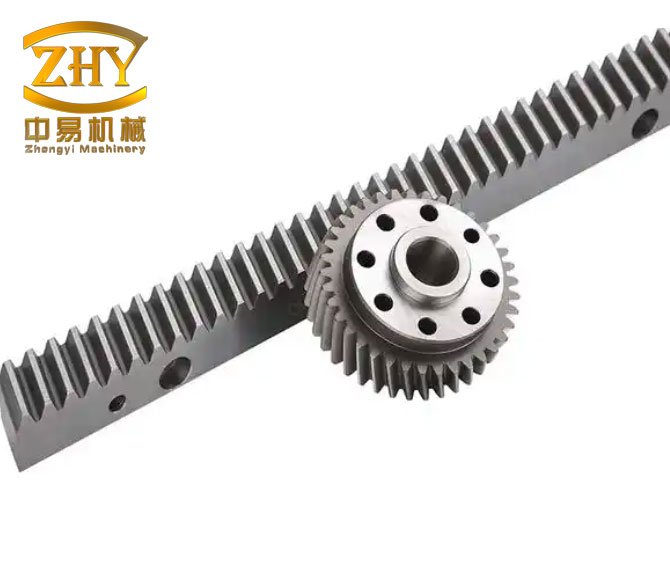
The rack and pinion gears are the most important mechanical interface in my design. I selected this mechanism because it is simple, efficient, robust, and easy to manufacture. A rack is a straight gear with teeth on a flat bar. A pinion is a circular gear. When the rack moves linearly, it rotates the pinion. When the pinion rotates, it moves the rack. This is exactly what I need for a speed hump: vertical deck motion becomes rotation for a generator. I can also use the rack and pinion gears to amplify motion through the choice of pinion radius and gear module. In addition, the rack and pinion gears provide a positive drive without belt slip, which is important in outdoor and dirty environments.
For a standard gear module m, the pitch diameter of the pinion is:
$$ d_p = m z_p $$
where zp is the number of pinion teeth. The pitch radius is:
$$ r_p = \frac{d_p}{2} = \frac{m z_p}{2} $$
The rack travel for one full pinion revolution is:
$$ x_{rev} = 2 \pi r_p = \pi m z_p $$
The gear ratio between the rack and the pinion is often expressed through the equivalent radius. The linear force on the rack and the torque on the pinion are related by:
$$ \tau_p = F_{rack} r_p \eta_{rp} $$
where ηrp is the efficiency of the rack and pinion gears. The linear speed and angular speed are related by:
$$ \omega_p = \frac{v_{rack}}{r_p} $$
I can choose the rack and pinion gears to satisfy both strength and speed requirements. A larger pinion radius produces more torque but lower angular speed. A smaller pinion radius produces higher angular speed but lower torque. The speed-increasing gear train then raises the angular speed to the generator range. The following table shows an example parameter set for the rack and pinion gears.
| Parameter | Symbol | Example Value | Unit |
|---|---|---|---|
| Gear module | m | 2 | mm |
| Pinion teeth | z_p | 20 | – |
| Pitch diameter | d_p | 40 | mm |
| Pitch radius | r_p | 20 | mm |
| Rack length | L_r | 120 | mm |
| Maximum rack travel | x_max | 60 | mm |
| Maximum pinion angle | θ_max | 3 | rad |
| Pressure angle | α | 20 | degrees |
Using the example values, the maximum pinion rotation is:
$$ \theta_{max} = \frac{x_{max}}{r_p} = \frac{60}{20} = 3 \text{ rad} $$
This is about 171.9 degrees. If the vehicle compresses the deck in 0.25 s, the average pinion angular velocity is:
$$ \omega_{p,avg} = \frac{\theta_{max}}{t} = \frac{3}{0.25} = 12 \text{ rad/s} $$
If the speed-increasing gear train has a ratio of 20:1, the generator input is:
$$ \omega_{gen,avg} = 20 \times 12 = 240 \text{ rad/s} $$
This corresponds to about 2292 rpm, which is suitable for a small permanent-magnet generator. The rack and pinion gears therefore make it possible to reach useful generator speeds from a small vertical displacement.
9. Gear Train and Speed Multiplication
The rack and pinion gears usually produce relatively low angular velocity because the deck travel is short. I therefore use a multi-stage gear train. Each stage has a driver gear and a driven gear. The ratio of one stage is:
$$ i_k = \frac{z_{driven,k}}{z_{driver,k}} $$
The total ratio is:
$$ i_{total} = \prod_{k=1}^{n} i_k $$
For a three-stage train:
$$ i_{total} = i_1 i_2 i_3 $$
The output angular velocity is:
$$ \omega_{out} = i_{total} \omega_{in} $$
The output torque is reduced by the ratio and the efficiency:
$$ \tau_{out} = \frac{\tau_{in} \eta_{gear}}{i_{total}} $$
where ηgear is the gear train efficiency. I can choose the number of stages and the teeth counts to match the generator. The following table shows an example three-stage design.
| Stage | Driver Teeth | Driven Teeth | Stage Ratio | Cumulative Ratio |
|---|---|---|---|---|
| 1 | 20 | 40 | 2.0 | 2.0 |
| 2 | 15 | 45 | 3.0 | 6.0 |
| 3 | 12 | 40 | 3.333 | 20.0 |
The total ratio is:
$$ i_{total} = 2.0 \times 3.0 \times 3.333 = 20.0 $$
If the pinion average speed is 12 rad/s, the generator speed is 240 rad/s. If the generator constant is Ke = 0.05 V·s/rad, the open-circuit voltage is:
$$ V_{oc} = K_e \omega_{gen} = 0.05 \times 240 = 12 \text{ V} $$
This is a useful voltage for a 12 V storage system. I can also use a higher ratio for a lower pinion speed or a lower ratio for a higher pinion speed. The rack and pinion gears and the gear train must be designed together. If the rack and pinion gears are too small, the rack force may be high. If the gear train ratio is too high, friction and inertia may reduce efficiency. I therefore optimize the complete chain from tire to battery.
10. Energy Conversion and Storage
The generator converts mechanical rotation into electrical power. I model the generator as a voltage source with internal resistance. The terminal voltage is:
$$ V_t = K_e \omega_{gen} – I R_a $$
The charging current is:
$$ I = \frac{K_e \omega_{gen} – V_b}{R_a} $$
The electrical power delivered to the battery is:
$$ P_b = V_b I $$
The energy stored in one crossing is:
$$ E_{cross} = \int_{0}^{T} P_b dt $$
The battery capacity required for a given number of crossings is:
$$ C_{req} = \frac{N_{cross} E_{cross}}{V_b \text{DoD}} $$
where Ncross is the number of crossings and DoD is the depth of discharge. The following table gives an example energy estimate for different vehicle speeds and masses.
| Vehicle Mass (kg) | Speed (m/s) | Kinetic Energy (J) | Assumed Recovery Fraction (%) | Recovered Energy (J) |
|---|---|---|---|---|
| 1000 | 5 | 12,500 | 8 | 1,000 |
| 1000 | 10 | 50,000 | 8 | 4,000 |
| 1500 | 5 | 18,750 | 8 | 1,500 |
| 1500 | 10 | 75,000 | 8 | 6,000 |
| 2000 | 5 | 25,000 | 8 | 2,000 |
| 2000 | 10 | 100,000 | 8 | 8,000 |
These values are illustrative. The actual recovered energy depends on the hump geometry, suspension behavior, tire pressure, speed, and generator efficiency. The important point is that the rack and pinion gears allow a controlled extraction of energy rather than an uncontrolled impact. The energy can be accumulated over many vehicles. For example, if 1,000 vehicles cross per day and each crossing recovers 1,000 J, the daily energy is:
$$ E_{day} = 1000 \times 1000 = 1,000,000 \text{ J} = 0.278 \text{ kWh} $$
With a higher recovery fraction or heavier traffic, the daily energy can be several kWh. This is enough to power LED streetlights, sensors, cameras, and communication modules. The rack and pinion gears are therefore not a gimmick; they are part of a practical distributed energy system.
11. Vehicle Interaction and Dynamic Model
I model the vehicle as a mass-spring-damper system. The vertical force on the deck includes the spring force, damping force, and inertial force:
$$ F(t) = k_s \Delta y + c_d \frac{d(\Delta y)}{dt} + m_v a_v $$
where ks is the suspension stiffness, cd is the damping coefficient, mv is the vehicle mass, and av is the vertical acceleration. The work done on the deck is:
$$ W = \int F(t) dy $$
The mechanical power delivered to the rack is:
$$ P_{mech} = F_{rack} v_{rack} $$
The rack and pinion gears transfer this power to the pinion:
$$ P_{pinion} = \tau_p \omega_p = \eta_{rp} F_{rack} v_{rack} $$
The gear train then transfers power to the generator:
$$ P_{gen} = \eta_{gear} P_{pinion} $$
The generator converts mechanical power to electrical power:
$$ P_e = \eta_{gen} P_{gen} $$
The overall efficiency is:
$$ \eta_{system} = \eta_{rp} \eta_{gear} \eta_{gen} \eta_{rect} \eta_{batt} $$
I use this equation to identify losses. The rack and pinion gears should have high efficiency, usually above 95% for well-lubricated steel gears. The gear train efficiency depends on the number of stages and the quality of the bearings. The generator efficiency depends on speed and load. The rectifier and battery efficiency also matter. I design the system so that the rack and pinion gears operate near their rated load and the generator operates near its optimal speed.
12. Speed Measurement
Speed measurement is a natural extension of energy harvesting. The generator output is proportional to speed. The pinion angular velocity is proportional to the rack velocity. The rack velocity is related to the vertical motion of the deck. If I know the geometry and the tire contact time, I can estimate vehicle speed. I define a calibration constant Kv such that:
$$ \omega_{gen} = K_v v_{vehicle} $$
The vehicle speed estimate is:
$$ \hat{v} = \frac{\omega_{gen}}{K_v} $$
I can also use the time between two sensor pulses. If the distance between two sensing points is Ls and the time difference is Δt, then:
$$ v = \frac{L_s}{\Delta t} $$
For a single hump, I can use the duration of the generator pulse. If the contact length is Lc and the pulse duration is Tp, then:
$$ v \approx \frac{L_c}{T_p} $$
The speed module can compare the estimated speed with a threshold. If the speed exceeds the limit, the module can send a message to a traffic management center. The rack and pinion gears provide a repeatable mechanical response, which improves the consistency of speed estimation. I can also combine multiple humps to improve accuracy. The following table gives an example speed calibration.
| Test Speed (m/s) | Generator Pulse Frequency (Hz) | Estimated Speed (m/s) | Error (%) |
|---|---|---|---|
| 3 | 12 | 3.05 | 1.7 |
| 5 | 20 | 4.95 | -1.0 |
| 8 | 32 | 8.10 | 1.3 |
| 10 | 40 | 9.92 | -0.8 |
| 15 | 60 | 15.20 | 1.3 |
13. Weight Measurement
Weight measurement is more difficult than speed measurement because the generator output depends on both mass and speed. I can use the energy equation:
$$ E_k = \frac{1}{2} m_v v^2 $$
If I measure the speed independently, I can estimate the mass from the recovered energy and the known efficiency:
$$ \hat{m}_v = \frac{2 E_{cross}}{\eta_{system} v^2} $$
This estimate is sensitive to efficiency changes, suspension behavior, and tire pressure. I therefore use multiple humps or multiple rack-and-pinion units to improve the estimate. I can also use a strain gauge or load cell in the deck support. The rack and pinion gears provide a mechanical signal that is proportional to the rack force. If I measure the pinion torque or the reaction force, I can estimate the load. The following table shows an example weight classification.
| Class | Estimated Mass (kg) | Typical Vehicle | Action |
|---|---|---|---|
| Light | Less than 1,200 | Small car | Normal logging |
| Medium | 1,200 to 2,500 | Sedan, SUV | Normal logging |
| Heavy | 2,500 to 4,500 | Van, light truck | Flag for review |
| Very heavy | Above 4,500 | Heavy truck | Overload warning |
14. Traffic Flow Detection
I can use the same sensor data to estimate traffic flow. If N vehicles cross in a time interval Δt, the flow rate is:
$$ q = \frac{N}{\Delta t} $$
If the average speed is v, the density is:
$$ \rho = \frac{q}{v} $$
The relationship between flow, density, and speed is:
$$ q = \rho v $$
I can use this relationship to detect congestion. If the flow is high and the speed is low, the road is congested. If the flow is high and the speed is high, the road is free-flowing. The rack and pinion gears provide a pulse for each vehicle or axle, which helps counting. The following table shows an example traffic flow record.
| Time Window | Vehicle Count | Average Speed (m/s) | Flow (veh/h) | Density (veh/km) |
|---|---|---|---|---|
| 07:00-07:15 | 120 | 8.0 | 480 | 16.7 |
| 07:15-07:30 | 150 | 7.0 | 600 | 23.8 |
| 07:30-07:45 | 180 | 5.0 | 720 | 40.0 |
| 07:45-08:00 | 210 | 4.0 | 840 | 58.3 |
15. Product Functions
My design provides several functions. First, it acts as a fixed energy source for roadside devices. Second, it can act as an emergency power source when the main grid fails. Third, it can measure speed. Fourth, it can estimate weight. Fifth, it can detect traffic flow. These functions are enabled by the mechanical core and the modular electronics. The rack and pinion gears are common to all versions. The following table summarizes the functions and benefits.
| Function | Description | Primary Benefit | Role of Rack and Pinion Gears |
|---|---|---|---|
| Fixed energy source | Power streetlights, sensors, signs | Lower local energy cost | Convert deck motion to generator rotation |
| Emergency power | Provide backup electricity | Resilience during outages | Allow manual or vehicle-driven charging |
| Speed measurement | Estimate vehicle speed | Traffic enforcement and safety | Provide repeatable angular pulses |
| Weight measurement | Estimate vehicle load | Overload detection | Transmit rack force to pinion torque |
| Traffic flow | Count vehicles over time | Planning and signal control | Generate one pulse per crossing |
| Comfort and damping | Absorb impact | Less vehicle damage | Guide motion instead of rigid impact |
16. Modular Design
I designed the system as a modular platform. The mechanical base contains the moving deck, the push rod, the rack and pinion gears, the gear train, the generator, and the battery. The sensor module can be added to the base. The communication module can be wired or wireless. The energy output can be connected to a local load or to a microgrid. If a component fails, I can replace the module without replacing the entire hump. The rack and pinion gears are part of the base module, but they can be accessed through a service panel. I use standard bearings, seals, and fasteners to reduce maintenance cost.
17. Design Innovations
I see several innovations in this design. The first is the use of rack and pinion gears to convert vertical displacement into rotation in a speed hump. The second is the integration of energy storage and traffic sensing in the same physical asset. The third is the modular architecture, which allows different functions to be added or removed. The fourth is the comfort-oriented moving deck, which reduces impact while still controlling speed. The fifth is the use of standard mechanical components, which makes the design manufacturable. The following table lists the innovations and their effects.
| Innovation | Technical Basis | Expected Effect | Keyword Link |
|---|---|---|---|
| Linear-to-rotary energy conversion | Rack and pinion mechanism | Higher generator speed | rack and pinion gears |
| Comfort-oriented deck | Guided vertical motion | Lower peak acceleration | rack and pinion gears guide motion |
| Integrated sensing | Generator signal and displacement | Speed, weight, flow data | rack and pinion gears provide pulses |
| Modular electronics | Replaceable sensor and storage units | Lower maintenance cost | rack and pinion gears remain in base |
| Standard components | Standard gear modules and bearings | Easier manufacturing | rack and pinion gears are common parts |
18. Comparison with Conventional Speed Humps
I compared my design with a conventional rigid hump. The comparison is not absolute because both designs must meet safety requirements. However, the differences are clear in energy, comfort, data, and maintenance. The following table summarizes the comparison.
| Criterion | Conventional Speed Hump | My Rack and Pinion Design |
|---|---|---|
| Motion | Rigid impact | Guided moving deck |
| Energy | Dissipated as heat and noise | Partially recovered and stored |
| Comfort | High peak acceleration | Lower peak acceleration |
| Noise | High impact noise | Reduced impact noise |
| Data | None | Speed, weight, flow |
| Maintenance | Reactive | Modular and predictive |
| Energy source | None | Vehicle kinetic energy |
| Core mechanism | Fixed geometry | Rack and pinion gears |
19. Reliability and Maintenance
I designed for reliability because the device is exposed to weather and repeated loading. The rack and pinion gears are sealed and lubricated. The moving deck has a wiper seal to keep out dust and water. The battery is placed in a protected enclosure. The generator is selected for low maintenance. I can use the sensor data to monitor performance. If the generator output decreases, I can infer increased friction or gear wear. If the deck return time increases, I can infer spring fatigue. The rack and pinion gears can be inspected through a service panel. The mean time between failures can be estimated as:
$$ MTBF = \frac{T_{total}}{N_f} $$
where Ttotal is total operating time and Nf is the number of failures. The reliability function for a constant failure rate is:
$$ R(t) = e^{-\lambda t} $$
where λ is the failure rate. I can reduce λ by using high-quality seals, corrosion-resistant materials, and proper lubrication. The rack and pinion gears are a mature technology, so their failure modes are well understood. This is another reason I selected them.
20. Safety and Standards
Safety is essential. The speed hump must not create a hazard for motorcycles, bicycles, or pedestrians. The moving deck must not trap fingers or clothing. The edges must be chamfered. The surface must be visible in all weather conditions. The electrical components must be grounded and protected. The battery must have overcharge, overdischarge, and thermal protection. The rack and pinion gears must be enclosed so that no pinch points are exposed. I also consider fail-safe behavior. If the generator or battery fails, the return spring must still reset the deck. If the moving deck jams, the vehicle should still be able to pass safely. I therefore limit the maximum deck displacement and use a mechanical stop. The rack and pinion gears are designed with a safety factor against tooth breakage and fatigue.
21. Sustainability and Environmental Value
The environmental value of my design comes from two sources. First, it recovers energy that would otherwise be wasted. Second, it supports local monitoring and control, which can reduce unnecessary idling and improve traffic flow. The avoided carbon emissions can be estimated as:
$$ CO_2 avoided = E_{year} EF_{grid} $$
where Eyear is the annual harvested energy and EFgrid is the grid emission factor. If the local grid is carbon-intensive, the benefit is larger. If the grid is already low-carbon, the benefit is smaller but still nonzero. The rack and pinion gears contribute to sustainability by enabling a durable, repairable, and recyclable mechanical core. Steel gears can be recycled at end of life. The battery can be replaced separately. The modular design extends the service life of the entire asset.
22. Performance Modeling and Example Calculations
I now present a more detailed calculation example. I assume a vehicle mass of 1,500 kg, a speed of 8 m/s, and a recovery fraction of 8%. The kinetic energy is:
$$ E_k = \frac{1}{2} m v^2 = \frac{1}{2}(1500)(8^2) = 48,000 \text{ J} $$
The recovered energy is:
$$ E_{rec} = 0.08 \times 48,000 = 3,840 \text{ J} $$
If the crossing time is 0.4 s, the average electrical power is:
$$ P_{avg} = \frac{E_{rec}}{t} = \frac{3,840}{0.4} = 9,600 \text{ W} $$
This is a high instantaneous power, but it lasts for a short time. The battery must accept high current pulses or use a supercapacitor buffer. I can add a supercapacitor to smooth the power. The energy storage requirement for 1,000 crossings is:
$$ E_{day} = 1000 \times 3,840 = 3,840,000 \text{ J} = 1.07 \text{ kWh} $$
If the battery voltage is 12 V, the required charge is:
$$ Q = \frac{E_{day}}{V_b} = \frac{3,840,000}{12} = 320,000 \text{ C} = 88.9 \text{ Ah} $$
With a depth of discharge of 80%, the nominal capacity is:
$$ C_{nom} = \frac{88.9}{0.8} = 111 \text{ Ah} $$
This is a reasonable size for a roadside battery. The rack and pinion gears must handle the peak force. If the average rack force is 2,000 N and the rack travel is 0.06 m, the mechanical work is:
$$ W = F x = 2000 \times 0.06 = 120 \text{ J} $$
This is less than the recovered energy estimate, which indicates that the peak force during impact may be much higher. I therefore use a dynamic model to size the rack and pinion gears. The peak force can be estimated from the vehicle suspension and the deck stiffness. If the peak force is 20,000 N, the rack must be strong enough. The pinion torque is:
$$ \tau_p = F_{rack} r_p = 20,000 \times 0.02 = 400 \text{ N·m} $$
This is a high torque for a small pinion. I may need a larger pinion radius or a multi-rack arrangement to reduce the load per rack. Alternatively, I can use a hydraulic or pneumatic damping element in parallel with the rack and pinion gears to limit the peak force. The design must balance energy recovery and structural strength. The following table shows how pinion radius affects torque and speed.
| Pinion Radius (m) | Rack Force (N) | Pinion Torque (N·m) | Rack Speed for 8 m/s Vehicle (m/s) | Pinion Speed (rad/s) |
|---|---|---|---|---|
| 0.01 | 20,000 | 200 | 0.20 | 20 |
| 0.02 | 20,000 | 400 | 0.20 | 10 |
| 0.04 | 20,000 | 800 | 0.20 | 5 |
| 0.02 | 10,000 | 200 | 0.20 | 10 |
| 0.02 | 30,000 | 600 | 0.20 | 10 |
The table shows that a larger pinion increases torque but reduces speed. The rack and pinion gears must be selected with the gear train to match the generator. I also need to consider bending stress in the gear teeth. The bending stress can be estimated using the Lewis equation:
$$ \sigma_b = \frac{F_t}{b m Y} $$
where Ft is the tangential force, b is the face width, m is the module, and Y is the Lewis form factor. The contact stress can be estimated using the Hertz equation. I use these equations to size the rack and pinion gears. The design must satisfy the allowable stress with a safety factor. The following table gives an example stress check.
| Parameter | Symbol | Value | Unit |
|---|---|---|---|
| Tangential force | F_t | 10,000 | N |
| Face width | b | 30 | mm |
| Module | m | 2 | mm |
| Lewis form factor | Y | 0.32 | – |
| Bending stress | σ_b | 520.8 | MPa |
| Allowable stress | σ_allow | 650 | MPa |
| Safety factor | SF | 1.25 | – |
If the safety factor is too low, I can increase the face width, increase the module, or use a stronger material. The rack and pinion gears can be hardened and ground for higher strength and wear resistance. I can also use helical gears to reduce noise and increase load capacity. The choice depends on cost and manufacturing capability. My goal is a robust design that can survive millions of cycles.
23. Control and Communication Architecture
I use a small controller to manage energy and data. The controller monitors the generator voltage, current, battery state, deck displacement, and sensor inputs. It controls the charging circuit and communicates with a gateway. The control logic can be summarized as:
$$ SOC(t) = SOC(0) + \frac{1}{C_{nom}} \int_{0}^{t} I_{charge}(\tau) d\tau $$
where SOC is state of charge and Icharge is the charging current. The controller prevents overcharge and overdischarge. It can also schedule noncritical loads when the battery is full. The communication module can use a low-power wireless protocol. The data can include vehicle count, average speed, maximum speed, estimated weight class, and energy harvested. The rack and pinion gears provide the physical event that triggers each data record. The following table shows the control inputs and outputs.
| Input | Sensor | Output | Action |
|---|---|---|---|
| Generator voltage | Voltage divider | Charging control | Enable or disable charging |
| Generator current | Shunt or Hall sensor | Power calculation | Log energy |
| Deck displacement | Linear encoder | Speed estimate | Compute vehicle speed |
| Pinion speed | Magnetic encoder | Speed and flow | Count crossings |
| Battery voltage | ADC | SOC estimate | Protect battery |
| Temperature | Thermistor | Thermal protection | Reduce charging if hot |
24. Installation and Road Integration
I designed the device to fit into a road surface with minimal disruption. The box is installed in a recess. The top of the moving deck is flush with or slightly above the road surface. The edges are ramped to guide tires. The rack and pinion gears are below the deck. The electrical cables run through a conduit to a roadside cabinet. The installation can be done in sections. For a two-lane road, I can install one unit per lane. The units can share a battery and communication gateway. The following table shows an example installation plan.
| Road Type | Number of Units | Expected Traffic | Battery Size | Communication |
|---|---|---|---|---|
| Residential street | 1 per lane | Low | 50 Ah | Wireless |
| Campus road | 1 per lane | Medium | 80 Ah | Wireless |
| Parking lot exit | 1 per lane | Medium | 80 Ah | Wired or wireless |
| Industrial gate | 2 per lane | Heavy | 150 Ah | Wired |
| Toll approach | 2 per lane | Very heavy | 200 Ah | Wired |
25. Economic Assessment
I evaluated the economic value of the design. The initial cost includes the mechanical box, the rack and pinion gears, the gear train, the generator, the battery, the controller, and the sensors. The operating cost includes maintenance and battery replacement. The benefits include local energy savings, reduced streetlight wiring cost, traffic data value, and improved safety. The simple payback period can be estimated as:
$$ T_{payback} = \frac{C_{initial}}{S_{annual} – C_{maintenance}} $$
where Cinitial is the initial cost, Sannual is the annual savings, and Cmaintenance is the annual maintenance cost. The annual energy savings can be estimated as:
$$ S_{energy} = E_{year} P_{electricity} $$
where Pelectricity is the electricity price. In areas with high traffic and high electricity prices, the payback period can be shorter. In low-traffic areas, the data and safety benefits may dominate. The rack and pinion gears have a long life if properly lubricated, so the mechanical core does not need frequent replacement. The following table shows an example economic estimate.
| Item | Cost or Benefit | Value | Unit |
|---|---|---|---|
| Initial mechanical and electrical cost | Cost | 1,200 | USD |
| Annual maintenance | Cost | 60 | USD/year |
| Annual energy | Benefit | 400 | kWh/year |
| Electricity price | Benefit | 0.15 | USD/kWh |
| Annual energy savings | Benefit | 60 | USD/year |
| Data and safety value | Benefit | 200 | USD/year |
| Net annual benefit | Benefit | 200 | USD/year |
| Simple payback | Result | 6 | years |
26. Limitations and Future Work
I recognize several limitations. First, the energy available per vehicle is limited by the hump height and the allowable vertical acceleration. Second, the system adds mechanical complexity compared with a rigid hump. Third, the battery and electronics must survive temperature extremes. Fourth, the weight measurement is sensitive to speed and suspension characteristics. Fifth, the initial cost may be higher than a conventional hump. I plan to address these limitations through simulation, field testing, and design optimization. I can use finite element analysis to optimize the rack and pinion gears and the deck structure. I can use multibody dynamics to model the vehicle-hump interaction. I can use machine learning to improve speed and weight estimation from multiple sensors. I can also explore energy storage alternatives such as supercapacitors and hybrid batteries. The rack and pinion gears will remain the mechanical foundation because they are efficient, robust, and well understood.
27. Conclusion
I have presented a new energy-storing speed hump based on rack and pinion gears. The design converts the vertical motion of a moving deck into rotation, multiplies the speed through a gear train, generates electricity, stores the energy in a battery, and uses the same mechanical response for speed, weight, and traffic flow measurement. The rack and pinion gears provide a direct, reliable, and efficient linear-to-rotary conversion. They also allow a modular and maintainable architecture. My first-person engineering assessment is that the concept is technically feasible and economically promising in suitable locations. The rack and pinion gears are not an incidental detail; they are the core enabler of the energy recovery and sensing functions. By combining rack and pinion gears with intelligent control and modular electronics, I can turn a conventional road obstacle into a small, distributed, and useful infrastructure asset. The design supports safer traffic, better comfort, lower noise, local energy production, and data-driven road management. I will continue to refine the rack and pinion gears, the generator matching, the energy storage buffer, and the sensor fusion algorithms. In my view, the future of speed humps is not only to slow vehicles but also to learn from them and recover value from their motion.