
A bright circumferential streak on a spiral bevel gear tooth is easy to read as damage. In an aviation main reducer, that reading can scrap a gear set that has only completed a high-stress running-in step. The engineering question is whether the contact surface has lost material and load capacity, or has flattened into a more stable geometry. Surface integrity parameters—areal roughness, residual stress, and near-surface crystallography—provide the evidence needed to separate the two.
The Diagnostic Problem in Aviation Spiral Bevel Gears
Spiral bevel gears carry high torque through curved teeth and a contact path that combines rolling with substantial sliding. At high power, the lubricant film can become partial or locally interrupted, and asperities interact under high contact stress. The usual failure vocabulary mixes mechanism with appearance. Scuffing and scoring are not used consistently: some usage treats them as overlapping or equivalent, while other usage treats scuffing as an earlier, milder stage of scoring. Shop-floor assessment often reduces the distinction to visual categories—bright streaks and polishing marks are called scuffing, while severe material removal, burned spots, and pits are called scoring.
That visual shortcut is unsafe in both directions. A bright band can be a smoothed, work-hardened contact surface rather than a torn one; conversely, a lightly roughened area can be the start of material loss. For aviation gears, the disposition decision—continue service, rework, or scrap—depends on the mechanism, not on brightness alone.
Specimen, Test History, and Measurement Strategy
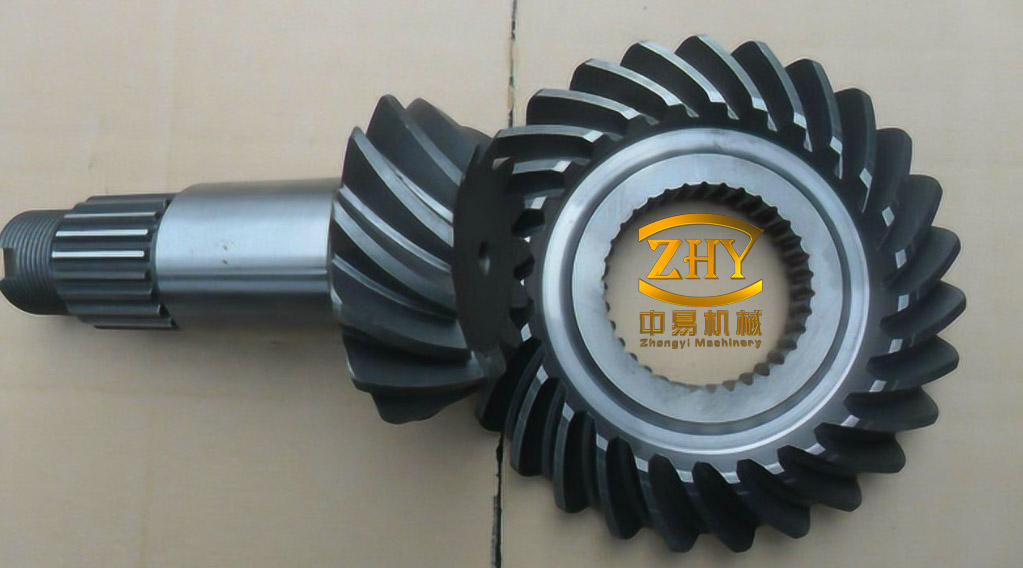
The examined component was the input pinion of a helicopter main reducer. The gear was made from a Soviet-specification aviation gear steel, lubricated with MIL-PRF-23827 grease, and finished by grinding, shot peening, and vibratory finishing. It ran for 10 min at 820 kW, 20,000 r/min, and 25 °C. After teardown, the working flanks showed bright scuffed bands, concentrated toward the small end of the tooth.
Four teeth were sectioned and numbered 1 to 4. The non-working flanks served as an unserved reference; the scuffed working flanks represented the post-service state. Areal roughness was measured by white-light interferometry over 1.2 mm × 1.2 mm areas on the reference flanks and 2 mm × 2 mm areas on the scuffed flanks, with 1.98 µm sampling. Residual stress was measured by X-ray diffraction with a 1 mm spot at tip, mid-tooth, and root locations. EBSD maps were acquired on teeth 2 and 3 at 0–30, 130–160, and 270–300 µm below the surface, using 30 µm × 30 µm maps with 72% indexing.
The comparison is a space-for-time substitution: the non-working flank is assumed to retain the initial working-surface state. That assumption is reasonable for this application but is not exact, because the two flanks can differ in finishing history and local geometry. The results are therefore interpreted as a mechanism-level comparison rather than a controlled before-and-after test.
Roughness: Flattening Rather Than Abrasive Loss
On the non-working flanks, the areal mean height Sa ranged from 0.45 to 0.75 µm, with most values between 0.60 and 0.70 µm. The texture consisted of machining grooves with shot-peening craters in the valleys; the peaks had largely been removed by vibratory finishing. One tooth had a reference roughness 0.05–0.15 µm lower than the others in one region, a reminder that tooth-to-tooth variation must be accounted for before comparing service damage.
The scuffed flanks had Sa values of 0.428–0.699 µm, lower than the unserved reference. The original grinding grooves had disappeared, while some shot-peening dimples remained, indicating that the topographically altered layer was shallow. No burn discoloration or abrasive scratch pattern was visible. The height-distribution skewness Ssk moved closer to zero relative to the reference, consistent with a flatter, plateau-like surface rather than a field of sharp peaks and deep valleys.
This is the opposite of the usual assumption that scuffing must increase roughness. The bright appearance is an optical consequence of smoothing: asperity peaks are compressed and flattened, and contact is carried by a broader area instead of isolated high points. The mechanism indicated by the topography is plastic deformation under high contact stress, not abrasive cutting or adhesive tearing. A single Sa value cannot establish that distinction, because a polished surface can also be a damaged one; the texture and Ssk are needed to confirm plateau formation.
Residual Stress: Supportive but Position-Sensitive
The reference flanks carried compressive residual stress from shot peening, with a mean of about 850 MPa in magnitude and measured values from −739 to −972 MPa. The stress was not uniform: mid-tooth locations generally had the largest compressive values, and the largest tip-to-mid-to-root difference was 184.93 MPa. Tooth 3 had the highest average, about 900 MPa, while tooth 1 varied by nearly 100 MPa. These differences reflect machining loads and non-uniform peening coverage over the curved tooth.
On single teeth 1 and 4, the scuffed contact zones had higher compressive stress than adjacent uncontacted working areas, reaching about 1000 MPa in magnitude. That is consistent with plastic compression and work hardening of the contact layer. The result was not universal. On teeth 2 and 3, uncontacted mid-tooth locations had higher compressive stress than the scuffed contact zones, because the initial mid-tooth stress was already higher.
Residual stress therefore supports the plastic-adaptation interpretation but is not a stand-alone discriminator. Its strong position dependence means that a valid comparison must be location-matched. A higher compressive value at a scuffed spot can indicate work hardening; a lower value can simply reflect where the spot sits relative to the initial peening gradient.
Microstructure: Plastic Strain Extending Below 300 µm
KAM maps provide a local measure of lattice misorientation and, qualitatively, of plastic strain. On the non-working flanks, KAM was highest in the 0–30 µm layer and similar at 130–160 and 270–300 µm, showing that grinding and peening had left a strained near-surface layer while the deeper material was little affected. Grain boundaries were denser and more uniform near the surface, and grains were finer. More than 50% of near-surface grains were below 0.5 µm in equivalent-circle diameter, with the fraction falling at 130–160 µm and again at 270–300 µm.
On the scuffed flank, KAM was higher than on the reference at all three depths, and the affected zone extended beyond 300 µm. Grain boundaries were denser and grain size smaller at 130–160 and 270–300 µm. In the top 0–30 µm, the non-working flank was slightly finer, because final grinding and vibratory finishing had already produced an ultrafine surface layer; the scuffing signature is clearest below that processing layer. Overall, the scuffed surface had a grain-size mode near 0.19 µm, and more than 80% of grains were between 0.19 and 0.5 µm.
The EBSD analysis identified no microcracks or phase transformation. The depth and intensity of the strain field are not consistent with a low-stress surface slip mechanism. They point to high-stress plastic flow: asperities and near-surface material are compressed, rearranged, and refined while the surface remains continuous. The denser boundaries and finer grains are consistent with an increase in near-surface strength and load-bearing capacity, although the measurements do not by themselves prove a fatigue-life increase.
| Indicator | Non-working flank (unserved reference) | Scuffed working flank |
|---|---|---|
| Areal roughness Sa | 0.45–0.75 µm; mostly 0.60–0.70 µm | 0.428–0.699 µm; lower than the reference |
| Skewness Ssk | Initial machining and peening texture | Closer to zero; plateau-like topography |
| Residual stress | Mean about −850 MPa; range −739 to −972 MPa | About −1000 MPa in some contact zones; not uniformly higher |
| KAM / plastic strain | Highest in 0–30 µm; little change below 130 µm | Higher at all depths; affected zone beyond 300 µm |
| Grain structure | More than 50% of near-surface grains below 0.5 µm; coarsens with depth | Mode near 0.19 µm; more than 80% between 0.19 and 0.5 µm; finer at depth |
Defining Running-In Scuffing
The evidence supports a specific category: running-in scuffing. It is defined here as a high-contact-stress surface-adaptation process in which asperities are flattened by plastic flow, areal roughness decreases relative to the unserved surface, height skewness approaches zero, and the near-surface structure refines without cracking or phase transformation. The surface is smoothed and work-hardened; it is not torn or gouged.
Not every bright mark qualifies. The following conditions should be met together:
- Sa is lower than that of a location-matched unserved reference.
- Ssk is near zero or slightly negative, indicating a plateau rather than sharp peaks.
- There is no burn discoloration, gouging, or abrasive scratch pattern.
- Residual stress is compressive, or at least shows no tensile layer.
- The microstructure shows grain refinement or denser boundaries without microcracks or phase transformation.
- There is no significant material loss or torn surface.
In the examined gear set, these conditions were satisfied, so the evidence supported continued service rather than rejection. The conclusion is mechanism-specific: a shallow, compressive, continuous plastic layer is different from a loss of material and a break in surface integrity.
| Feature | Running-in scuffing | Scuffing failure |
|---|---|---|
| Core mechanism | Plastic flattening and flow of asperities under high contact stress; no significant material detachment | Material removal by abrasive or adhesive wear, tearing, or scoring |
| Macro appearance | Bright or polished streaks; visually smooth | Scratches, grooves, dull patches, pits, or burned marks |
| Roughness | Sa decreases; Ssk near zero or slightly negative | Sa increases; directional grooves; broken profile |
| Microstructure | Grain refinement, denser boundaries, compressive stress, no cracks or phase transformation | Microcracks, tensile stress, disrupted microstructure, material loss |
| Load capacity | Maintained or improved by work hardening and compressive stress | Reduced by stress concentration and material removal |
| Disposition | Continue service after confirmation | Repair or replace |
Inspection Implications and Limits
For teardown inspection, the practical sequence is to locate the suspect band, compare its areal topography with a location-matched non-working or unserved reference, and check Sa together with Ssk and texture. A lower Sa than the matched reference, together with plateau-like skewness and no gouging, supports running-in scuffing. Residual stress can be added as supporting evidence, but it should not decide the case alone. EBSD is destructive and is best used for root-cause analysis and for building the criteria, not for routine fleet inspection.
The limits are significant. The evidence comes from one gear set, one material and lubricant combination, and a 10 min trial. The numerical ranges are case-specific, not universal acceptance thresholds. The non-working flank is a proxy for the initial working surface, and its finishing history can differ. The term “running-in scuffing” is used here to denote a mechanism and is not a standardized release category. Broader validation across gears, loads, and service times is needed before it becomes a general disposition rule.
Conclusion
A bright scuffed band on an aviation spiral bevel gear is not automatically a failure. In the examined gear set, the band was smoother than the unserved reference, had skewness closer to zero, carried more compressive stress in the contact zone, and showed grain refinement without cracks or phase transformation. Those are signatures of plastic adaptation, not material removal. The diagnostic distinction is therefore the direction of surface-integrity change: smoothing, compression, and refinement indicate running-in scuffing; roughening, tensile damage, and material loss indicate scuffing failure. That distinction can prevent unnecessary scrapping without relaxing the inspection of genuinely damaged gears.