
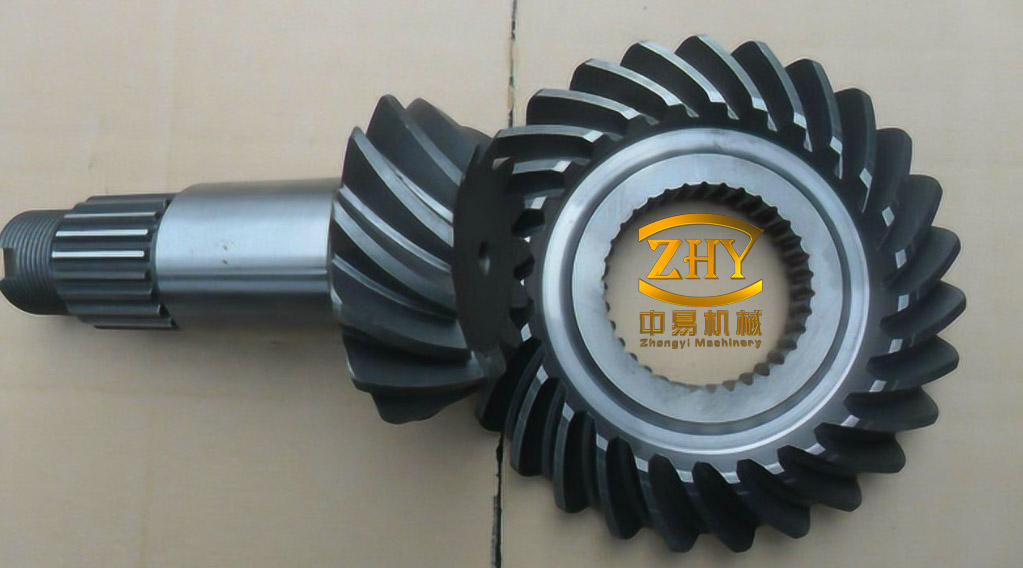
Power-combining spiral bevel gear transmissions divide input torque between two pinions that mesh with a common output gear. The arrangement provides a right-angle drive with high torque capacity, a large reduction ratio and a compact axial envelope. It also introduces a degree of redundancy, because the two meshes can share the load, although perfect load sharing is difficult to achieve in a flexible housing. Helicopter main reducers, marine propulsion trains and wind-turbine drives are representative applications; the UH-60A main gearbox is a documented example of a power-combining spiral bevel gear layout.
The dynamic problem is not equivalent to two independent gear pairs. Both meshes act on the same output gear, so the translational and torsional motion of that gear appears in both mesh-line displacements. Time-varying mesh stiffness, composite transmission error, backlash and bearing compliance then act through a shared inertia. The resulting response can include jump phenomena, period doubling, coexisting attractors and chaos. A transmission that is periodic at one nominal operating point may sit close to a chaotic band at a neighboring speed or error amplitude.
The practical design question is therefore a parameter-space question: where are the periodic windows, how wide are they, which parameter moves the system across a boundary, and which combinations remain robust? A bifurcation diagram at fixed transmission error, or a maximum Lyapunov exponent at fixed mesh frequency, answers only a slice of that question. Two-parameter solution-domain maps address the question directly by classifying every cell in an excitation plane according to the attractor reached on the Poincaré section.
System Model and Dimensionless Form
A nonlinear formulation of the power-combining system treats the two input pinions \(g_1\) and \(g_2\) and the output gear \(g_0\) as rigid bodies. Each body carries three translational coordinates and one torsional coordinate, so the unreduced system has 12 degrees of freedom. The shafts are orthogonal, with a shaft angle of 90°, and the two meshes \(M_1\) and \(M_2\) are geometrically symmetric. Tooth friction is neglected, the bearings are represented by linear support stiffness and damping, and the two input branches carry equal torque.
Both pinions have 23 teeth and the output gear has 78, giving a reduction ratio of about 3.39. The normal module is 4.25 mm, the normal pressure angle is 20°, and the helix angle is 35°. The pinions are left-hand and the output gear is right-hand. Each pinion is driven at 400 N·m, and the nominal output torque is 2713 N·m. The support stiffness of the output gear is substantially higher than that of the pinions, which is consistent with its larger inertia and its role as the common collecting member.
| Parameter | Pinions \(g_1\), \(g_2\) | Output gear \(g_0\) |
|---|---|---|
| Number of teeth | 23 | 78 |
| Normal module | 4.25 mm | 4.25 mm |
| Normal pressure angle | 20° | 20° |
| Helix angle | 35° | 35° |
| Tooth hand | Left | Right |
| Nominal torque | 400 N·m each | 2713 N·m |
| Moment of inertia | 0.018 kg·m2 | 0.042 kg·m2 |
| Support stiffness | 2.08×10⁸ N/m | 7.83×10⁸ N/m |
| Support damping | 558.12 N·s/m | 651.02 N·s/m |
| Mean mesh stiffness, \(k_m\) | 7.79×10⁸ N/m for \(M_1\) and \(M_2\) | |
| Mesh damping, \(c_i\) | 729.86 N·s/m for \(M_1\) and \(M_2\) | |
| Stiffness fluctuation coefficient, \(\varepsilon\) | 0.1–0.4 | |
| Mesh damping ratio, \(\xi\) | 0.01–0.45 | |
Eliminating the rigid-body rotation through the two mesh-line relative displacements \(x_{01}\) and \(x_{02}\) leaves 11 generalized coordinates: three translations for each gear and the two relative mesh displacements. Assembly gives the dimensionless matrix equation
$$M\ddot{q}+C\dot{q}+Kq=F$$
where \(q\) contains the dimensionless translations of \(g_0\), \(g_1\) and \(g_2\) together with \(x_{01}\) and \(x_{02}\). The matrices \(M\), \(C\), \(K\) and \(F\) are the dimensionless mass, damping, stiffness and load terms. The stiffness matrix contains the support stiffnesses and the mesh-stiffness projections, while the load vector contains the input and output torques and the transmission-error acceleration.
At mesh \(i\), the normal mesh force is
$$F_{0i}=k_i(t)x_{0i}+c_i\dot{x}_{0i},\qquad i=1,2$$
with the time-varying mesh stiffness
$$k_i(t)=k_m\left[1+\varepsilon\sin(\Omega t+\psi_i)\right]$$
Here \(k_m\) is the mean mesh stiffness, \(\varepsilon\) is the stiffness fluctuation coefficient, \(\Omega\) is the mesh frequency, and \(\psi_i\) is the initial mesh phase. The composite transmission error is prescribed as
$$e_i(t)=-\hat{E}\sin(\Omega t+\psi_i)$$
where \(\hat{E}\) is the error amplitude. The relative displacement \(x_{0i}\) is obtained by projecting the translations and torsional displacements of the two members onto the line of action and subtracting the transmission error. Backlash is retained in the contact relation and is represented by the dimensionless parameter \(b=b_n/b_c\), where \(b_n\) is the backlash and \(b_c\) is the characteristic length.
Using the equivalent mass \(m’_i=J_i/r_i^2\), the reference frequency is
$$\omega_n=\left[k_{m1}\left(\frac{1}{m’_0}+\frac{1}{m’_1}\right)\right]^{1/2}$$
and the dimensionless variables are
$$\tau=\omega_n t,\qquad \omega=\frac{\Omega}{\omega_n},\qquad b=\frac{b_n}{b_c}$$
The dimensionless transmission error satisfies
$$\ddot{e}_i(\tau)=-E\omega^2\sin(\omega\tau+\psi_i)$$
where \(E\) is the dimensionless error amplitude. Because the coefficients are periodic in \(\omega\tau\), the system is nonautonomous and the Poincaré section is taken once per mesh period. The equations are integrated with a variable-step Runge–Kutta method.
Cell Mapping and Solution-Domain Decomposition
The parameter-space method replaces a continuous excitation plane with a finite set of rectangular cells. The cell-mapping idea, introduced by Hsu, is combined here with a domain-decomposition bookkeeping step. The chosen parameter plane \(\Theta\) is divided into \(N’\times N’\) cells, each with width
$$h_i=\frac{\alpha_{l,i}-\alpha_{0,i}}{N’},\qquad i=1,2$$
where \(\alpha_{l,i}\) and \(\alpha_{0,i}\) are the upper and lower bounds of the \(i\)-th parameter. The maps discussed below use a \(401\times401\) grid, or 160,801 parameter cells. Each cell represents a parameter pair, not a phase-space state. For each pair, the equations are integrated until the transient has decayed, and the attractor is sampled on the Poincaré section. If the mapping closes after \(k\) points, the cell is assigned to a period-\(k\) domain. If no closure is found as \(k\) grows, the cell is classified as chaotic.
Classification is based on the distance between attractor point sets rather than on a single trajectory point. Let \(Q_1\) and \(Q_2\) be the Poincaré attractor sets of two parameter cells. Their separation is measured by
$$\rho(Q_1,Q_2)=\min_{i,j}\left\|X^{(i)}-X^{(j)}\right\|_\infty$$
where \(X^{(i)}\in Q_1\) and \(X^{(j)}\in Q_2\). If \(\rho\) falls below \(\varepsilon_1=1.0\times10^{-2}\), the two cells are assigned to the same solution domain. A solution domain is therefore a connected set of parameter cells that reach the same attractor. Cells with at least one neighbor in a different domain are boundary cells. These boundary cells approximate the bifurcation set: they mark parameter values at which the response switches from one attractor to another.
Maximum Lyapunov exponents and explicit Poincaré maps provide independent checks. A positive exponent indicates chaos, while a negative or zero exponent is consistent with a periodic attractor. A domain label is accepted when the point-set distance and the exponent agree.
Bifurcation Paths in the Frequency–Error Plane
Consider first a one-dimensional path in mesh frequency at fixed error amplitude. At \(E=28\), three bifurcation points appear at \(\omega=0.917\), \(0.935\) and \(0.951\). The response remains periodic over \(\omega\in[0.9,0.954]\), but the period-2 branch is not continuous. It breaks and contracts, leaving two branches until the response enters period-1 just before \(\omega=0.954\). The jump at \(\omega=0.935\) is attributed to a crisis that destabilizes mesh contact and produces impact-like behavior. Beyond \(\omega=0.954\), the response enters a sustained chaotic interval.
As \(E\) increases, the period-2 segment between \(0.935\) and \(0.951\) weakens. At \(E=29\) the degeneration is more pronounced; at \(E=30\) the right-hand period-2 branch disappears and a short single-period interval appears instead. The effect is non-monotonic. A moderate transmission error can suppress a multi-period branch, but once the error exceeds a threshold it broadens the irregular response. The bifurcation points also shift along the frequency axis as the upper and lower period-2 branches contract.
This behavior explains why a single bifurcation diagram is insufficient. The same error amplitude can stabilize one frequency interval and destabilize another. The two-parameter domain shows the shape and extent of those intervals, and it identifies the combinations for which a periodic window is wide enough to be useful.
Transmission Error Against Stiffness Modulation
The first two-parameter map uses transmission error \(E\) and stiffness fluctuation \(\varepsilon\) over \(1.0\le E\le2.6\) and \(0.01\le\varepsilon\le0.1\). With 401 divisions in each direction, the cell widths are \(4.0\times10^{-3}\) in \(E\) and \(2.24\times10^{-4}\) in \(\varepsilon\). Three solution types appear: period-1, period-4 and chaos. Period-1 regions are embedded inside the chaotic region as several windows with clear boundaries. For \(E\) below about 1.22, period-4 occupies most of the plane. Comparison of the two axes shows that changing \(E\) moves the response across domain boundaries more readily than changing \(\varepsilon\). The transmission-error amplitude is therefore the stronger control parameter in this plane.
The boundary cells trace the bifurcation set. A boundary cell is not a mathematical curve; it is the last cell on one side of a switch. Its parameter values are an estimate of the critical excitation at which the attractor changes. That estimate is useful for design because it gives a finite tolerance band rather than a single threshold. The map also shows that the periodic windows are not simply connected islands: some are narrow strips that follow a curved boundary, which means that a small change in error can move a nominally periodic design into chaos even when the stiffness modulation is held constant.
Mesh Frequency Against Transmission Error
The second map uses \(E\) and \(\omega\). Period-1, period-2, period-3 and chaotic cells coexist. Period-1 and period-2 occupy most of the plane, and a chaotic band separates them. Period-1 appears on both sides of the chaotic band. As \(E\) decreases from 2.5 to 1.2, the transition from period-1 to period-2 proceeds through period doubling. Near \(\omega=0.76\)–0.8, period-3 cells and chaotic cells are intermixed; this local region is treated as unstable because the attractor type changes on a fine parameter scale. Some boundary cells show a direct transition from period-1 to chaos without an intermediate period-doubling cascade.
The maximum Lyapunov exponent was evaluated along three frequency slices. The exponent changes sign at the same parameter values where the domain map changes label, which supports the cell classification. The map therefore does more than display a pattern: it locates the frequency bands where a small change in error amplitude will move the system into or out of chaos.
Damping, Backlash and Period-Doubling Windows
The damping-ratio map uses \(\xi\) and \(E\). As \(\xi\) decreases, the chaotic domain expands and period-doubling windows appear in the sequence P2, P4, P8 and P16. The high-period windows are narrow. P16 cells appear only sparsely near the chaotic boundary. This is a resolution issue as well as a physical one: high-period windows shrink rapidly as the damping ratio falls, and they are sensitive to small changes in excitation. Resolving them requires a finer grid, and the cell count in a two-dimensional map grows roughly with the square of the division count.
Three independent cells were checked: \((\xi,E)=(0.1,0.35)\), \((0.3,0.35)\) and \((0.4,0.35)\). The Poincaré sections returned chaotic, period-4 and period-2 responses, respectively. The trend is consistent with the map: lower damping supports chaos, intermediate damping supports period-4, and higher damping supports period-2 in this error range.
Backlash was compared with transmission error over the damping range \(0.05\le\xi\le0.45\). The period-4 fraction is 16.67% in the \(\xi\)–\(b\) plane and 20.21% in the \(\xi\)–\(E\) plane. The fraction is defined as
$$S=\frac{n_i}{N}$$
where \(n_i\) is the number of cells in state \(i\) and \(N\) is the total cell count. The comparison indicates that, within this range, the period-4 domain is more extensive when error is varied than when backlash is varied. The result should be read as a cell-count comparison, not as a probability: it depends on the chosen parameter ranges and on the grid resolution.
| Plane | Damping ratio range | Period-4 cell fraction |
|---|---|---|
| \(\xi\)–\(b\) | 0.05–0.45 | 16.67% |
| \(\xi\)–\(E\) | 0.05–0.45 | 20.21% |
What the Maps Mean for Design
Three practical conclusions follow. First, low damping is the clearest route to chaotic response in this system. The chaotic domain expands as \(\xi\) falls, and the high-period windows that could offer alternative stable operation become too narrow to rely on. Second, transmission error is not uniformly destabilizing. At moderate amplitude it can suppress a period-2 branch, but beyond a threshold it enlarges the irregular region. A design that tunes error amplitude to reduce one resonance can therefore create a chaotic band at a neighboring frequency. Third, the topology of the domains matters more than a single stability margin: a periodic window surrounded by chaos may be stable at its center but fragile at its edges.
The two-parameter maps also provide a way to select target intervals. If a period-1 response is required, the map identifies the connected period-1 regions and their boundary cells. If period-4 operation is acceptable, the \(\xi\)–\(E\) plane shows a larger period-4 region than the \(\xi\)–\(b\) plane in the tested range. If the goal is to avoid chaos, the map identifies the parameter combinations that remain periodic across the widest neighborhood, not just at a nominal point.
Scope and Limitations
The model is a rigid-body, frictionless, constant-support representation. It neglects gyroscopic effects, shaft and casing flexibility, nonlinear bearing clearance, tooth friction and load-sharing imbalance between the two input branches. These omissions matter at very high speed or in lightweight housings. The maps are therefore a guide to the nonlinear mechanism, not a substitute for a full finite-element or experimental modal analysis. The results are numerical and model-based.
The domain decomposition has its own numerical limits. A \(401\times401\) grid resolves windows wider than about two cells; P8 and P16 windows can be thinner. The attractor distance threshold \(1.0\times10^{-2}\) can merge attractors that are close but distinct. Boundary cells are finite-width estimates of bifurcation curves. A finer grid would shift the estimated critical values, so the cell map should be read as a finite-resolution estimate rather than an exact bifurcation curve.
Within these limits, the two-parameter representation gives a compact picture of a complex system: period-1 windows embedded in chaos, period-doubling cascades, direct transitions to chaos, and boundary cells that mark the excitation values where the response changes. For a power-combining spiral bevel gear transmission, those features are the relevant design objects, because the two meshes couple the same output inertia and no single mesh can be tuned in isolation.