
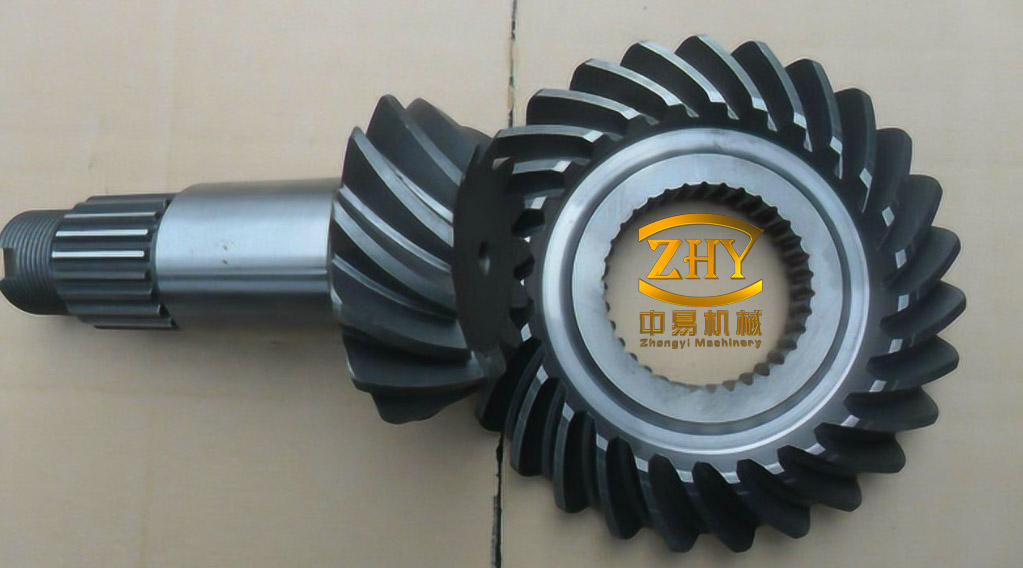
Spiral bevel gears are used where high torque, smooth motion, and low noise must be combined in a compact intersecting-shaft drive. In automotive, aerospace, marine, and heavy-machinery applications, the gear is usually carburized and oil-quenched to obtain a hard, wear-resistant case over a tough core. A typical specification requires 58–64 HRC at the surface without excessive dimensional change. Those two requirements are coupled: the carbon and temperature gradients that create a hard case also produce thermal strain, transformation strain, and residual stress. Distortion at the large-end addendum can alter the contact pattern and turn an otherwise acceptable gear into scrap.
The technical problem is therefore not simply to maximize hardness. It is to find a process window in which case hardness, case uniformity, and dimensional change are balanced. A coupled finite-element model can resolve the temperature, carbon, phase, stress, and displacement fields, while statistical designs can reduce the number of full simulations. The workflow described here combines a response-surface screen, an entropy-weighted carburizing optimization, a grey-relational quench optimization, and an experimental check on a 18Cr2Ni4WA spiral bevel gear.
Why Carburizing and Quenching Produce Distortion
During carburizing, carbon enters the austenite from a high-carbon-potential atmosphere. The boost stage establishes a steep surface carbon gradient; the diffusion stage reduces that gradient and pushes carbon deeper into the tooth. A higher surface carbon content lowers the martensite start temperature, so the case can retain more austenite after quenching. The core, with lower carbon, transforms more completely. This difference in transformation timing and volume change is a primary source of internal stress.
Quenching adds a second, faster transient. The surface cools first and contracts, while the core remains hot. Later, martensite forms and expands. Because thermal contraction and transformation expansion occur at different times and locations, transformation plasticity and residual stress develop. The final distortion is the accumulated result of these events, not a single thermal-expansion effect. The geometry of a spiral bevel gear amplifies the problem: section thickness changes from the large end to the small end, cooling is nonuniform, and the large-end tooth tip combines a steep carbon gradient with a stress concentration.
Finite-Element Representation
The analysis used a three-dimensional model of a left-hand spiral bevel gear. The gear was discretized into 18,218 nodes and 77,031 elements in DEFORM. The bottom face was constrained to represent flat loading in the furnace and quench tank. The thermal, carbon, phase-transformation, hardness, and elastic–plastic stress fields were solved in a coupled manner. Diffusional phase changes were read from TTT curves, martensite formation was described by an empirical transformation function, and hardness was calculated from the volume fractions of ferrite, pearlite, bainite, austenite, and martensite. Martensite hardness was allowed to depend on carbon content.
Table 1. Basic geometry of the modeled spiral bevel gear.
| Parameter | Value | Parameter | Value |
|---|---|---|---|
| Module | 3 mm | Number of teeth | 44 |
| Hand | Left | Face width | 20.2 mm |
| Addendum coefficient | 0.85 | Pressure angle | 20° |
| Mean spiral angle | 35° | Shaft angle | 90° |
| Pitch diameter | 132 mm | Outer cone distance | 69.73 mm |
| Face cone angle | 73.39° | Mounting distance | 27 mm |
The steel was 18Cr2Ni4WA, a carburizing alloy steel with 0.18C, 0.27Si, 0.45Mn, 1.65Cr, 4.0Ni, and 1.0W in mass percent. Its critical points were Ac1 = 695 °C, Ac3 = 800 °C, Ms = 310 °C, and Mf = 250 °C. The DEFORM material database used BS 655M13 as the equivalent grade. The oil-quench boundary condition used a temperature-dependent heat-transfer coefficient that rose from about 140 W m−2 °C−1 at 100 °C to a peak near 3375 W m−2 °C−1 at 470 °C, then fell to about 560 W m−2 °C−1 at 850 °C.
Carbon transport was represented by a one-dimensional diffusion form applied at the tooth surface:
$$ \frac{\partial C}{\partial t}=\frac{\partial}{\partial x}\left[D(C,T)\frac{\partial C}{\partial x}\right] $$
where C is carbon content, t is time, x is depth, and D is a diffusivity that depends on temperature and carbon concentration. The surface flux was set by a mass-transfer condition:
$$ -D\frac{\partial C}{\partial x}=\beta\left(C_e-C_s\right) $$
with Ce the atmosphere carbon potential, Cs the surface carbon content, and β a transfer coefficient. This formulation allows the boost and diffusion stages to be represented by different potentials and hold times.
First Screen: Which Variables Move Distortion and Hardness?
A 27-run Box–Behnken design was used to screen four variables: carburizing temperature (900–930 °C), boost time (5–8 h), diffusion time (1.0–2.5 h), and quench temperature (820–880 °C). Across the runs, maximum total deformation reached 0.151 mm and maximum surface hardness reached 63.1 HRC. Most tooth-surface readings exceeded 60 HRC. The distortion mode was expansion, with the largest displacements concentrated at the large-end and small-end vertices.
The main-effect ranking for deformation was:
quench temperature > boost time > diffusion time > carburizing temperature.
For surface hardness, the ranking was:
diffusion time > quench temperature > boost time > carburizing temperature.
Quench temperature was the dominant deformation variable. Raising it increased the thermal gradient and the extent of austenite decomposition, so the transformation strain and final displacement both grew. Longer boost and diffusion times also increased deformation, but their influence was smaller than that of quench temperature. Within the tested window, increasing carburizing temperature slightly reduced total deformation, although the effect was weak compared with the quench and time effects. For hardness, diffusion time was the strongest factor because it controls how far carbon penetrates and how uniform the case becomes. Quench temperature was second because it governs martensite formation and the final hardness level.
Second-order response models fitted the simulation data well. The coefficient of determination was 99.65% for deformation and 98.72% for hardness; the adjusted values were 99.50% and 98.33%. Normal residual plots showed no strong departure from normality. Using minimum deformation and maximum hardness as the desirability targets, the first optimization gave 915 °C carburizing temperature, 5.0 h boost, 2.27 h diffusion, and 820 °C quench. The corresponding simulation gave 0.123 mm deformation and 62.7 HRC.
This screen identified the main levers but held carbon potential fixed. Because atmosphere carbon potential can change the surface carbon content independently of hold time, a second stage was needed to separate the effects of potential, time, and temperature.
Second Stage: Entropy-Weighted Carburizing Window
The carburizing stage was refined with a five-factor, four-level orthogonal array. The factors were carburizing temperature A (900–930 °C), boost carbon potential B (0.75–0.90%), boost time C (2.5–4.0 h), diffusion carbon potential E (0.80–0.95%), and diffusion time F (1.0–2.5 h). Deformation was treated as smaller-the-better and hardness as larger-the-better. A membership-function matrix was combined with entropy weights, giving 0.717 for deformation and 0.283 for hardness. The weighting reflects the fact that dimensional accuracy is the primary constraint, while hardness must remain above the service threshold.
The significance ranking from the entropy-weighted analysis was:
boost time > diffusion time > diffusion carbon potential > carburizing temperature > boost carbon potential.
Interaction analysis showed that the boost-time × diffusion-time pair had the strongest influence on the combined response. The interactions involving boost carbon potential were the weakest. Using the maximum-membership principle, the selected carburizing condition was 920 °C, 0.80% boost potential, 2.5 h boost, 0.90% diffusion potential, and 1.0 h diffusion. The verification simulation gave 0.0966 mm deformation and 62.6 HRC. Control runs with one factor shifted gave 0.0972–0.1020 mm and 61.9–62.8 HRC, so the selected condition achieved the lowest deformation while remaining in the high-hardness band.
Relative to the maximum deformation of 0.151 mm in the first screen, 0.0966 mm represents about a 36% reduction. The result is best interpreted as a boundary optimum: the boost time and diffusion time sit at their lower limits, and the quench temperature in the preceding screen was also at its lower limit. Further reduction would require evidence outside the tested ranges and must still satisfy case-depth and hardness requirements.
Third Stage: Grey Relational Quenching Optimization
With the carburizing schedule fixed, a 16-run, three-factor, four-level array was used for the oil-quench stage. The variables were quench temperature T1 (820–880 °C), quench time T2 (1200–2100 s), and oil temperature T3 (20–80 °C). Among the 16 runs, maximum deformation was 0.124 mm and maximum surface hardness was 62.7 HRC. The core hardness fell to 34.5 HRC, with most core values below 40 HRC. This gradient is consistent with a carburized case over a tough core.
Grey relational analysis converted the two responses into a single relational grade. Deformation was normalized as smaller-the-better and hardness as larger-the-better; the distinguishing coefficient was 0.5. The range of the mean relational grade ranked the variables as:
oil temperature > quench temperature > quench time.
The selected quench condition was 820 °C, 1200 s, and 20 °C oil. The simulation gave 0.0966 mm and 62.6 HRC. A second-order model for the grey relational grade achieved R² = 97.04%, adjusted R² = 95.57%, F = 65.66, and P < 0.0001. The main-effect plots show that quench temperature has the steepest effect on deformation, while oil temperature has the steepest effect on hardness. The integrated grade ranks oil temperature first because it captures both responses.
The microstructure results explain the hardness pattern. After quenching, the core reached 96.3% martensite. The large-end tooth tip reached 16.3% retained austenite, while other regions remained below 10%. The high-carbon case lowers the martensite start temperature, so more austenite is retained at the surface; the lower-carbon core transforms more completely. This is also consistent with the concentration of distortion at the large-end tip, where a steep carbon gradient, a section-thickness change, and nonuniform cooling coincide.
Comparison of the Optimized Stages
Table 2. Selected conditions and simulated responses after each optimization stage.
| Stage | Method | Selected condition | D/mm | H/HRC |
|---|---|---|---|---|
| Initial screen | 27-run Box–Behnken design; response-surface method | 915 °C; 5.0 h boost; 2.27 h diffusion; 820 °C quench | 0.123 | 62.7 |
| Carburizing | Five-factor, four-level orthogonal array; entropy-weighted membership | 920 °C; 0.80% boost potential; 2.5 h; 0.90% diffusion potential; 1.0 h | 0.0966 | 62.6 |
| Quenching | Three-factor, four-level orthogonal array; grey relational analysis | 820 °C; 1200 s; 20 °C oil | 0.0966 | 62.6 |
Both the carburizing and quenching stages converge on a low-deformation condition with a surface hardness above 62 HRC in the simulation. The final schedule combines 920 °C carburizing, 0.80% boost potential for 2.5 h, 0.90% diffusion potential for 1.0 h, and oil quenching at 820 °C for 1200 s with 20 °C oil. The optimum for quench temperature, quench time, and oil temperature lies at the lower bound of each tested range, so the result should not be read as proof that still lower values would improve the process. It is a boundary solution within the experimental window.
Experimental Check
A gear was treated with the selected schedule and measured after carburizing and quenching. The specified hardness range was 58–64 HRC. Tooth-flank deviation was measured on a Gleason 650MS gear measuring machine using five tooth slots. The actual flank coordinates were compared with the theoretical flank, and the maximum deviation was taken as the local deformation. Surface hardness was measured on the mounting-face plane with a R(D)-150A1 Rockwell hardness tester.
Table 3. Simulation and experimental comparison after the selected treatment.
| Response | Simulation | Experiment | Maximum relative error | Observation |
|---|---|---|---|---|
| Maximum deformation | 0.0966 mm | 0.123 mm | 21.46% | Maximum deviation at the large-end addendum |
| Hardness on mounting-face plane | 58.5 HRC mean | 59.5–61.0 HRC | 4.10% | Measured values remain within the 58–64 HRC requirement |
The measured deformation ranged from 0.113 to 0.123 mm, compared with 0.0966 mm in the simulation. The relative error ranged from 14.51% to 21.46%. The important agreement is spatial: both simulation and measurement place the maximum distortion at the large-end tooth tip. The magnitude difference is more likely to come from simplified material data, literature-based heat-transfer coefficients, mesh resolution, actual furnace and oil-flow conditions, and measurement uncertainty than from a different distortion mechanism.
The measured hardness ranged from 59.5 to 61.0 HRC, while the simulation average on the corresponding plane was 58.5 HRC. The relative error was between 1.68% and 4.10%, below 5%. The mounting-face measurement is not a direct measurement of tooth-flank hardness, but it indicates that the bulk heat-treatment response is close to the model. The simulated tooth-tip hardness reached 62.6 HRC, and the measured values satisfy the 58–64 HRC requirement.
Interpretation, Limits, and Transferability
The results support a clear process hierarchy. Quench temperature and oil temperature are first-order levers for distortion and hardness because they control the cooling path and the extent of martensite formation. Boost time and diffusion time are second-order levers: they set the carbon profile and case depth, and long times improve hardness uniformity only up to the point where transformation strain and dimensional change become unacceptable. Carbon potential matters, but its pairwise interactions with the time variables are weaker than the boost-time × diffusion-time interaction.
The simulation underpredicted maximum deformation by roughly 15–21%. That level of error is useful for ranking and screening but not sufficient for final tolerance allocation without calibration. A production model should use measured cooling curves for the actual oil and agitation condition, a validated transformation dataset for the specific heat, and a mesh refined near the large-end tip. A single experimental batch also cannot represent furnace-to-furnace or batch-to-batch variation. The response-surface and grey-relational models are empirical fits within the tested ranges; they should not be extrapolated to other gear sizes, section thicknesses, or steels without new validation.
The boundary nature of the optimum is equally important. Quench temperature 820 °C, quench time 1200 s, and oil temperature 20 °C are all lower limits of the tested windows. The data show that these values gave the best combined response among the tested conditions, not that lower values would be better. Lower oil temperature, for example, changes viscosity and cooling uniformity; lower quench temperature may reduce distortion but can compromise hardness or increase retained austenite. Those trade-offs require separate experiments.
Engineering Takeaway
For 18Cr2Ni4WA spiral bevel gears, a coupled carburizing–quenching model combined with staged statistical optimization identified a practical low-distortion window: carburize at 920 °C with 0.80% boost potential for 2.5 h and 0.90% diffusion potential for 1.0 h, then oil-quench at 820 °C for 1200 s with 20 °C oil. The simulation gave 0.0966 mm maximum deformation and 62.6 HRC surface hardness. The experimental gear reached 0.123 mm maximum deformation and 59.5–61.0 HRC on the mounting-face plane, with the same large-end-tip distortion pattern. The approach does not eliminate physical trials, but it narrows the search space, exposes the dominant interactions, and provides a calibrated starting point for distortion control in spiral bevel gears.