
Spiral bevel gears transmit motion between intersecting shafts through teeth whose contact path runs diagonally across the flank rather than across the full face at once. This geometry gives a high contact ratio, gradual load transfer, and high torque capacity, which is why spiral bevel gears are common in aerospace, marine, and automotive drivelines. The same contact behavior also makes the gear pair sensitive to torque. As load rises, the teeth deflect, the contact pattern shifts, and the driven rotation departs from the ideal conjugate motion. The resulting loaded transmission error (LTE) is a major internal excitation. The relevant quantity is not only the mean LTE but also its peak-to-peak fluctuation, because that fluctuation repeats once per mesh cycle and can excite structural resonances.
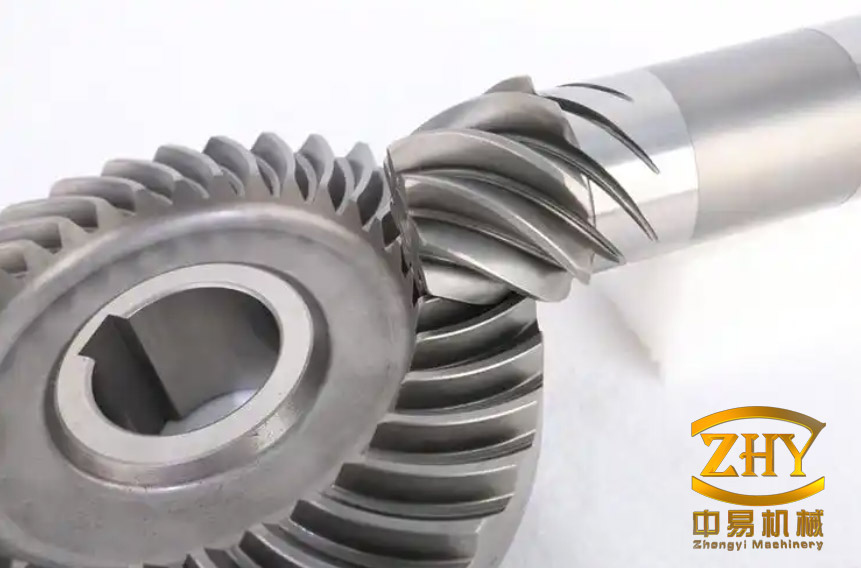
A MASTA-based simulation of a 16-tooth pinion and a 27-tooth wheel was used to examine how LTE fluctuation changes with driven torque and how the vibration and noise response follows. Five torque levels were applied to the wheel: 5, 10, 20, 50, and 100 N·m. The analysis combined tooth contact analysis, a transmission-system model with shafts and bearings, modal superposition, and output metrics in the frequency and speed domains. The central result is non-monotonic: LTE fluctuation first falls and then rises with load, and the vibration and noise metrics follow the same ranking. The minimum occurred at 20 N·m, not at the highest or lowest load.
Loaded transmission error as a contact excitation
Transmission error is the difference between the actual angular position of the driven gear and the position that would result from perfect conjugate motion. Under light load, the contact may be concentrated on a limited part of the flank, and elastic deflection can produce a relatively large motion error. As torque increases, more teeth share the load, the contact ratio rises, and the motion error can become smoother. This is why an increase in load does not necessarily increase vibration. The trend reverses when the contact reaches the tooth boundary. Edge contact introduces a sharp change in contact stiffness and load distribution, and the LTE curve rises rapidly. In the present gear set, the transition between these two regimes is the main reason for the non-monotonic response.
The tooth contact analysis gave a geometric transmission error amplitude of 10.313 arcsec on the concave side of the wheel. This value represents the no-load geometric component. The LTE under torque includes this geometric component plus elastic deflection, contact-pattern shift, and the effect of load sharing among adjacent teeth. The peak-to-peak fluctuation of the LTE curve is therefore a more direct measure of dynamic excitation than the absolute transmission error at a single contact position.
Gear pair and transmission-system model
The basic geometry of the pair is listed in Table 1. The pinion has 16 teeth and the wheel has 27 teeth, with a module of 4.25 mm, a midpoint spiral angle of 35°, a normal pressure angle of 20°, and a 90° shaft angle. The face width is 17 mm, and the outer cone distance is 66.693 mm. The pinion is left-hand and the wheel is right-hand. Teeth were generated with a cutter radius of 76.2 mm, and the contact trace on the wheel concave flank was checked before the dynamic model was assembled.
| Parameter | Value |
|---|---|
| Number of teeth | 16 (pinion), 27 (wheel) |
| Module | 4.25 mm |
| Midpoint spiral angle | 35° |
| Normal pressure angle | 20° |
| Shaft angle | 90° |
| Face width | 17 mm |
| Hand | Left (pinion), right (wheel) |
| Outer cone distance | 66.693 mm |
| Pitch cone angle | 30.6507° (pinion), 59.3493° (wheel) |
| Face cone angle | 35.3501° (pinion), 62.2108° (wheel) |
| Root cone angle | 27.7832° (pinion), 54.6499° (wheel) |
| Addendum | 3.34 mm (pinion), 5.48 mm (wheel) |
| Dedendum | 4.68 mm (pinion), 2.54 mm (wheel) |
| Clearance | 0.8 mm |
The transmission-system model included the gear pair, input and output shafts, and bearings. The pinion was the driving member and carried the input speed; the wheel was the driven member and carried the applied torque. Condensation nodes on the input and output shafts coupled the gear, shaft, and bearing degrees of freedom, and modal superposition was used to calculate displacement, velocity, and acceleration responses. This modeling approach allows the gear mesh excitation to be propagated through the shaft and bearing structure without treating the gear pair as an isolated component.
Loaded transmission error under five torques
At 5, 10, and 20 N·m, the LTE curve remained within the range of the geometric transmission-error curve, which indicates that the loaded contact stayed inside the designed tooth flank. At 50 and 100 N·m, the LTE curve passed beyond the right endpoint of the geometric range, which indicates edge contact. This distinction is important: the low- and medium-load cases represent normal meshing with increasing load sharing, while the high-load cases enter a contact condition that the flank design does not support smoothly.
| Driven torque | LTE maximum (arcsec) | LTE minimum (arcsec) | LTE fluctuation (arcsec) | Peak acceleration (m/s²) | Frequency of peak (kHz) | Mode order |
|---|---|---|---|---|---|---|
| 5 N·m | 15.9 | 8.976 | 6.924 | 8,588 | 4.08 | 12th |
| 10 N·m | 19.76 | 14.8 | 4.96 | 6,315 | 4.50 | 12th |
| 20 N·m | 26.68 | 24.65 | 2.03 | 1,569 | 5.00 | 12th |
| 50 N·m | 49.19 | 42.44 | 6.75 | 7,150 | 5.84 | 15th |
| 100 N·m | 75.73 | 65.37 | 10.36 | 18,561 | 6.35 | 15th |
The LTE fluctuation fell from 6.924 arcsec at 5 N·m to 4.96 arcsec at 10 N·m and to 2.03 arcsec at 20 N·m. It then rose to 6.75 arcsec at 50 N·m and 10.36 arcsec at 100 N·m. The 20 N·m minimum is about 29% of the 5 N·m value and about 20% of the 100 N·m value. Beyond 20 N·m, the trend reverses sharply: the fluctuation at 100 N·m is about 5.1 times the minimum. Although the mean LTE level increases with torque, the dynamic excitation is governed mainly by the modulation of the LTE curve, not by its absolute level.
Modal shift and resonance response
The natural frequencies of the transmission system are not fixed, because mesh stiffness increases with load. For a system with effective mass \(m\) and mesh stiffness \(k\), the natural frequency scales as
$$\omega = \sqrt{\frac{k}{m}}.$$
An increase in mesh stiffness therefore raises the natural frequencies of the same order. Selected values are listed in Table 3. The first order rose from 0.624 kHz at 5 N·m to 1.053 kHz at 100 N·m, the 7th order from 1.932 to 2.379 kHz, the 12th order from 4.088 to 5.613 kHz, and the 15th order from 5.537 to 6.353 kHz. The 20th order remained near 13.1 kHz, so the lower orders experienced the larger relative shift.
| Load | 1st (kHz) | 7th (kHz) | 12th (kHz) | 15th (kHz) | 20th (kHz) |
|---|---|---|---|---|---|
| 5 N·m | 0.6239 | 1.9322 | 4.0876 | 5.5366 | 13.0645 |
| 10 N·m | 0.7079 | 2.0205 | 4.5177 | 5.5604 | 13.0994 |
| 20 N·m | 0.8014 | 2.1204 | 5.0017 | 5.5911 | 13.1446 |
| 50 N·m | 0.9395 | 2.2654 | 5.4120 | 5.8396 | 13.2239 |
| 100 N·m | 1.0532 | 2.3785 | 5.6128 | 6.3528 | 13.2876 |
Vibration acceleration waterfall diagrams were calculated over a speed sweep using the first mesh order. A strong peak appears when the mesh frequency coincides with a natural frequency. At 5 N·m, the maximum acceleration was 8,588 m/s² at 4.08 kHz, close to the 12th natural frequency, with additional peaks at 1.932, 3.311, and 5.875 kHz. At 10 N·m, the maximum was 6,315 m/s² at 4.50 kHz, again near the 12th order, with peaks at 2.02, 3.481, and 5.996 kHz. At 20 N·m, the maximum dropped to 1,569 m/s² at 5.00 kHz, near the 12th order, with peaks at 2.12, 3.645, 5.538, and 6.149 kHz.
The high-load cases show a different dominant mode. At 50 N·m, the maximum was 7,150 m/s² at 5.84 kHz, near the 15th natural frequency, with peaks at 2.265, 3.874, 5.5, and 6.41 kHz. At 100 N·m, the maximum reached 18,561 m/s² at 6.35 kHz, also near the 15th order, with peaks at 2.379, 4.06, and 6.658 kHz. Not every natural frequency produces a strong response; the dominant resonance depends on the load-dependent frequency shift and on which excitation order is crossed during the speed sweep.
The ranking of peak acceleration follows the ranking of LTE fluctuation: 20 N·m is lowest, followed by 10, 50, 5, and 100 N·m. The 20 N·m peak is about 4.0 times lower than the 10 N·m peak, 4.6 times lower than the 50 N·m peak, 5.5 times lower than the 5 N·m peak, and 11.8 times lower than the 100 N·m peak. The correspondence between the two rankings supports the interpretation that reducing LTE fluctuation reduces the resonant response of the transmission system.
Fixed-speed spectrum and noise
The waterfall diagram emphasizes resonance during a speed sweep. A fixed-speed spectrum was also evaluated at an input speed of 600 r/min, where the mesh frequency is 0.16 kHz for the 16-tooth pinion. At this speed, the mesh frequency is well below the first natural frequency of the system, so the response is forced rather than resonant. For both the pinion and the wheel, the acceleration amplitude at 0.16 kHz was lowest at 20 N·m. The amplitudes at 10, 50, 5, and 100 N·m increased in that order.
Noise curves calculated over an input speed range of 500 to 1,000 r/min showed the same sequence. The noise level was lowest at 20 N·m, followed by 10, 50, 5, and 100 N·m. Because the fixed-speed spectrum and the noise curves reproduce the ranking obtained from the waterfall peaks, the effect is not limited to resonance. The LTE fluctuation also controls the forced response during normal meshing.
Design implications
For this spiral bevel gear pair, the 20 N·m condition represents a balance between two competing effects. The load is high enough to increase contact ratio and distribute load over a larger part of the flank, which smooths the motion error. It is not high enough to push the contact to the tooth boundary and trigger edge contact. At 50 and 100 N·m, the contact leaves the designed range, LTE fluctuation rises, and both resonant and forced vibration increase. A design that is quiet at one torque level can therefore become noisy at another, and a single-load evaluation may miss the worst condition.
Peak-to-peak LTE fluctuation is a practical objective for reducing vibration and noise in spiral bevel gear systems, but it should be evaluated over the full operating torque range. Tooth-flank modification, contact ratio, and load distribution can be tuned to keep the loaded contact inside the flank and to avoid the sharp stiffness change associated with edge contact. Because the present results come from a finite-element and modal-superposition model, experimental validation under representative loads is still required. Bearing clearance, shaft misalignment, housing stiffness, lubrication, and manufacturing variation can shift the optimum load and the dominant resonance order.