
Resonance risk in disk-shaped spiral bevel gears
Spiral bevel gears transfer motion and torque between intersecting shafts with a high contact ratio, high load capacity, low vibration and noise, and strong tooth bending strength, which is why they dominate aero-engine accessory and central drives as well as vehicle axles. The same geometry that gives them their load capacity also makes them vulnerable: the web of a bevel gear is a disk, and a disk loaded at high speed by an alternating mesh force supports nodal-diameter modes whose nodal lines run radially through the web. Once the mesh excitation coincides with the frequency of a wave rotating with or against the disk, the response is no longer bounded by stiffness alone and the gear can fail by fatigue rather than by static overload.
Documented service experience points consistently at this mechanism. Bench testing of the centre bevel gear in an accessory gearbox showed that axial vibration dominates the response and that most destructive events in that component are traveling wave resonances. Examination of fragment failures in two disk-type bevel gears traced the origin to high circumferential stress at the roots of the rim slots. Analysis of the same failure class identified the small-end slot bottom as the location of maximum circumferential tensile stress during nodal-diameter resonance, and therefore the most likely fatigue origin, while also showing that only certain harmonics of the mesh force are strong enough to drive large nodal-diameter amplitudes. A separate test campaign on a central-drive bevel gear catalogued the failure modes and structural dynamic characteristics of the component and identified the dominant excitation factors, and finite element work on thin-web aero-engine gears has used modal superposition to obtain steady-state response under normal meshing. What has been less developed is a system-level prediction that starts from a generated tooth surface rather than a nominal one, and that keeps the actual meshing contact in the model used for the modal calculation. The analysis below is organised around that requirement.
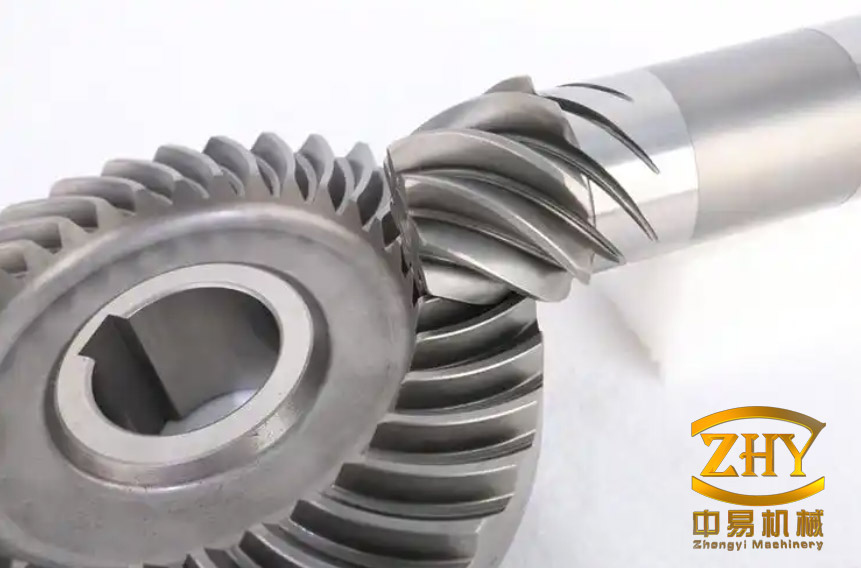
A system model built from an accurate tooth surface
The test article consists of one spiral bevel gear pair, two gear shafts and six bearings. Only the pair and the shafts are meshed as full three-dimensional solids; the casing and the bearings enter the model as stiffness matrices applied at the bearing seats. This keeps the model size tractable while preserving the compliance path that governs the disk modes, since the support stiffness — not the tooth stiffness — sets the frequency of the low nodal-diameter families.
Flank generation from design and machine settings
The final flank of a spiral bevel gear is not determined by the design data alone. The generating motion of the cutter head, described by the machine settings, decides the local curvature and therefore the contact pattern. Both data sets were therefore used. Macro geometry was first built from the design parameters in Table 1; the manufacturing settings in Table 2 were then applied to generate the flanks and export the point grid — 7 points along the profile by 9 along the face — together with a separate point set for the root fillet. As an example, the wheel was generated with a cutter head radius of 82.156 mm, a cradle angle of 62.3772°, a roll ratio of 1.5342 and second- and third-order modified roll coefficients of −0.003 594 and 0.007 878.
| Parameter | Pinion | Wheel |
|---|---|---|
| Number of teeth | 40 | 41 |
| Module (mm) | 3.24 | |
| Mid-point spiral angle (°) | 35 | |
| Normal pressure angle (°) | 20 | |
| Shaft angle (°) | 80 | |
| Face width (mm) | 26 | |
| Hand | Right | Left |
| Outer cone distance (mm) | 102.077 | |
| Pitch cone angle (°) | 39.406 5 | 40.593 5 |
| Face cone angle (°) | 41.322 7 | 42.451 4 |
| Root cone angle (°) | 37.548 6 | 38.677 3 |
| Dedendum (mm) | 3.298 | 3.428 |
| Addendum (mm) | 2.819 | 2.689 |
| Setting | Wheel | Pinion, concave | Pinion, convex |
|---|---|---|---|
| Cradle angle (°) | 62.377 2 | 62.228 8 | 61.310 0 |
| Offset (mm) | 0 | 0 | 0 |
| Machine centre to mounting face (mm) | 0 | 11.545 | −4.711 |
| Blank mounting angle (°) | 38.67 | 37.56 | 37.56 |
| Second-order modified roll coefficient | −0.003 594 | 0.071 06 | −0.048 65 |
| Third-order modified roll coefficient | 0.007 878 | −0.021 54 | 0 |
| Cutter head radius (mm) | 82.156 | 89.422 | 79.983 |
| Roll ratio | 1.534 2 | 1.761 1 | 1.510 2 |
| Sliding base (mm) | −0.089 9 | −7.038 | 2.871 |
| Cutter swivel angle (°) | 207.36 | 26.51 | 27.61 |
| Cutter tilt angle (°) | 0 | 0 | 0 |
The point grid was then used to build the solid: splines through the exported points, a meshed surface through the resulting curve network, a blank to trim against it, and a circular pattern to complete the tooth ring. The same procedure applied to both members produces an assembled pair whose flanks deviate from the theoretical generated surface only by the density of the point grid. All shafts and gears are 9310 steel, with a Young’s modulus of 204 GPa, a density of 7 850 kg/m³ and a Poisson’s ratio of 0.293.
Support stiffness and contact definition
Six bearing seats carry the assembly, each represented by a three-directional stiffness (Table 3). The axial stiffness at seats A, C, D and E is 1 N/mm, so those bearings are effectively free in Z and the axial location of each shaft is provided by a single bearing — F on one shaft, B with its 34 243 N/mm axial stiffness on the other. The flanks are brought into contact with a frictional law of coefficient 0.1, which is retained in the static step that precedes the modal extraction.
| Seat | A | B | C | D | E | F |
|---|---|---|---|---|---|---|
| X | 319 550 | 69 973 | 338 250 | 448 380 | 307 540 | 262 930 |
| Y | 319 550 | 69 973 | 338 250 | 448 380 | 307 540 | 262 930 |
| Z | 1 | 34 243 | 1 | 1 | 1 | 139 850 |
Traveling wave kinematics and the resonance condition
For a disk at rest in the reference frame, the transverse displacement of a point on the web is written as
$$z = A(r)\cos(m\theta)\cos(\omega t)$$
where \(z\) is the transverse displacement, \(A(r)\) the radial amplitude distribution, \(r\) the radius, \(m\) the number of nodal diameters, \(\theta\) the circumferential angle, \(\omega\) the angular frequency and \(t\) time. Seen from a frame fixed in space while the gear rotates, the same standing pattern separates into two waves of equal amplitude travelling in opposite directions:
$$z = \tfrac{1}{2}A(r)\left[\cos(m\theta – \omega t) + \cos(m\theta + \omega t)\right]$$
In a frame fixed to the ground, the two branches appear at frequencies shifted away from the nodal-diameter natural frequency \(f_d\) by an amount proportional to the nodal diameter count and the speed:
$$f_f = f_d + \frac{z_1}{z_2}\frac{n m}{60}, \qquad f_b = f_d – \frac{z_1}{z_2}\frac{n m}{60}$$
with \(z_1\) and \(z_2\) the tooth counts of pinion and wheel and \(n\) the pinion speed in r/min. Resonance occurs when an excitation harmonic in the same frame equals one of these branch frequencies. With the mesh frequency \(f_e = n z_1/60\),
$$f_e = f_{f,b} \quad\Longrightarrow\quad n = \frac{60 f_d}{z_1 (z_2 \mp m)/z_2}$$
the minus sign in the denominator applying to the forward wave and the plus sign to the backward wave. The practical content of this relation is that each nodal-diameter mode produces two resonance speeds, one on either side of the value that would be obtained from the natural frequency alone, and that the separation grows with \(m\).
Prestressed modal analysis of the gear system
A modal extraction cannot retain the nonlinear friction contact, and tying the flanks together would replace the real mesh coupling with an artificial bond of far higher stiffness. The system was therefore linearised about a static equilibrium. In the static step the pinion convex flank drives the wheel concave flank under a torque of 100 N·m applied to the pinion, with the wheel rotationally constrained. The resulting contact pattern is centred on the tooth and free of edge contact, and the peak stress is 34.081 MPa — low enough that the mesh itself is not the limiting feature. That stress state was then used as the initial condition for the modal calculation, which covered modes up to 22 kHz.
| Mode | Frequency (Hz) | Pinion | Wheel |
|---|---|---|---|
| 1 | 3 074.7 | 1 ND | 1 ND |
| 2 | 3 274.9 | — | 1 ND |
| 3 | 3 493.2 | 1 ND | 1 ND |
| 4 | 4 293.6 | 1 ND | — |
| 5 | 4 540.1 | 2 ND | — |
| 6 | 4 636.7 | 2 ND | 2 ND |
| 7 | 4 776.4 | — | 2 ND |
| 8 | 5 418.9 | 2 ND | 2 ND |
| 9 | 7 225.0 | Umbrella | Umbrella |
| 10 | 7 328.4 | Umbrella | Umbrella |
| 11 | 9 594.8 | — | 3 ND |
| 12 | 9 612.9 | 3 ND | 3 ND |
| 13 | 9 629.5 | 3 ND | — |
| 14 | 9 944.9 | 3 ND | 3 ND |
| 15 | 11 548 | High-order 2 ND | — |
| 16 | 11 604 | High-order 2 ND | — |
| 17 | 14 145 | Umbrella | — |
| 18 | 15 881 | — | 4 ND |
| 19 | 15 933 | 4 ND | 4 ND |
| 20 | 16 020 | 4 ND | — |
| 21 | 16 099 | 4 ND | 4 ND |
| 22 | 16 154 | — | High-order 2 ND |
| 23 | 16 245 | 4 ND | High-order 2 ND |
Two features of the modal set matter for prediction. First, each nodal-diameter count appears at several frequencies rather than one, because the two gears and their shafts vibrate as a coupled system: the 2-ND family spans 4 293.6 Hz to 5 418.9 Hz, the 3-ND family spans 9 594.8 Hz to 9 944.9 Hz, and the contact coupling even produces high-order 2-ND modes at 11.5 kHz and near 16.2 kHz. Second, the pinion and wheel nodal-diameter frequencies are close to one another — 4 540.1 Hz against 4 776.4 Hz for 2 ND, 9 594.8 Hz against 9 629.5 Hz for 3 ND — so the two members respond in nearly the same speed range. The modal families are also well separated in frequency, in the order 1 ND, 2 ND, umbrella (axisymmetric), 3 ND, 4 ND. That separation makes modal identification from a measured spectrum straightforward, but it makes detuning difficult: shifting a family away from an operating speed tends to move it toward another.
Predicted resonance bands and the Campbell map
Converting the extracted frequencies to input-shaft speed with the transmission ratio of the gear set under test (47/43) and plotting them against the mesh-order lines produces the Campbell maps used for prediction. Each intersection of a mesh-order line with a natural frequency line is a candidate resonance speed, and the pairs of branches from Eq. (4) broaden each nodal-diameter family into a band. Table 5 collects the resulting bands together with the modal frequencies that generate them.
| Family | Modal frequencies (Hz) | Predicted band (r/min) | Measured band (r/min) | Deviation, lower / upper edge |
|---|---|---|---|---|
| 1 ND | 3 074.7–3 493.2 | 4 117–6 043 | not observed | — |
| 2 ND | 4 293.6–5 418.9 | 6 060–7 828 | 6 002–7 896 | +0.96% / −0.86% |
| Umbrella | 7 225.0–7 328.4 | 9 915–10 057 | no distinct peak reported | — |
| 3 ND | 9 594.8–9 944.9 | 12 270–14 754 | 12 270–14 360 | 0% / +2.74% |
| High-order 2 ND | 11 548–11 604 | 15 093–15 166 | outside measured peaks | — |
| 4 ND | 15 881–16 245 | above 20 000 | outside the 0–16 000 r/min range | — |
The order of events with rising speed is therefore: 1-ND resonance between 4 117 and 6 043 r/min, 2-ND resonance between 6 060 and 7 828 r/min, the axisymmetric umbrella mode near 10 000 r/min, and 3-ND resonance between 12 270 and 14 754 r/min. The 4-ND family sits at 15.9–16.2 kHz, which places its resonance speeds well beyond the 16 000 r/min test limit. Amplitude at any of these speeds is not predicted by this procedure; it depends on system damping and on how the force path from the mesh reaches the point of interest, so the calculation identifies where resonance is possible, not how severe it will be.
Spin test and correlation
The gear system was run on a back-to-back test bench with a three-directional accelerometer on the casing adjacent to the test article. Speed was swept from 0 to 16 000 r/min at 50–100 r/min/s while a constant load of (30 ± 2) N·m was applied at the output, and vibration was recorded throughout the run-up. The three measurement directions gave essentially the same trend, with clearly defined peaks and bands: a discrete peak at 6 002 r/min, a band from 6 836 to 7 896 r/min, and a band from 12 270 to 14 360 r/min.
Against the prediction, the 2-ND and 3-ND bands agree closely. The lower edge of the 2-ND band is predicted 0.96% above the measured value and the upper edge 0.86% below it; the 3-ND band starts at exactly the measured speed and its upper edge is predicted 2.74% high. The largest discrepancy in the whole comparison is therefore under 3%, which is small compared with the width of the bands themselves and is adequate for planning a test or a control schedule.
The 1-ND band predicted between 4 117 and 6 043 r/min was not found in the measurement, and two effects are consistent with that outcome. A one-nodal-diameter mode is the mode most sensitive to the boundary conditions at the bearing seats, so a modest difference between the stiffness of the rig and the stiffness assumed in the model displaces it appreciably. In addition, the response at a single transducer location is governed by damping and by the transmission path, so a resonance can exist in the structure and remain invisible at that point. Neither effect weakens the correlation obtained for the higher families, where the modal mass is distributed over the web and the frequencies are far less sensitive to support detail.
What the correlation means for design
The workflow — generated flanks from design and machine settings, a static contact solution, a prestressed modal extraction of the full gear-and-shaft system, and a traveling-wave post-processing step — predicts resonance bands that match spin-test data to within about 3% for the 2-ND and 3-ND families. For an aero-engine application that is enough to define avoidance measures before a test campaign: run quickly through the identified bands, or introduce damping hardware such as a damping ring at the rim, where the nodal-diameter motion is largest. The measured behaviour supports the second option as the more robust one, since the families here are widely separated in frequency and closely spaced between the two members, which leaves little room for detuning by geometry alone.
Three limitations belong with the results. The prediction is kinematic in the sense that it locates resonance speeds from natural frequencies and mesh orders and does not estimate amplitude, so it cannot rank the severity of one band against another without a forced-response calculation. The prestress used for the modal step comes from the static mesh load only; rotational stiffening and gyroscopic coupling of the spinning assembly are not represented, which will bias the predicted frequencies low, and more so for the low nodal-diameter modes of the large wheel. And the linearisation of the contact about a single static position removes the load-dependent variation of mesh stiffness that broadens real resonance bands. These are the natural next refinements, and they matter most exactly where this comparison is weakest — the one-nodal-diameter range.