
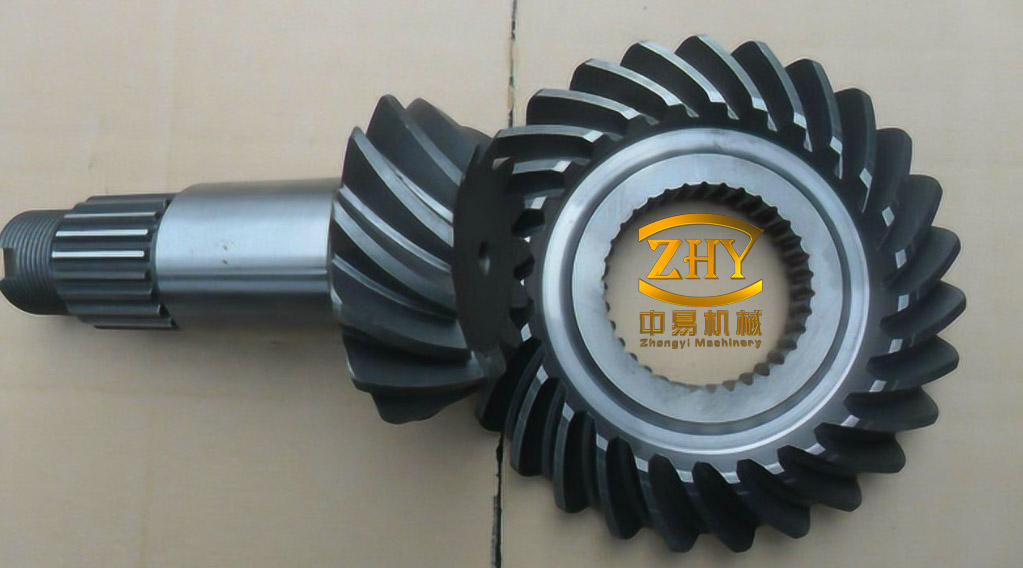
Double circular arc (DCA) spiral bevel gears are used where a right-angle drive must carry high torque with relatively low noise. Their tooth profile is formed from two circular arcs, so the contact line and contact area change continuously through mesh. Under variable-speed operation, this geometric nonlinearity combines with a time-varying mesh frequency, producing a vibration spectrum dominated by mesh harmonics and sidebands. A tooth-root crack generates weak, low-oscillation impulses; these are easily buried under the mesh components. Effective detection therefore becomes a problem of separating a weak impulsive component, enhancing it, selecting the frequency band that carries it, and removing the first-order influence of speed before classification.
Why Variable Speed Obscures Crack Signatures
At a local contact point, the Hertzian contact half-width can be approximated as
$$a=\left(\frac{6F_nR_1R_2}{\pi E'(R_1+R_2)}\right)^{1/3}$$
where Fn is the normal load, E′ is the composite elastic modulus, and R1 and R2 are the curvature radii of the two contacting surfaces. The local mesh stiffness is then represented by
$$k(t)=\frac{F_n}{\delta(t)}$$
with δ(t) the elastic deformation at the contact. For a DCA spiral bevel gear, the two-arc profile causes R1, R2, and the contact position to vary through the mesh cycle. The result is a periodically varying, nonlinear mesh stiffness rather than a constant spring rate. A single-degree-of-freedom representation of the gear pair is
$$m\ddot{x}(t)+c\dot{x}(t)+k(t)x(t)=F(t)$$
where m is the equivalent mass, c is damping, x(t) is the vibration response, and F(t) contains mesh impact and transmission-error excitation.
The mesh frequency is
$$f_m(t)=\frac{z\,\omega(t)}{2\pi}$$
where z is the tooth count and ω(t) is angular speed. As the shaft speed ramps, fm and its harmonics sweep across the spectrum. A crack-related component scales with shaft speed as well, so a fixed-frequency peak smears under acceleration. In a constant-speed spectrum, a crack may appear as shaft-order components or as modulation sidebands around the mesh frequency; under a speed ramp, those features move and overlap with adjacent harmonics. Direct spectral inspection of the raw signal is therefore unreliable.
The physical prior used in the detection pipeline is that crack-induced impacts have lower oscillation than the dominant mesh harmonics and can be sought in a low-frequency resonance component. This is a useful prior, not a universal law: a crack that excites a high-frequency structural resonance would require a different band selection.
Separating Low-Frequency Resonance from Mesh-Dominated Vibration
The measured signal is modelled as a sum of a high-frequency resonance component, a low-frequency resonance component, and noise:
$$x(t)=x_h(t)+x_l(t)+n(t)$$
A multirate filter bank supplies two wavelet dictionaries: a high-quality-factor dictionary Dh for the high-frequency resonance, and a low-quality-factor dictionary Dl for the low-frequency resonance. The signal is represented sparsely in the combined dictionary:
$$x(t)=D_h\alpha_h+D_l\alpha_l+n(t)$$
Morphological component analysis separates the two components by solving
$$\min_{\alpha_h,\alpha_l}\left\{\|x-D_h\alpha_h-D_l\alpha_l\|_2^2+\lambda_h\|\alpha_h\|_1+\lambda_l\|\alpha_l\|_1\right\}$$
where the quadratic term preserves reconstruction fidelity and the ℓ1 terms enforce sparsity. The split augmented Lagrangian shrinkage algorithm (SALSA) solves this problem iteratively; the reconstructed components are
$$x_h(t)=D_h\alpha_h^*,\qquad x_l(t)=D_l\alpha_l^*$$
The low-frequency component is retained because it is the part of the response in which weakly oscillatory crack impulses are expected to survive. The high-frequency component, which is dominated by mesh harmonics and structural resonance, is set aside at this stage. The separation does not by itself prove the presence of a crack; it only changes the signal-to-interference ratio before envelope analysis.
Minimum-Entropy Deconvolution and Kurtosis-Guided Band Selection
Even after separation, the crack impulses in xl(t) may be smeared by the transmission path and masked by residual noise. Minimum-entropy deconvolution (MED) seeks an inverse filter w(n) such that
$$y(n)=w(n)*x_l(n)$$
has a sparse, impulse-like distribution. The filter is chosen to minimize an entropy-based objective, which in gear and bearing diagnostics tends to concentrate impulsive events while suppressing diffuse noise. In the reported configuration, the MED stage used 30 iterations.
The enhanced sequence is then analyzed by a short-time Fourier transform:
$$Y(f,t)=\sum_{n=1}^{N}y(n)g(n-t)e^{-j2\pi fn}$$
where g(n) is the analysis window. For each frequency band, the kurtosis is
$$K(f)=\frac{\mathbb{E}\left[|Y(f,t)|^4\right]}{\left(\mathbb{E}\left[|Y(f,t)|^2\right]\right)^2}$$
High kurtosis indicates a band containing sharp transient events. A kurtosis spectrum is formed by plotting K(f) across frequency, and the band with the strongest impulsiveness is selected for further processing. In the experimental parameter set, a kurtosis-spectrum threshold of 3 was used in the band-selection stage. The selected band was band-pass filtered, and its envelope was computed by the Hilbert transform:
$$e(n)=\sqrt{y’^2(n)+\left(\mathcal{H}\{y’\}(n)\right)^2}$$
The envelope spectrum follows from a discrete Fourier transform:
$$E(f)=\sum_{n=1}^{N}e(n)e^{-j2\pi fn/N}$$
Crack-related characteristic frequencies are then identified as peaks above a threshold T:
$$f_{\mathrm{fault}}=\{f_i: |E(f_i)|>T\}$$
This step is where most false positives can arise. Kurtosis is sensitive to any impulsive source, including bearing defects, loose components, or transient load reversals. A high-kurtosis band should therefore be checked against shaft orders, mesh harmonics, and the known kinematics of the gear pair rather than accepted as crack evidence on its own.
Speed Normalization and RBF Classification
A crack-related frequency scales with shaft speed, so the extracted frequency set is converted to a speed-independent order. With r(t) expressed in revolutions per second,
$$f_{\mathrm{norm}}=\frac{f_{\mathrm{fault}}}{r(t)}$$
If speed is recorded in revolutions per minute, the denominator becomes r(t)/60. The normalized frequency, together with envelope-spectrum amplitudes and kurtosis values, forms the input vector pi. A radial basis function (RBF) network maps this vector to a crack-severity class:
$$y_i=\sum_{j=1}^{H}w_j\phi_j\left(\|p_i-c_j\|\right)$$
where H is the number of hidden units, wj are output weights, φj are basis functions, and cj are center vectors. Training minimizes the least-squares classification error over labelled samples:
$$\min_{\{w_j,c_j,\sigma_j\}}\sum_{i=1}^{N}\left\|y_i-f(p_i)\right\|^2$$
The RBF network does not extract features; its role is to learn the mapping from the normalized feature vector to light, moderate, or severe crack states. Because the network can absorb residual nonlinearity, it must be trained across the speed range that will be encountered in service. A network trained only at constant speed would not be a valid test of variable-speed performance.
Experimental Configuration
The test rig used a DCA spiral bevel gear pair made of 18CrNiMo7-6 low-carbon high-alloy steel, with a 26-tooth pinion and a 122-tooth gear and a module of 12 mm. An asynchronous motor drove the gearbox through a speed ramp from 500 rpm to 3000 rpm, increasing by 500 rpm every 5 min. The maximum speed was 3000 rpm. Ambient conditions were 20 ± 5 °C and 50 ± 10% relative humidity in a low-background-noise laboratory. An accelerometer was mounted on the gearbox housing near the bevel gear mesh; its output was calibrated against a reference vibration signal before testing.
The data set contained 300 vibration records, balanced as 100 records each for light, moderate, and severe cracks. Four representative records were used for the displayed classification comparison. Signal-processing parameters are listed in Table 1.
| Parameter | Value |
|---|---|
| High-quality-factor wavelet dictionary | 5 |
| Low-quality-factor wavelet dictionary | 2 |
| Sampling frequency | 10,000 Hz |
| SALSA iterations | 50 |
| MED iterations | 30 |
| Kurtosis-spectrum threshold | 3 |
| Envelope-analysis band | 100–2000 Hz |
| FFT length | 4096 points |
| RBF learning rate | 0.01 |
| RBF training epochs | 1000 |
Detection Results
In the frequency-extraction comparison, the combined low-frequency separation, MED, kurtosis-band selection, and envelope analysis produced a clearer crack-related peak set than an improved deep-forest classifier and a low-rank sparse decomposition pipeline. The deep-forest baseline misclassified the light-crack record as moderate; the low-rank sparse decomposition baseline misclassified a moderate record as severe. The combined pipeline returned the correct class for all four displayed records (Table 2).
| Record | Actual severity | Improved deep forest | Low-rank sparse decomposition | Combined pipeline |
|---|---|---|---|---|
| 1 | Light | Moderate | Light | Light |
| 2 | Moderate | Moderate | Severe | Moderate |
| 3 | Severe | Severe | Severe | Severe |
| 4 | Moderate | Moderate | Moderate | Moderate |
The combined pipeline therefore achieved 4/4 agreement, or 100% on this four-record display set. That figure should not be read as a field accuracy. The four records were selected representatives, the train/test partition is not described in enough detail to establish independence, and the balanced 300-record data set does not represent the class distribution of an operating fleet.
In the signal-to-noise ratio sweep at 20, 10, and 5 dB, the combined pipeline maintained detection stability above 99%. The comparison set included the improved deep-forest and low-rank sparse methods plus an AR-MED/1D-CNN pipeline and an SCD-YOLO-based crack detector. The last two belong to different diagnostic or imaging traditions, so the comparison is best treated as an application-level benchmark rather than a controlled algorithm comparison. The stability metric itself is not fully specified; repeatability, classification accuracy, and robustness to threshold choice are not separated by a single percentage.
Interpretation and Limits
The method is physically motivated rather than a purely data-driven classifier. It uses three priors: crack impulses are weak and low-oscillation; the transmission path smears them; and the resulting fault components scale with shaft speed. The multirate filter bank isolates the low-frequency resonance, MED counteracts path smearing, kurtosis selects the most impulsive band, envelope analysis reveals modulation, and speed normalization converts the result into an order-like feature. The RBF network then classifies severity from that feature vector.
Several limitations follow directly from the experimental design. Only one gear pair, one material, and one speed ramp were tested; load, lubrication, temperature, and misalignment were not varied independently. The crack classes were artificially balanced, and the four displayed test records are too few to estimate sensitivity or false-alarm rate. The threshold T and the kurtosis threshold both affect which peaks are retained. MED can amplify non-crack impulses, and kurtosis can favor a bearing defect or a transient load event over a tooth crack. The RBF classifier requires labelled examples across the operating speed range, and its output is only as good as the feature set and the training coverage.
For practical use with DCA spiral bevel gears, the pipeline should be validated with a held-out test set spanning speed, load, and crack severity, and the results should be reported as a confusion matrix with confidence intervals rather than a single accuracy figure. Angular resampling or order tracking can complement the speed-normalized feature and reduce smearing when the speed ramp is aggressive. Multiple features—shaft-order amplitudes, sideband ratios, and band kurtosis—are more defensible than a single peak above threshold. Under those conditions, the combination of low-frequency separation, minimum-entropy enhancement, kurtosis-guided band selection, envelope analysis, and RBF classification provides a coherent framework for detecting crack-related changes in spiral bevel gears operating under variable speed.