
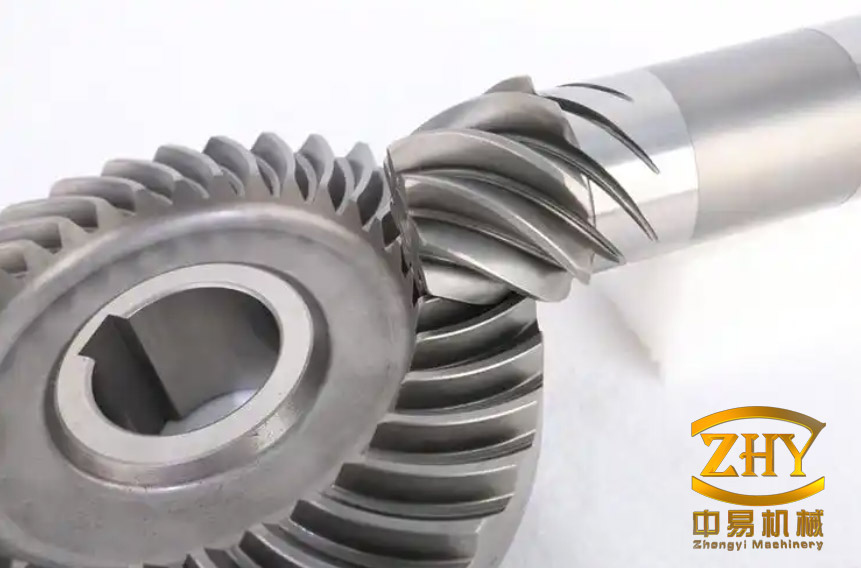
Spiral bevel gears transmit motion between intersecting shafts with gradual tooth engagement, low noise, and high load capacity, which makes them common in aerospace, marine, and heavy-machinery drives. Their limiting failure mode is often tooth-root fracture, and fracture is usually preceded by a crack that initiates in a region of high bending stress. Because the tooth is tapered and the spiral angle changes along the face width, the crack front is curved in three dimensions. A two-dimensional root-plane model cannot fully resolve how the local stress intensity varies along that front. Quenching adds a further three-dimensional field: compressive stress near the surface and tensile stress in the core. The competition between these fields determines whether a root crack is retarded or accelerated.
Gear geometry, mesh, and loading
The analysis considers a 20CrMnTi spiral bevel gear pair with 34 wheel teeth and 18 pinion teeth. The normal module is 2.117 mm, the spiral angle is 35°, the shaft angle is 90°, and the pressure angle is 20°. The material is treated as homogeneous elastic-plastic steel with a density of 7850 kg/m³, an elastic modulus of 207 GPa, and a Poisson ratio of 0.3. The plane-strain fracture toughness of 20CrMnTi is taken as 128 MPa·m1/2.
| Parameter | Value |
|---|---|
| Number of teeth, wheel / pinion | 34 / 18 |
| Normal module | 2.117 mm |
| Spiral angle | 35° |
| Shaft angle | 90° |
| Pressure angle | 20° |
The solid model is meshed with refined contact regions and a denser pinion mesh. Global structural elements are C3D8R, and the hourglass ratio ALLAE/ALLIE is kept below 1% to limit spurious deformation energy. Reference points coupled to the bore surfaces impose rotation about the gear axis while constraining the remaining degrees of freedom. The wheel is driven at 2220 r/min, and a 200 N·m torque is applied to the pinion. Under these conditions, the middle tooth of the pinion develops the highest root bending stress and contact force during meshing, so it is used as the representative tooth for crack analysis.
Four load levels are used to cover a range of tooth forces. The load is applied at the highest point of single-pair contact, where the root bending moment is most severe. The tangential force Ft and radial force Fr are varied together:
| Case | Ft (N) | Fr (N) |
|---|---|---|
| 1 | 4000 | 1000 |
| 2 | 5000 | 2000 |
| 3 | 6000 | 2000 |
| 4 | 7000 | 3000 |
Quenching residual stress: compression outside, tension inside
The quenching schedule starts at 850 °C, holds the gear in oil until it reaches 80 °C, and then air-cools it toward 25 °C. The transient analysis lasts 500 s, comprising 200 s of oil quenching and 300 s of air cooling. Heat transfer to the quench medium is represented by convection boundary conditions on the exposed surfaces, while two symmetry sections constrain the gear. The thermal and mechanical solutions are coupled sequentially: the temperature history drives the elastic-plastic stress response, and the resulting residual field becomes the initial condition for the fracture calculation.
Cooling is not uniform. The tooth tip and root surface lose heat faster than the core. Within the first 4 s, the tip falls to about 310 °C while the root and core remain near 365 °C. At the end of oil quenching, the tip is the coldest point. During air cooling, the surface approaches about 30 °C while the core remains the hottest region. This surface-to-core gradient is the origin of the residual stress pattern.
| Location | Early transient | Reversed transient | Stabilized residual stress |
|---|---|---|---|
| Root surface, point B | 335 MPa tension | 413 MPa compression | 78–239 MPa compression |
| Core, point C | 408 MPa compression | 430 MPa tension | 192–269 MPa tension |
At the root surface, the stress first becomes tensile as the surface contracts ahead of the core, reaches 335 MPa, and then reverses to compression with a transient peak of 413 MPa. After about 100 s the field stabilizes at a compressive residual stress between 78 and 239 MPa. The core behaves in the opposite sequence: early compression of 408 MPa is followed by tension of up to 430 MPa, stabilizing at 192–269 MPa tension. The resulting field is “compressive outside, tensile inside.” That description is a trend rather than a uniform value: the local stress at a crack-front node depends on its depth and position along the root.
XFEM representation of the crack path
Crack growth is simulated with the extended finite element method. The displacement field is enriched with a Heaviside function for elements cut by the crack and with near-tip branch functions for elements around the crack front:
$$
\mathbf{u}^{h}(\mathbf{x})=
\sum_{i\in I}N_i(\mathbf{x})\mathbf{u}_i+
\sum_{i\in I_c}N_i(\mathbf{x})H(\mathbf{x})\mathbf{a}_i+
\sum_{j=1}^{4}\sum_{i\in I_t}N_i(\mathbf{x})\phi_j(r,\theta)\mathbf{b}_{ij}
$$
Here, I is the set of all nodes, Ic contains nodes whose support is cut by the crack, and It contains nodes around the crack tip. Ni are the standard shape functions, H is the Heaviside jump function, and r and θ are local polar coordinates at the crack tip. The four branch functions reproduce the asymptotic near-tip field:
$$
\phi_1=\sqrt{r}\sin\frac{\theta}{2},\quad
\phi_2=\sqrt{r}\cos\frac{\theta}{2},\quad
\phi_3=\sqrt{r}\sin\frac{\theta}{2}\sin\theta,\quad
\phi_4=\sqrt{r}\cos\frac{\theta}{2}\sin\theta
$$
This enrichment allows the crack to advance through the mesh without remeshing the entire tooth. The computed path has four stages: initiation at the mid-root, stable growth along the tooth-face direction, stable growth in the depth direction, and final unstable growth. Initiation occurs at the mid-root in every load case, consistent with the static stress field. The crack first grows along the face direction and then turns into the depth direction; the face-direction growth rate is higher than the depth-direction rate.
Load magnitude changes the path but not the initiation site. Under case 1, the crack advances comparatively smoothly from the tension side toward the compression side. Under cases 2 and 3, it first follows the compression side and then turns toward the rim, with a larger deviation in case 3. Case 4 produces the largest path deviation. In all cases the crack eventually crosses the root section, so the differences are in trajectory and driving force rather than in the final failure location.
Stress intensity factors with and without residual stress
For the stress-intensity calculation, an initial crack of length 0.2 mm is introduced at the mid-root. The crack front is meshed with collapsed 20-node bricks. The crack-tip elements are converted to C3D20 singular elements, and their midside nodes are moved to the quarter-point positions to produce the r−1/2 stress singularity required by the contour integral. The stress intensity factors KI and KII are then evaluated along the three-dimensional crack front.
At the 0.2 mm crack length under case 3, the residual field raises the opening-mode driving force at the critical mid-root location. The maximum KI increases from 1598 to 1679 MPa·mm1/2, an increase of 81 MPa·mm1/2. The minimum KI rises from 91.96 to 179.2 MPa·mm1/2. The peak remains at the middle of the root, and the distribution retains an arch shape: high at mid-root and lower toward both ends, with the small end below the large end.
| Quantity | Without residual stress | With residual stress | Change |
|---|---|---|---|
| KI maximum | 1598 | 1679 | +81 |
| KI minimum | 91.96 | 179.2 | +87.24 |
| KII maximum | 148.7 | 133.0 | −15.7 |
| KII minimum | −180.8 | −153.4 | +27.4 |
All values are in MPa·mm1/2. The negative KII values denote the sliding direction; their magnitude is what matters for mixed-mode loading. The maximum KII with residual stress is about 8% of the maximum KI, so opening-mode loading controls propagation. The crack is therefore predominantly mode I.
The residual field has a dual local effect. Near the surface, compression tends to close the crack and reduce opening. In the core, tension tends to open it. The crack front samples both zones, and the calculated KI distribution is the superposition of these contributions. For this geometry, the tensile contribution is sufficient to raise the critical KI at mid-root even though the root surface itself is in compression. The arch shape is preserved because the bending stress and the residual tension both peak near the middle of the root.
For scale, 1679 MPa·mm1/2 is equivalent to about 53.1 MPa·m1/2, below the 128 MPa·m1/2 plane-strain toughness of the steel. The concern is therefore repeated-load crack growth under a locally elevated driving force, not single-cycle overload fracture.
Load sensitivity and the large-end/small-end asymmetry
Increasing the tooth load raises KI along the entire crack front but does not change the arch-shaped distribution or the mid-root location of the maximum. The same trend holds when residual stress is included: the curve shifts upward while keeping its middle-high, ends-low form. This means that higher torque accelerates crack growth without redirecting initiation away from the mid-root.
The two ends of the tooth do not respond equally. Across the load cases, the peak KI at the large-end node reaches 768.4 MPa·mm1/2, compared with 179.2 MPa·mm1/2 at the small-end node, a ratio of 4.29. The three nodal curves—large end, middle, and small end—remain relatively stable in shape as load increases. Crack growth along the face therefore proceeds fastest near the middle and is faster near the large end than near the small end.
This asymmetry follows from the face-width load distribution and the tapered tooth thickness. The large end carries a larger share of the load and has a longer crack-front ligament, while the small end has less tooth thickness. A faster local growth rate near the large end does not by itself mean earlier complete fracture: the greater thickness at that end leaves a longer remaining section, so the small end can still influence the final failure path and the time required to sever the tooth.
Crack-length sensitivity
Under case 4, the initial crack is extended from 0.2 to 0.4, 0.6, and 0.8 mm. As the crack lengthens, the peak KI increases while the arch-shaped distribution persists. The middle and large-end nodal curves vary nearly linearly with crack length. The small-end curve first rises and then falls. This non-monotonic response reflects the non-uniform load distribution across the face width: the large end carries more load, while the small end has less tooth thickness and a shorter remaining ligament.
Residual stress amplifies the small-end response. At that node, the peak KI with residual stress reaches 1.92 times the no-residual value as the crack length changes. The tensile part of the residual field promotes crack opening in the gear matrix, and the depth-direction growth rate increases with crack length. The large end again shows the higher absolute growth tendency, but its greater tooth thickness delays complete fracture relative to the small end.
Implications for design and inspection
The results separate two effects that are often treated together. A compressive residual stress at the root surface is beneficial because it opposes crack opening. A tensile residual stress in the core is detrimental because it adds to the opening drive at the critical mid-root location. Quenching therefore cannot be judged simply as “beneficial” or “detrimental” from a surface measurement alone. The through-thickness residual profile, and the local stress at the crack front, determine the net KI.
For spiral bevel gears, the mid-root remains the controlling initiation site, and the large-end side shows the highest local KI along the face. Inspection and life assessment should therefore cover the full root fillet rather than assuming that one end is representative. The tapered geometry means that the large end can have faster local crack growth while still providing a longer remaining ligament; the small end may control final fracture because less material remains.
The quantitative values are conditional on the thermal boundary conditions, the assumed convection coefficients, the elastic-plastic material data, and the four load cases. The thermal-mechanical model does not explicitly resolve phase-transformation plasticity or microstructural gradients, so the residual field is an approximation of the quenching process rather than a full metallurgical simulation. The stress-intensity comparisons indicate relative driving force; a calibrated fatigue-crack-growth law would be required to predict service life in cycles. Within those limits, the analysis shows that residual tension in the core can raise the opening-mode driving force at the root even when the surface is in compression, and that the large-end/small-end asymmetry is a geometric effect that persists across load levels and crack lengths.