
Why mesh quality of spiral bevel gears is hard to certify
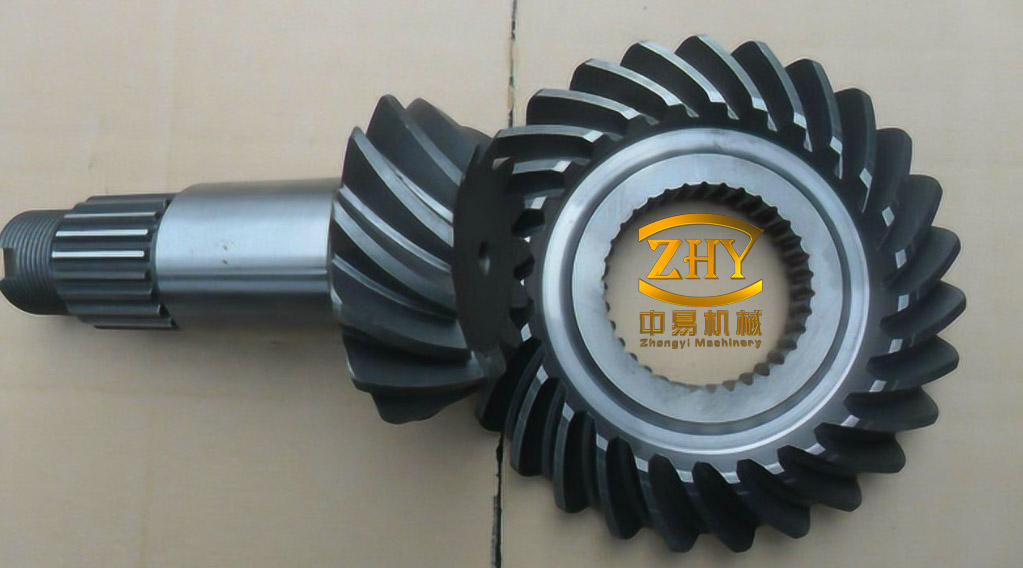
Spiral bevel gears transmit motion between intersecting shafts through teeth whose traces curve along the face width, so contact begins at one end of the tooth and rolls progressively across it. The resulting contact ratio is higher than that of straight bevel gears, the pair runs more smoothly and carries more load per unit of face width — the reason this tooth form dominates final drives, aviation gearboxes, machine-tool drives and heavy reducers. The same geometry makes quality control awkward. The conjugate flanks are established at cutting and grinding, but the meshing quality of an assembled pair depends on mounting distance, and a few hundredths of a millimetre along the axis is enough to move the load from the middle of the tooth towards its edges.
On the shop floor this is checked on a rolling inspection machine with marking compound. The pair is run with the teeth painted, then stopped and the footprint — its length, width and position between root and tip — is read by eye. Axial mounting errors of the wheel (ΔG) and of the pinion (ΔT) are absorbed by adjusting shims until the pattern sits where the drawing requires. The judgement is quick but qualitative: it depends on the inspector’s experience, is difficult to reproduce between operators, and says nothing about how the pair behaves while running.
Quantitative alternatives exist, each with a cost. Camera-based image processing can measure the area of a contact pattern (Men et al., 2017), but the machine must still be stopped, the teeth cleaned and repainted. Tooth contact analysis predicts how misalignment distorts the pattern (Simon, 2007; Wang et al., 2014; Su et al., 2017), yet it simulates a nominal pair rather than measuring the pair standing on the bench.
Acoustics offer an unobtrusive third route. The sound radiated by a running pair is generated by the same tooth impacts that load the flanks, so the mesh tone carries information about how evenly the teeth share load. Aero-engine gearing has already exploited this. Hu et al. (2019) combined an acoustic waveguide with resistance strain gauges to track resonance frequencies and dynamic stress across the full speed range of a turboshaft engine gear; Guo et al. (2023) measured travelling-wave resonance speeds of an aero-engine bevel gear without contact; Luan et al. (2020) built a derived-noise measurement scheme with dynamic system calibration for central-drive bevel gears.
The implementation discussed below instruments a rolling inspection machine with a single acoustic pressure sensor and processes the recording with maximum correlated kurtosis deconvolution (MCKD) whose two governing parameters are set by particle swarm optimization (PSO). The decision variable is the amplitude of the mesh frequency and its first harmonics.
How axial misalignment appears in the mesh tone
Every tooth engagement delivers a force pulse to the housing, and the pulses repeat at the mesh frequency, which is fixed by the pinion tooth count and the shaft speed:
$$f_m=z_1f_r,\qquad f_r=\frac{n}{60}$$
At the test speed of n = 740 r/min the shaft frequency is fr = 12.33 Hz and, for a 28-tooth pinion, the mesh frequency is fm = 345.33 Hz, with harmonics at 690.67 Hz (2fm) and 1 036.00 Hz (3fm). The spectrum of the radiated sound is therefore comb-shaped: a strong component at the mesh frequency plus a family of multiples whose relative heights describe how sharp the engagement is.
At nominal mounting distance the load is carried across the middle of the tooth, the force pulse is comparatively gentle and the harmonic family decays quickly. An axial deviation of the pinion shifts the contact towards the toe or the heel, concentrates load on a narrower band and increases the impact at entry and exit; the pulse sharpens and the amplitudes at fm and its multiples rise. That is the observable used here. With speed, instrumentation and mounting procedure held fixed, the amplitudes at fm, 2fm and 3fm serve as relative indices of mesh quality rather than as absolute sound-power values.
The time-domain record is a poor detector on its own: for a pair in acceptable condition the periodic impulses are buried in background noise and are not visually separable from it, so the spectral reading after deconvolution is what makes the change measurable.
PSO-tuned MCKD as the preprocessing stage
The recorded signal is modelled as a periodic impulse train passed through the transmission path, corrupted by noise:
$$y(u)=h(u)*x(u)+e(u)$$
where h is the path response and e the noise component. MCKD, introduced by McDonald et al. (2012), recovers x by designing a finite impulse response filter f that maximizes the correlated kurtosis of the filtered output at a chosen period T:
$$K_{MC}(T)=\max_{f}\frac{\sum_{r=1}^{R}\left(\prod_{m=0}^{M}x_{r-mT}\right)^{2}}{\left(\sum_{r=1}^{R}x_{r}^{2}\right)^{M+1}}$$
with M the maximum shift and R the number of samples in the analysis window. The maximizing filter has a closed form built from the signal matrix and its shifted copies:
$$\mathbf{f}=\frac{\lVert\mathbf{x}\rVert^{2}}{2\lVert\mathbf{B}\rVert^{2}}\left(\mathbf{Y}_{0}\mathbf{Y}_{0}^{\mathsf{T}}\right)^{-1}\sum_{m=0}^{M}\mathbf{Y}_{m}^{\mathsf{T}}\mathbf{A}_{m}$$
where B collects the shifted output vectors and Ym, Am the corresponding shifted input vectors and their powers. The period is not a free parameter; it follows from the mesh frequency:
$$T=\frac{f_s}{f_m}$$
At a sampling rate of 44 100 Hz and a mesh frequency of 345.33 Hz, T ≈ 128 samples.
Two parameters remain under the user’s control: the filter length L and the shift order M. They set the balance between capturing the impulse train and passing noise, and their suitable values vary with the signal, which makes manual tuning slow and poorly transferable between gear sets. PSO searches the pair directly. Each particle j carries a position s and a velocity v in the (L, M) plane and updates both from its own best position p and the swarm best g:
$$v_{jd}^{k+1}=w\,v_{jd}^{k}+c_1\eta_1\left(p_{jd}^{k}-s_{jd}^{k}\right)+c_2\eta_2\left(g_{d}^{k}-s_{jd}^{k}\right)$$
$$s_{jd}^{k+1}=s_{jd}^{k}+v_{jd}^{k+1}$$
Here w is the inertia weight, c1 and c2 are learning factors, and η1, η2 are random numbers in [0, 1]. To favour exploration early and refinement late, the weight is interpolated between wmin and wmax according to where a particle’s fitness d falls between the swarm minimum dmin and average davg, with the upper bound retained for particles above average:
$$w=\begin{cases}w_{\min}+\left(w_{\max}-w_{\min}\right)\dfrac{d-d_{\min}}{d_{avg}-d_{\min}}, & d\le d_{avg}\\[6pt] w_{\max}, & d>d_{avg}\end{cases}$$
while the learning factors decay linearly over the iteration count t towards a maximum of I iterations:
$$c_1=c_1^{\max}-\left(c_1^{\max}-c_1^{\min}\right)\frac{t}{I},\qquad c_2=c_2^{\max}-\left(c_2^{\max}-c_2^{\min}\right)\frac{t}{I}$$
The fitness being optimized is the correlated kurtosis of the filtered signal, so the search rewards parameter pairs that expose periodic impact content. The particle present at termination supplies the (L, M) pair used for the production MCKD run. The filtered components are then separated and read through the Hilbert envelope spectrum at the mesh frequency and its multiples.
Test bench, instrumentation and test matrix
The measurement chain was built around a Y9550 bevel gear rolling inspection machine retrofitted with numerical control. A COINV INV9206 single-directional condenser acoustic pressure sensor was mounted above the spindle housing, 20 cm from the mesh zone, with its sensing face aligned to the direction of pinion–wheel engagement. The signal reached an Advantech PCI-1742U data acquisition card through a BNC connection and was displayed and stored on an industrial computer, in both time and frequency domains, by the acquisition software.
Before each run the transducer, card and computer were checked; the machine was then brought to 740 r/min and allowed to run steadily, after which the axial mounting distance was set to the value under test and a one-minute record was taken at a sampling rate of 44 100 Hz. Six pairs from a single production batch were measured, covering nominally zero deviation, ±0.05 mm and ±0.10 mm of pinion axial deviation, with the pinion as the driving member. The gear data and the test matrix are given in Tables 1 and 2.
| Parameter | Pinion (z1 = 28) | Wheel (z2 = 33) |
|---|---|---|
| Hand of spiral | Left | Right |
| Shaft angle | 90° | 90° |
| Large-end module | 6.1 mm | 6.1 mm |
| Face width | 39.6 mm | 39.6 mm |
| Mid-point spiral angle | 35° | 35° |
| Addendum | 5.771 mm | 4.599 mm |
| Dedendum | 5.746 mm | 6.917 mm |
| Pitch diameter | 145.18 mm | 171.105 mm |
| Pair | Pinion | Wheel | ΔT (mm) |
|---|---|---|---|
| A0–F0 | A0 | F0 | 0 |
| A1–F1 | A1 | F1 | +0.05 |
| A2–F2 | A2 | F2 | +0.10 |
| A3–F3 | A3 | F3 | 0 |
| A4–F4 | A4 | F4 | −0.05 |
| A5–F5 | A5 | F5 | −0.10 |
Measured harmonic amplitudes under axial deviation
For positive deviation the mesh frequency and its multiples kept their positions but grew in amplitude as the offset increased (Table 3). The fundamental rose from 1.71 × 10⁻⁴ mV at zero deviation to 2.57 × 10⁻⁴ mV at +0.10 mm, a factor of about 1.5, while the second harmonic went from 0.36 × 10⁻⁴ to 0.87 × 10⁻⁴ mV and the third from 0.29 × 10⁻⁴ to 0.73 × 10⁻⁴ mV, in both cases a factor of roughly 2.4 to 2.5.
| Component | ΔT = 0 | ΔT = +0.05 mm | ΔT = +0.10 mm |
|---|---|---|---|
| 1 × fm | 1.71 | 1.72 | 2.57 |
| 2 × fm | 0.36 | 0.42 | 0.87 |
| 3 × fm | 0.29 | 0.40 | 0.73 |
The intermediate case is instructive. At +0.05 mm the fundamental is indistinguishable from the zero-deviation pair (1.72 against 1.71), yet the second and third harmonics have already risen by about 17% and 38% respectively. Sensitivity to small misalignment therefore sits in the harmonics before it appears in the fundamental, which is consistent with a pulse that is becoming sharper while its overall energy remains nearly unchanged.
Negative deviation produced the same qualitative picture with a larger swing (Table 4). The fundamental climbed from 1.54 × 10⁻⁴ mV to 4.73 × 10⁻⁴ mV, roughly a threefold rise, and the second harmonic from 0.37 × 10⁻⁴ to 0.79 × 10⁻⁴ mV. The third harmonic behaved less regularly, dipping slightly at −0.05 mm (0.29 × 10⁻⁴ against 0.32 × 10⁻⁴ mV at zero deviation) before reaching 0.85 × 10⁻⁴ mV at −0.10 mm; the trend is strong overall but not strictly monotonic in every component.
| Component | ΔT = 0 | ΔT = −0.05 mm | ΔT = −0.10 mm |
|---|---|---|---|
| 1 × fm | 1.54 | 1.63 | 4.73 |
| 2 × fm | 0.37 | 0.68 | 0.79 |
| 3 × fm | 0.32 | 0.29 | 0.85 |
Two features deserve comment. First, the response is asymmetric: at equal magnitude of 0.10 mm, negative deviation tripled the fundamental whereas positive deviation raised it by half. Second, the two nominally zero-deviation pairs differ by about 11% at the fundamental (1.71 against 1.54 × 10⁻⁴ mV), which sets a rough scale for pair-to-pair scatter and warns against reading differences of a few percent as evidence of a defect. The harmonic changes at ±0.05 mm and the fundamental changes at ±0.10 mm exceed that scatter comfortably.
Cross-check against contact patterns
The spectral reading was checked against the physical evidence on high-precision pairs produced by Qinghai Huading Gearbox Co., Ltd., using the same retrofitted Y9550 machine at 740 r/min so that assembly error from manual handling would not contaminate the comparison. Both members were coated with marking compound, the pair was run at the prescribed axial settings, and after shutdown the footprints were photographed.
Under positive deviation the footprint shrank noticeably and lost its flattened elliptical form, the change becoming more pronounced as the offset grew from 0 to 0.10 mm. Under negative deviation the footprint migrated along the tooth height, moving from the root towards the tip, while its area also decreased. In both directions the pattern deteriorated in step with the rise in harmonic amplitude, so the acoustic indicator and the visual indicator rank the six settings in the same order.
Scope, resolution and limits
The evidence supports a fairly narrow but useful claim: on a rolling inspection machine running at fixed speed, with the transducer position and sampling settings unchanged, the amplitude of the mesh frequency and its low harmonics discriminates between acceptable and deviated axial mounting of spiral bevel gears, and does so with the same verdict as the contact pattern. The measurement is passive, needs no disassembly, no paint and no stopping of the machine, and the PSO stage removes the manual parameter selection that would otherwise make the result operator-dependent.
The same evidence does not support several stronger claims. Amplitudes are reported as transducer output in millivolts, so they are relative figures valid within this setup rather than calibrated sound-pressure levels; transferring thresholds to another machine, sensor distance or gear size would require recalibration. The data cover one tooth combination (28/33, module 6.1 mm), one speed and six pairs, with a single zero-deviation baseline per direction, and no repetition of the same pair to separate measurement noise from pair-to-pair variation. Nothing here isolates the effect of load, temperature or background noise, and the 11% spread between the two nominal baselines marks the resolution limit of the amplitude criterion as it stands. The method is therefore an auxiliary check that complements the contact pattern, not a replacement for it.
Conclusions
Instrumenting a bevel gear rolling inspection machine with an acoustic pressure sensor, a PCI-1742U acquisition card and a PSO-MCKD processing chain turns the mesh tone into a quantitative quality signal for spiral bevel gears. Across six pairs from one production batch, the mesh frequency and its harmonics kept their positions while their amplitudes grew with the magnitude of the pinion axial deviation, in both the positive and the negative direction, and the growth pattern agreed with the changes observed in the tooth contact footprints. The harmonic amplitudes, particularly the second and third, responded earlier than the fundamental, which makes them the more sensitive indicator at small offsets. The approach adds an objective, non-contact measurement to a procedure that has relied on visual judgement, and its main practical requirements are a stable running speed, a fixed transducer position and per-application calibration of the amplitude thresholds.