
The pursuit of optimal performance in automotive drivetrains, particularly in rear axle final drives, hinges critically on the meshing behavior of the gear pair. Among various gear types, the hyperbolic gear, or more precisely the hypoid gear, is extensively favored for this application due to its capacity for a high offset, allowing for a lower center of gravity in vehicle design. A primary metric for evaluating the dynamic performance, noise, and vibration characteristics of any gear system is the Transmission Error (TE). Traditionally, research and simulation models have relied on theoretically perfect gear tooth geometries derived from design algorithms. However, a significant disconnect often exists between these ideal simulations and the performance of physically manufactured gears tested on roll testers. This discrepancy stems from inevitable manufacturing inaccuracies that create deviations between the designed (theoretical) tooth surface and the actual (real) tooth surface of a produced hyperbolic gear. This study addresses this critical gap by constructing a high-fidelity simulation model based on the real tooth surface geometry of hypoid gears and investigating its influence on transmission error, as well as the sensitivity of TE to assembly misalignments.
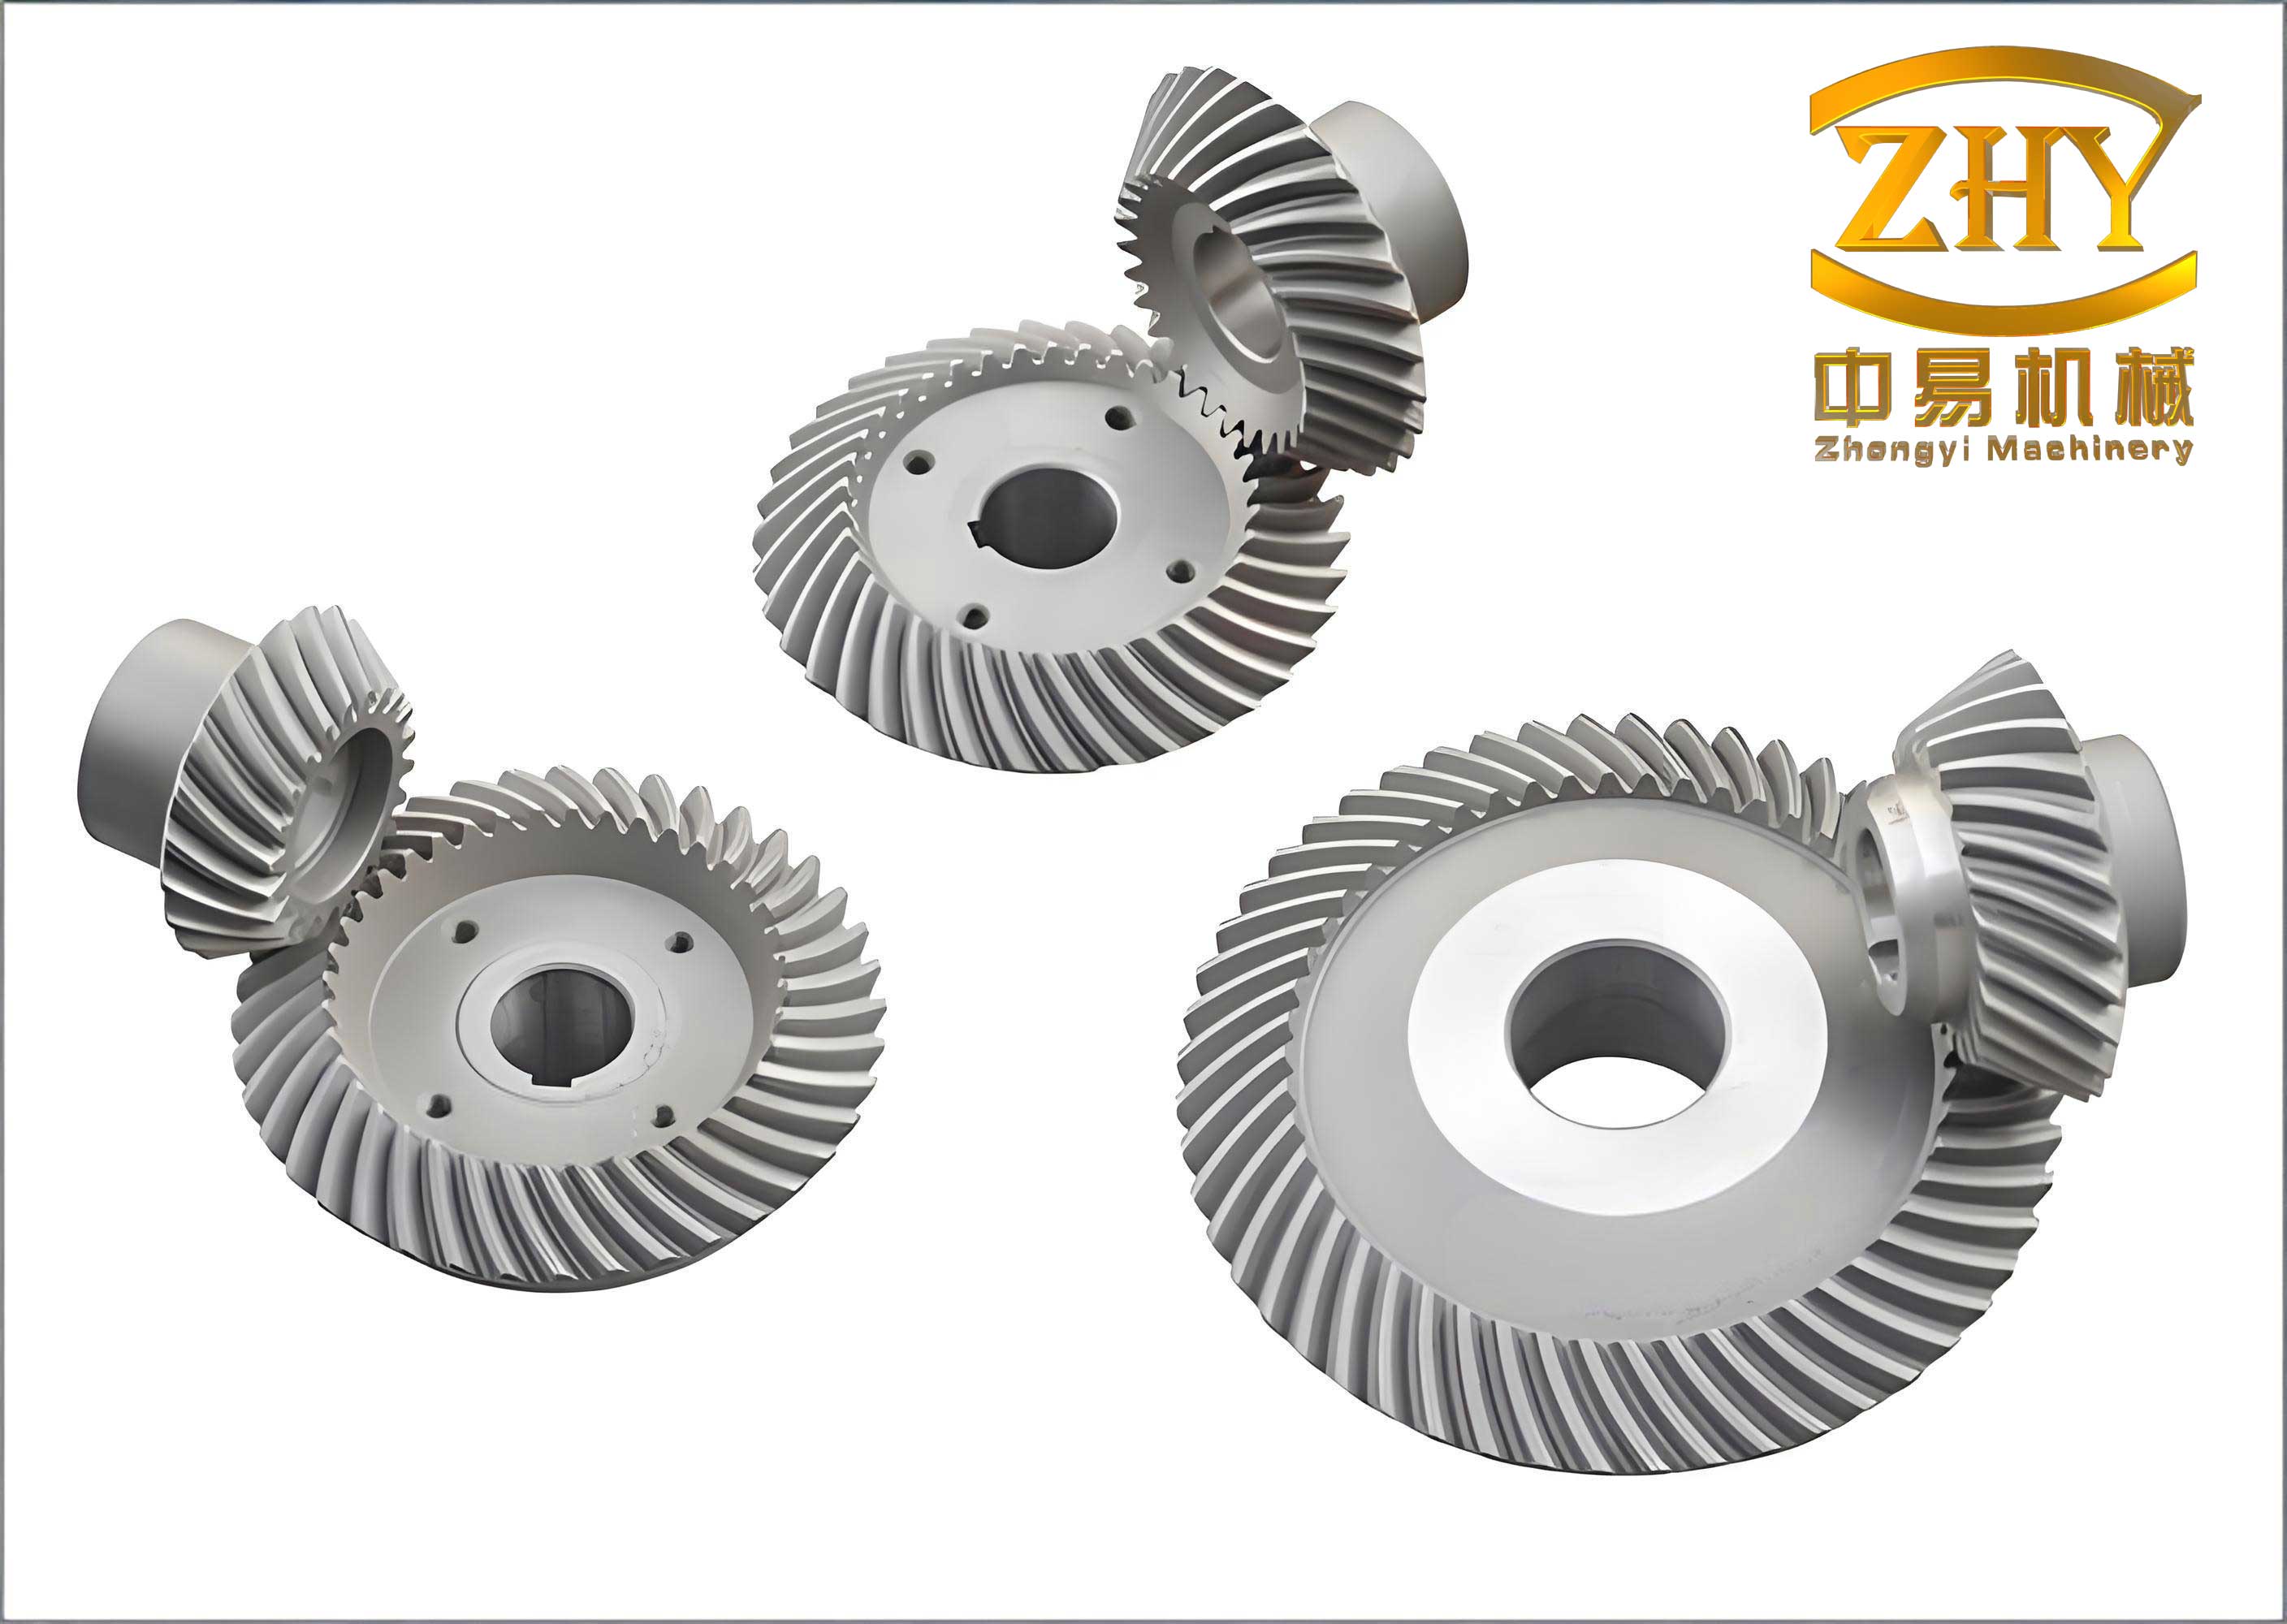
Reconstruction of the Real Tooth Surface Model
The first and most crucial step in this analysis is the accurate digital reconstruction of the real tooth surface. A hypoid gear tooth surface is a complex, three-dimensional spatial contour. To capture this geometry, coordinate measurement of actual manufactured pinion and gear members is essential. For this study, a high-precision gear measurement center (e.g., a Gleason 350GMM) was employed. The measurement strategy involves defining a grid of points across the active tooth flank. Typically, 9 points along the lengthwise direction and 5 points along the profile direction are measured for each flank (convex and concave), resulting in 45 discrete data points per tooth surface. A sample of the measured three-dimensional coordinates (X, Y, Z) for points on the pinion convex flank is presented in Table 1. These coordinates represent the physical reality of the manufactured hyperbolic gear, inclusive of all machining deviations.
| Point ID | X-coordinate | Y-coordinate | Z-coordinate |
|---|---|---|---|
| P11 | 20.0185 | 0.6118 | -35.0599 |
| P12 | 20.5333 | 0.4281 | -34.7572 |
| P13 | 21.0469 | 0.1968 | -34.4543 |
| P14 | 21.5576 | -0.0775 | -34.1514 |
| P15 | 22.0643 | -0.3921 | -33.8486 |
| … | … | … | … |
| P95 | 27.8953 | -1.0300 | -41.5420 |
To transition from a cloud of discrete points to a continuous, analyzable surface, a Non-Uniform Rational B-Spline (NURBS) surface fitting technique is utilized. NURBS is a standard in computational geometry and reverse engineering for its ability to accurately represent complex free-form surfaces. A NURBS surface is defined parametrically. A k-th degree NURBS curve is given by:
$$C(u) = \frac{\sum_{i=0}^{n} N_{i,k}(u) w_i P_i}{\sum_{i=0}^{n} N_{i,k}(u) w_i}$$
where \(P_i\) are the control points, \(w_i\) are the corresponding weights, and \(N_{i,k}(u)\) are the k-th degree B-spline basis functions. Extending this to a surface, a NURBS surface of degree k in the u-direction and degree l in the v-direction is defined as:
$$S(u,v) = \frac{\sum_{i=0}^{m} \sum_{j=0}^{n} N_{i,k}(u) N_{j,l}(v) w_{i,j} P_{i,j}}{\sum_{i=0}^{m} \sum_{j=0}^{n} N_{i,k}(u) N_{j,l}(v) w_{i,j}}$$
In this study, the measured 3D coordinates serve as the data points for interpolation. Using third-degree (cubic) NURBS surfaces, a fitting algorithm calculates a network of control points (e.g., a 7×11 grid for 77 control points) that defines the smooth surface passing through or near the measured data. This mathematical surface model accurately encapsulates the real tooth geometry, including its errors. This NURBS model is then imported into CAD software (e.g., CATIA) to generate a solid 3D model of the pinion and gear. This model forms the basis for all subsequent finite element analysis, representing the real hyperbolic gear pair.
Finite Element Analysis Methodology
To simulate the meshing process and extract transmission error, a dynamic finite element analysis (FEA) is conducted. The 3D CAD models of the real-surfaced pinion and gear are discretized into finite element meshes. Special care is taken during meshing: the contact regions on the tooth flanks are meshed with a finer, high-quality grid to ensure accuracy in stress and contact calculation, while non-critical regions use a coarser mesh to optimize computational efficiency. The final assembly model consists of hundreds of thousands of elements, primarily hexahedral and tetrahedral. The material properties for the hyperbolic gear (typically 20CrMnTi alloy steel) are assigned: Young’s modulus E = 212,000 MPa, Poisson’s ratio ν = 0.3, and density ρ = 7800 kg/m³.
Boundary conditions and loads are applied to simulate real operating conditions. Reference points are created coincident with the rotational axes of the pinion and gear. These reference points are coupled to the bore surfaces of their respective gears using kinematic coupling constraints, allowing loads and motions to be applied at the reference point. The analysis is performed in several steps:
- Pre-load Step: A very small rotational displacement is applied to the pinion to eliminate initial backlash and establish stable tooth contact.
- Load Application Step: A constant braking torque is applied to the gear reference point to simulate the resistive load from the vehicle.
- Dynamic Analysis Step: A constant angular velocity is applied to the pinion reference point to drive the system through several mesh cycles under loaded conditions.
The contact between the pinion and gear tooth flanks is defined as a surface-to-surface contact pair. The “penalty” friction formulation with a coefficient of 0.1 is used, and the analysis is conducted using an explicit dynamic solver suitable for simulating complex contact conditions. The detailed contact settings are summarized in Table 2.
| Setting Parameter | Specification |
|---|---|
| Contact Type | Surface-to-Surface |
| Master Surface | Pinion Tooth Flank |
| Slave Surface | Gear Tooth Flank |
| Contact Formulation | Penalty Method |
| Sliding Formulation | Finite Sliding |
| Friction Coefficient | 0.1 |
| Analysis Type | Explicit Dynamic |
Transmission error is calculated from the FEA results. By recording the time-history of the rotational angles of both the pinion (\(φ_1\)) and the gear (\(φ_2\)), the static transmission error (TE) is computed using the fundamental definition:
$$TE = (φ_2 – φ_2^{(0)}) – \frac{z_1}{z_2} (φ_1 – φ_1^{(0)})$$
where \(φ_1^{(0)}\) and \(φ_2^{(0)}\) are the initial reference angles, and \(z_1\) and \(z_2\) are the numbers of teeth on the pinion and gear, respectively. The result is a curve of TE versus pinion rotation angle (or time), where the mean value represents positional error and the fluctuating component (amplitude) is critical for noise and vibration excitation.
Analysis of Transmission Error: Real vs. Theoretical Surfaces
The core of this investigation lies in comparing the transmission error from the real tooth surface model against that from a model with perfectly theoretical geometry. The same FEA methodology is applied to both models under identical loading and nominal alignment conditions (zero installation errors).
The results reveal a significant and critical distinction. The TE curve from the theoretical hyperbolic gear pair shows a mean value very close to zero, with a smooth, parabolic-like fluctuation pattern over a mesh cycle. In contrast, the TE curve from the real-surface model exhibits two key differences:
- Shifted Mean Value: The entire TE curve is offset, with a mean value significantly different from zero (e.g., on the order of \(2.5 \times 10^{-3}\) rad). This indicates a systematic shift in the kinematic relationship due to tooth surface deviations.
- Increased Fluctuation Amplitude and Irregularity: The amplitude of the TE fluctuation is markedly larger for the real-surface model. Furthermore, while the overall parabolic shape is retained, the curve is no longer smooth; it exhibits a distinct “saw-tooth” or wavy pattern superimposed on the primary trend. This irregularity is a direct manifestation of the localized geometry errors on the real tooth surface, which cause abrupt changes in contact conditions and load sharing as the teeth roll through mesh.
This comparison conclusively verifies that the inherent manufacturing errors in a real hyperbolic gear have a detrimental effect on its transmission error characteristic, both by introducing a constant positional error and, more importantly, by increasing the magnitude and high-frequency content of the fluctuating error that is a primary source of gear whine and vibration.
Influence of Assembly Errors on Transmission Error
In a practical vehicle axle assembly, perfect alignment of the hypoid gear set is impossible. Assembly (installation) errors are always present and interact with the tooth surface errors. This study systematically investigates the effect of four primary installation errors on the TE of the real-surface hyperbolic gear model, using a controlled single-variable approach. The errors, illustrated in a standard misalignment schematic, are:
- Shaft Angle Error (ΔΣ): Deviation from the designed angle between the pinion and gear axes.
- Pinion Offset Error (ΔV): Vertical displacement of the pinion axis relative to the gear axis, altering the nominal hypoid offset.
- Pinion Axial Position Error (ΔH): Axial movement of the pinion towards or away from the gear.
- Gear Axial Position Error (ΔE): Axial movement of the gear.
A sign convention is established: positive ΔH/E indicates the members moving closer; positive ΔV indicates the pinion axis moving downward; positive ΔΣ indicates an increase in the shaft angle. The range of errors considered, based on typical assembly tolerances, is shown in Table 3.
| Installation Error | Symbol | Study Range |
|---|---|---|
| Pinion Offset Error | ΔV | ±0.06 mm |
| Pinion Axial Position Error | ΔH | ±0.06 mm |
| Gear Axial Position Error | ΔE | ±0.06 mm |
| Shaft Angle Error | ΔΣ | ±0.06° |
The FEA simulations are repeated for various values within each error’s range, while keeping the other three errors at zero. The effects are analyzed in terms of both the shift in the mean TE and the change in the peak-to-peak amplitude of the TE fluctuation.
- Pinion Offset Error (ΔV): A positive ΔV causes the entire TE curve to shift positively. The fluctuation amplitude is moderately affected, with the peak’s location shifting slightly along the mesh cycle, indicating a movement of the contact path. Negative ΔV has a less pronounced effect on amplitude.
- Pinion Axial Position Error (ΔH): This error has a strong and opposite effect on the mean TE shift compared to ΔV; a positive ΔH shifts the TE curve negatively. It significantly impacts the fluctuation amplitude. Interestingly, a small positive ΔH can sometimes result in a slightly smoother TE curve, suggesting a partial compensation for certain real surface errors, while negative ΔH sharply increases amplitude and disrupts the curve shape.
- Gear Axial Position Error (ΔE): The influence of ΔE is primarily on the mean TE value (positive ΔE causes a negative shift), with a very minimal impact on the amplitude or shape of the TE fluctuation. This is because ΔE mainly affects the operational backlash rather than drastically altering the contact pattern location.
- Shaft Angle Error (ΔΣ): This is the most sensitive parameter. A positive ΔΣ shifts the mean TE positively and causes a dramatic increase in the fluctuation amplitude. A negative ΔΣ also increases amplitude, though the resulting TE curve can be smoother, again hinting at potential partial error compensation for specific error combinations.
Sensitivity Analysis and Experimental Validation
To quantitatively rank the influence of the assembly errors, a sensitivity analysis is performed by plotting the peak-to-peak amplitude of the TE fluctuation against each error. The results clearly establish a sensitivity hierarchy for the real-surface hyperbolic gear:
Sensitivity (from highest to lowest): ΔΣ ≈ ΔH > ΔV > ΔE
The shaft angle error (ΔΣ) and the pinion axial error (ΔH) are the most critical, with both positive and negative deviations causing substantial increases in TE amplitude. The pinion offset error (ΔV) shows an asymmetric sensitivity, being more critical in the positive direction. The gear axial error (ΔE) has negligible impact on TE amplitude. This finding has direct implications for axle assembly processes, indicating that controlling the pinion’s axial position and the shaft angle is paramount for achieving good noise, vibration, and harshness (NVH) performance.
The validity of the real-surface FEA model is confirmed through physical roll testing experiments on a gear rolling tester (e.g., a Gleason 600HTT machine). A manufactured hypoid gear set is tested under light load at its nominal designed position and under introduced misalignments. The measured TE amplitudes from the physical tests are compared with the FEA predictions from both the theoretical and real-surface models. The results, summarized in Table 4, show a strong correlation.
| Condition (Error) | Theoretical Surface FEA (μrad) | Real Surface FEA (μrad) | Roll Test Experiment (μrad) |
|---|---|---|---|
| Nominal (0) | 3.68 | 6.42 | 6.63 |
| ΔV = +0.04 mm | 8.36 | 10.95 | 11.42 |
| ΔV = -0.04 mm | 10.68 | 13.32 | 12.69 |
| ΔH = +0.04 mm | 12.47 | 16.48 | 17.24 |
| ΔH = -0.04 mm | 19.82 | 21.26 | 20.86 |
| ΔΣ = +4 arcmin | 5.68 | 6.84 | 6.80 |
| ΔΣ = -4 arcmin | 4.83 | 6.72 | 6.74 |
The data unequivocally demonstrates that the TE amplitudes predicted by the real-surface FEA model are consistently and significantly closer to the experimental measurements than those from the theoretical model. The theoretical model underestimates the TE amplitude, failing to account for manufacturing imperfections. This validates the real-surface modeling approach as a more accurate and reliable tool for predicting the functional performance of a hyperbolic gear pair.
Conclusion
This comprehensive investigation into the transmission error of hypoid gears based on real tooth surface data yields several critical conclusions for the design, manufacturing, and assembly of these essential drivetrain components.
- The manufacturing imperfections inherent in a real hyperbolic gear tooth surface have a substantial negative impact on its transmission error characteristics. Compared to a theoretically perfect gear, the real gear exhibits both a shifted mean transmission error and, more importantly, a larger and irregular fluctuation amplitude, which is a direct excitatory source for noise and vibration.
- Assembly errors interact with tooth surface errors to further degrade transmission error performance. The shaft angle error (ΔΣ) and the pinion axial position error (ΔH) are the most sensitive parameters, causing dramatic increases in TE fluctuation amplitude. The pinion offset error (ΔV) has a notable but less severe effect, while the gear axial error (ΔE) has minimal influence on TE amplitude.
- A specific finding is that certain small, positive assembly errors (like a positive ΔH or a negative ΔΣ) can, in some cases, partially compensate for the real surface errors, resulting in a slightly smoother TE curve. However, any deviation from nominal typically increases the overall amplitude.
- The hierarchy of sensitivity (ΔΣ ≈ ΔH > ΔV > ΔE) provides clear guidance for quality control in axle assembly. Precision in setting the pinion’s axial location and the shaft angle is paramount for optimizing the NVH performance of a final drive utilizing a hyperbolic gear.
- The methodology of reconstructing the real gear surface via NURBS modeling and employing dynamic finite element analysis has been robustly validated against physical roll tests. This approach bridges the gap between idealized simulation and real-world performance, establishing a high-fidelity virtual tool for predicting gear meshing behavior that accounts for the unavoidable realities of manufacturing.
This study underscores the necessity of incorporating real geometry data into advanced simulation models to achieve accurate performance predictions. It provides a framework for evaluating the combined effects of manufacturing quality and assembly precision on the dynamic performance of hypoid gears, ultimately contributing to the development of quieter, smoother, and more reliable automotive drivetrains.