
Spiral bevel gears combine high contact ratio, smooth meshing and high load capacity, but their running quality is sensitive to axial mounting position. In a rolling inspection, the contact pattern is read from marking compound and used to judge whether the tooth surfaces are loaded in the intended region. That judgment is direct, but it depends on operator experience and is difficult to convert into a repeatable, quantitative screen. An acoustic measurement offers a complementary channel: meshing impacts and structural vibration radiate sound at the mesh frequency and its harmonics, and an axial offset changes contact location, contact area and impact severity. The approach discussed here uses that acoustic response as an auxiliary indicator of transmission accuracy. It does not replace contact-pattern inspection or direct transmission-error measurement; it provides a fast, non-contact signal that can be compared against a known-good mounting condition.
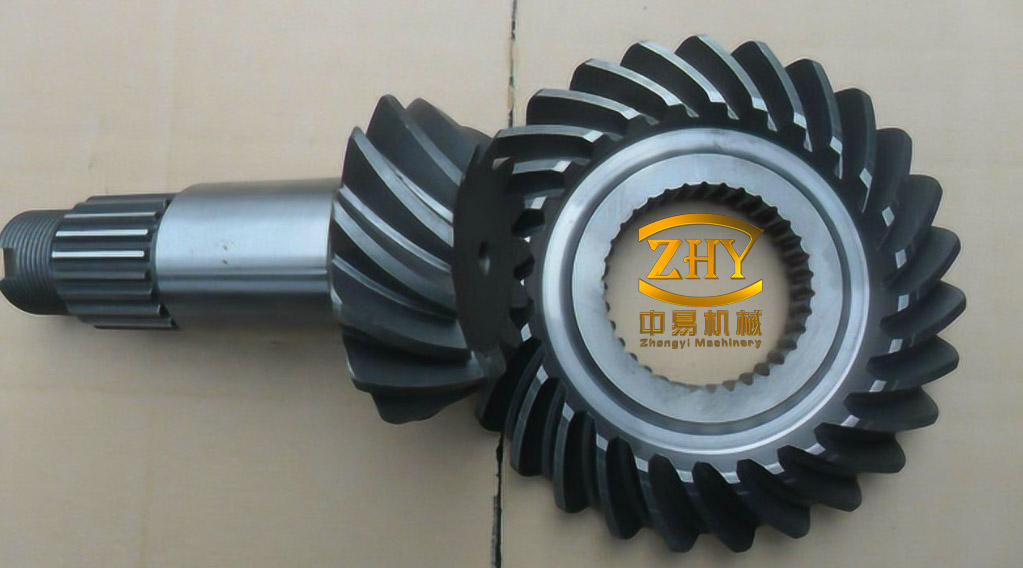
Contact Pattern and Axial Mounting Deviation
The contact pattern is the trace left where the pinion and wheel teeth touch under a marking compound. Its position, size and shape indicate whether the load is distributed across the intended part of the tooth flank. Two axial mounting variables matter: the wheel axial deviation ΔG and the pinion axial deviation ΔT. A mounting error displaces the contact region, reduces the effective contact area and can concentrate load near the tooth toe, heel, root or tip. The resulting change in mesh stiffness and impact intensity is the mechanical link between a poor pattern and an altered acoustic spectrum.
The test matrix discussed here varied the pinion axial deviation ΔT over −0.10 mm, −0.05 mm, 0, +0.05 mm and +0.10 mm. Six gear pairs from the same batch were used, with two zero-deviation references. The wheel axial deviation ΔG was not part of this matrix. The contact pattern remains the primary acceptance record; the acoustic channel is intended to make the comparison faster and less dependent on a single inspector’s visual judgment.
PSO-MCKD Processing Chain
Sound measured near a gearbox contains periodic mesh impacts, structural resonances and broadband background noise. The transmission path smears impulsive events, so the raw waveform may show only weak impacts without an obvious repetition pattern. Maximum correlated kurtosis deconvolution (MCKD) addresses this by finding a finite impulse response filter that enhances periodic impulses at a trial period. The input is modelled as a convolution between a periodic impulse train and the transmission path, plus noise:
$$ y(n)=h(n)*x(n)+e(n) $$
where y(n) is the measured signal, h(n) is the transmission-path response, x(n) is the periodic impulse component and e(n) is noise. MCKD seeks a filter that maximizes correlated kurtosis at the mesh period T:
$$ \mathrm{CK}_M(T)=\max_f \frac{\sum_{n=1}^{N}\left(\prod_{m=0}^{M}x_{n-mT}\right)^2}{\left(\sum_{n=1}^{N}x_n^2\right)^{M+1}} $$
Here M is the maximum shift order, and the product rewards impulse energy that repeats at intervals of T. The denominator suppresses trivial amplification of the whole record. The trial period is set by the sampling frequency fs and the mesh frequency fm:
$$ T=\frac{f_s}{f_m} $$
In implementation, T is the integer sample lag closest to this ratio. MCKD performance is sensitive to the filter length L and the shift order M. Instead of selecting those parameters by manual trial and error, particle swarm optimization (PSO) searches the parameter pair [L, M]. Each particle represents a candidate pair, and its fitness is based on the correlated kurtosis of the filtered signal. The swarm updates velocity and position according to:
$$ v_{jd}^{k+1}=w v_{jd}^{k}+c_1\eta_1\left(p_{jd}^{k}-s_{jd}^{k}\right)+c_2\eta_2\left(g_{d}^{k}-s_{jd}^{k}\right) $$
$$ s_{jd}^{k+1}=s_{jd}^{k}+v_{jd}^{k+1} $$
where w is the inertia weight, c1 and c2 are learning factors, η1 and η2 are random numbers in [0, 1], p is the individual best position and g is the global best position. The inertia weight is adjusted according to each particle’s fitness relative to the swarm average, while the learning factors decrease linearly with iteration:
$$ c_i=c_{i,\max}-\left(c_{i,\max}-c_{i,\min}\right)\frac{t}{I},\qquad i=1,2 $$
with t the current iteration and I the maximum iteration count. After optimization, the global best [L, M] is used for the final MCKD filter. The filtered signal is then Hilbert-transformed to form an envelope spectrum, which exposes periodic impact components that are weak in the time domain. For the mounting-deviation comparison, the amplitudes at the mesh frequency fm and its first two harmonics, 2fm and 3fm, were used as the quantitative indicator.
Rolling Inspection Test and Measurement Conditions
The measurement setup combined a CNC-modified Y9550 bevel gear rolling inspection machine with an acoustic acquisition system. A COINV INV9206 single-directional acoustic pressure sensor was fixed above the spindle housing, 20 cm from the mesh, with its acquisition port facing the pinion–wheel contact direction. The sensor was connected through a BNC interface to an Advantech PCI-1742U data acquisition card and an industrial computer. The sampling frequency was 44,100 Hz, the record length was 60 s, and the rolling inspection machine ran at 740 r/min.
| Parameter | Pinion | Wheel |
|---|---|---|
| Number of teeth | 28 | 33 |
| Hand | Left | Right |
| Shaft angle (°) | 90 | 90 |
| Big-end module (mm) | 6.1 | 6.1 |
| Face width (mm) | 39.6 | 39.6 |
| Mid-spiral angle (°) | 35 | 35 |
| Addendum (mm) | 5.771 | 4.599 |
| Dedendum (mm) | 5.746 | 6.917 |
| Pitch diameter (mm) | 145.18 | 171.105 |
The nominal shaft frequency and mesh frequency follow from the tooth count and rotational speed:
$$ f_r=\frac{n}{60},\qquad f_m=z_1 f_r $$
where n is the spindle speed and z1 is the pinion tooth count. At 740 r/min and z1 = 28, the nominal values are fr = 12.33 Hz, fm = 345.33 Hz, 2fm = 690.67 Hz and 3fm = 1,036.00 Hz. These frequencies are fixed by tooth count and speed. Axial deviation changes their amplitudes rather than their positions, which is why the assessment used amplitude growth at the mesh-frequency family rather than frequency shift.
Spectral Amplitude Response
The raw time histories showed weak impacts without a clear periodic structure, so the processed spectral amplitudes were used for comparison. The six pairs covered zero deviation, +0.05 mm, +0.10 mm, −0.05 mm and −0.10 mm pinion axial deviation. The measured amplitudes at fm, 2fm and 3fm are listed below.
| Gear pair | ΔT (mm) | 1×fm | 2×fm | 3×fm |
|---|---|---|---|---|
| A0–F0 | 0 | 0.171 | 0.036 | 0.029 |
| A1–F1 | +0.05 | 0.172 | 0.042 | 0.040 |
| A2–F2 | +0.10 | 0.257 | 0.087 | 0.073 |
| A3–F3 | 0 | 0.154 | 0.037 | 0.032 |
| A4–F4 | −0.05 | 0.163 | 0.068 | 0.029 |
| A5–F5 | −0.10 | 0.473 | 0.079 | 0.085 |
For positive axial deviation, the mesh frequency and its harmonics stayed at their nominal positions, while the amplitudes rose with deviation magnitude. The first harmonic increased from 0.171 to 0.257 ×10⁻³ mV between zero and +0.10 mm; the second harmonic increased from 0.036 to 0.087 ×10⁻³ mV, and the third from 0.029 to 0.073 ×10⁻³ mV. The small +0.05 mm case is informative: the first harmonic barely changed, from 0.171 to 0.172 ×10⁻³ mV, while the second and third harmonics rose from 0.036 to 0.042 and from 0.029 to 0.040 ×10⁻³ mV. A small positive offset may therefore be missed by the first harmonic alone but still appear in the higher harmonics.
Negative axial deviation produced the same general direction of change, but with a stronger first-harmonic response at the largest offset. Between zero and −0.10 mm, the first harmonic rose from 0.154 to 0.473 ×10⁻³ mV, the second from 0.037 to 0.079 ×10⁻³ mV and the third from 0.032 to 0.085 ×10⁻³ mV. The progression was not strictly monotonic for every harmonic: at −0.05 mm, the third harmonic dipped slightly to 0.029 ×10⁻³ mV before rising at −0.10 mm. The −0.10 mm pair also reached a higher first-harmonic amplitude than the +0.10 mm pair, 0.473 versus 0.257 ×10⁻³ mV, and its spectrum was dominated by the first harmonic. The reliable statement is a general upward trend in mesh-frequency amplitude with increasing axial deviation, not a calibrated monotonic law for each harmonic.
Contact-Pattern Cross-Check
The acoustic result was checked against the contact pattern on the same Y9550 rolling inspection machine at 740 r/min. Both members were coated with marking compound, the pair was run until stable, and the machine was stopped for inspection. The contact-pattern comparison used high-precision spiral bevel gear pairs produced by Qinghai Huading Gearbox Co., Ltd. For positive deviation from 0 to +0.10 mm, the contact area decreased noticeably and the pattern no longer retained the flat, date-pit-like shape expected at the reference setting. For negative deviation from 0 to −0.10 mm, the pattern shifted and its area decreased, with the contact region tending to move from the tooth root toward the tooth tip along the tooth height.
The visual and acoustic results followed the same direction: larger axial deviation produced a less favourable contact pattern and higher mesh-frequency amplitudes. The cross-check was qualitative, however. No digitized contact area, repeat statistics or uncertainty analysis were reported, and the comparison covered six pairs from one batch. It supports the feasibility of acoustic-assisted screening, but it does not establish a universal acceptance threshold. A shop-floor implementation would need a baseline record for the same gear type, sensor position and speed, followed by confirmation of suspect cases by contact-pattern inspection.
Scope and Practical Interpretation
The acoustic indicator is most useful as a comparative screen. It is non-contact, fast and sensitive to changes in mesh impact severity, but its absolute amplitudes depend on the sensor, distance, machine structure, gear size, speed and operating condition. The reported matrix covers one speed, one sensor position, one batch and pinion axial deviation only. It does not provide a load sweep or a calibrated relationship between amplitude and transmission error. Other faults, such as pitch error or tooth damage, can also raise harmonic amplitudes, so the acoustic result should be read together with the contact pattern and the maintenance context.
Within that scope, the mesh-frequency family is a practical marker because it is tied directly to tooth count and speed and is easy to track in a spectrum. The observed behaviour is consistent with a mechanical interpretation: axial offset displaces the contact region, alters the distribution of mesh stiffness and increases impact severity, which raises the amplitude at the mesh frequency and its harmonics. The data support that interpretation for the tested pairs, but they do not turn the amplitude into a stand-alone acceptance limit.
Conclusion
An acoustic signal-assisted method for assessing spiral bevel gear transmission accuracy was demonstrated on a rolling inspection machine using PSO-optimized MCKD. The processing chain enhanced weak periodic impacts in the measured sound, and the amplitudes at the mesh frequency and its first two harmonics were used as comparative indicators. Increasing pinion axial deviation in either direction raised the mesh-frequency amplitudes while leaving the frequency positions unchanged. For positive deviation, the first harmonic rose from 0.171 to 0.257 ×10⁻³ mV, the second from 0.036 to 0.087 ×10⁻³ mV and the third from 0.029 to 0.073 ×10⁻³ mV. For negative deviation, the corresponding values rose from 0.154 to 0.473, from 0.037 to 0.079 and from 0.032 to 0.085 ×10⁻³ mV, with a slight non-monotonic dip in the third harmonic at −0.05 mm.
The contact-pattern inspection showed the expected degradation in pattern shape, position and area, and its direction agreed with the acoustic trend. The method is therefore best positioned as an auxiliary, baseline-referenced screening tool: it can reduce reliance on purely visual judgment and make mounting-quality comparisons more consistent, while contact-pattern inspection and direct kinematic checks remain the reference for final acceptance.