
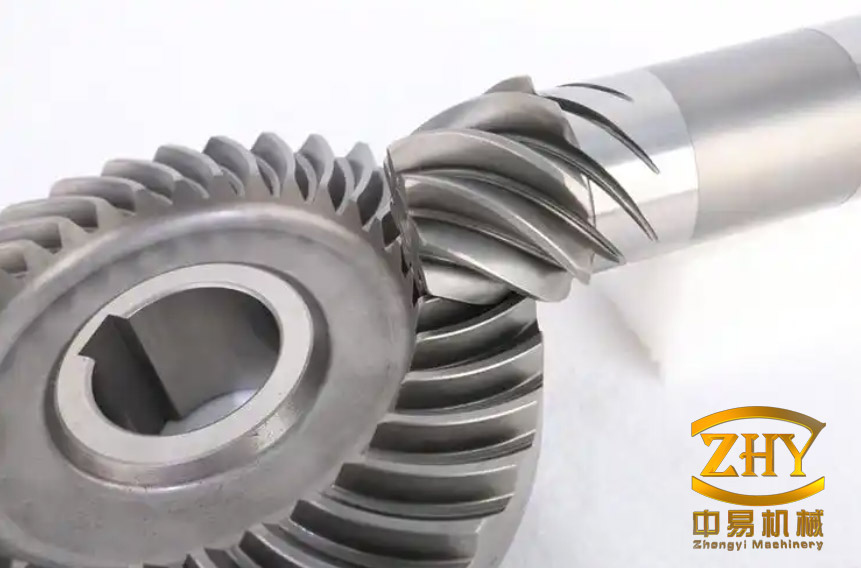
In an aero-engine spiral bevel gearbox, the loaded contact pattern and transmission error are not secondary inspection details. They determine whether the tooth pair can carry torque without edge contact, whether the load stays within the intended tooth region, and whether the mesh excites troublesome resonances. The contact pattern—its position along the face, its height on the tooth, its orientation and its size—shows how load is distributed. Transmission error (TE) describes the deviation from the nominal gear ratio and is a direct source of dynamic excitation. Vibration velocity, acceleration and dynamic mesh force are used to judge the dynamic consequence.
The conventional route is passive. A set of machine settings is chosen, the teeth are cut and ground, the pattern is checked on a rolling tester or in a gearbox, and the process is adjusted if the result is unacceptable. This verifies the outcome after machining rather than controlling it before commitment. The result depends heavily on experience and is difficult to optimize against strength and vibration targets at the same time. Active design reverses the sequence: the target loaded pattern and TE are specified first, then a manufacturable tooth surface and its machine settings are derived to produce them. The case discussed here applies that logic to an aero-engine spiral bevel gearbox, using tooth-surface generation, system-level loaded contact analysis, rig testing and a final optimization pass.
From passive inspection to active design
Spiral bevel gears were developed commercially by Gleason, and contact-pattern inspection remains a shop-floor method because the pattern is visible and intuitive. A complete conjugate pair has zero TE in theory, but it has poor adjustability under misalignment, shaft deflection and casing compliance. A deliberately mismatched, point-contact surface localizes the load and reduces edge sensitivity, but only the design reference point preserves the nominal instantaneous ratio. Away from that point, the surface produces TE.
For a pinion with \(N_1\) teeth driving a wheel with \(N_2\) teeth, TE can be written as
$$\Delta\theta_2(\phi)=\theta_2(\phi)-\frac{N_1}{N_2}\theta_1(\phi)$$
where \(\phi\) is the pinion rotation angle, \(\theta_1\) and \(\theta_2\) are the angular positions of pinion and wheel, and \(\Delta\theta_2\) is the transmission error, usually reported in microradians. The peak-to-peak value of \(\Delta\theta_2\) and its frequency content are directly linked to the dynamic response of the gear system.
Active design therefore treats the contact pattern and TE as functional requirements rather than inspection results. Three constraints must be satisfied together. First, the target pattern must be defined under the actual load, not only under a light rolling check. Second, the model must include the compliance of shafts, bearings and casing, because these components shift the pattern relative to a gear-pair-only analysis. Third, the resulting surface must be machinable and grindable; a theoretical ease-off that cannot be reproduced on the machine tool is not a design solution. The case uses GEMS for tooth-surface generation and Masta for system-level loaded tooth contact analysis (LTCA), with experimental validation before the final optimization.
Static tooth-surface design with manufacturing constraints
The example is an aero-engine spiral bevel gearbox with an 80° shaft angle. The pinion is right-handed, the wheel is left-handed, and both teeth are ground. The main geometry and manufacturing parameters are listed in the table.
| Parameter | Pinion | Wheel |
|---|---|---|
| Number of teeth | 43 | 49 |
| Face width | 21 mm | 21 mm |
| Module | 3.3 mm | 3.3 mm |
| Spiral angle | 35° | 35° |
| Hand | Right | Left |
| Pressure angle | 20° | 20° |
| Cutter radius | 95.25 mm | 95.25 mm |
| Tooth profile | Standard | Standard |
| Finishing | Grinding | Grinding |
The pinion is produced by a five-cut generating method and the wheel by a generating method. The normal backlash is 0.16–0.38 mm. These parameters were entered into the basic design module of GEMS to generate the precise tooth surfaces and the initial tooth contact analysis (TCA) pattern. The initial pattern covered more than 90% of the tooth height. That is not acceptable for a static design: it leaves no margin for the pattern to spread under load and makes edge contact likely when shaft deflection, bearing clearance and machining errors are present.
The static pattern was therefore modified to about 50% of tooth height and face width, biased toward the toe, or small end. This smaller, toe-biased pattern provides room for load-induced growth toward the heel and avoids an oversized pattern that would be sensitive to installation error. The adjustment was made within the TCA and ease-off modules of GEMS. Cutter profile angle, contact-length coefficient and profile coefficient \(K_p\) control pattern width and length; the profile angle was kept within about ±1°, the contact-length coefficient within 0.35–0.5, and \(K_p\) within 2–6. Basic machine-setting factors control pattern inclination. The profile separation coefficient controls TE amplitude, the contact-position coefficient moves the pattern along the face, and the offset moves it along the tooth height. The ease-off module allows finer correction in different directions, but excessive ease-off can produce distorted teeth, so it was used conservatively. The resulting static pattern met the intended size and position while remaining compatible with grinding.
System-level loaded contact and vibration prediction
After the static surface was fixed, the exact tooth geometry was transferred from GEMS into Masta. A system-level model was built with the gear shafts, bearings and casing. Full meshes of the shafts and casing were imported, the bearings were modeled in detail, and the bearing nodes were connected to the shaft and casing through condensed interface nodes. This is a different level of analysis from a gear-pair TCA: the shaft bending, bearing clearance and casing compliance all contribute to the loaded pattern.
The bearing clearance set included 274 µm axial clearance for the pinion ball bearing, 64 µm radial clearance for pinion roller bearing 1, 40–70 µm radial clearance for pinion roller bearing 2, 702 µm axial clearance for the wheel ball bearing, and 150 µm radial clearance for the wheel roller bearing. Inner- and outer-race fits, casing bores and shaft seats were represented by their tolerance ranges. Machining error is random in production, but its magnitude is bounded by the dimension chain along the casing–shaft–bearing mounting path, so the maximum error from the tolerance stack was applied in the model. The operating point was 18,000 r/min input speed and 300 N·m output torque.
LTCA gave the loaded contact pattern and TE. The loaded pattern area was large, which is generally favorable for distributing the contact load. However, the peak contact stress reached 1,088 MPa, above the material yield strength of 980 MPa and close to the ultimate strength of 1,230 MPa. The pattern was also displaced toward the edges: the wheel pattern was biased toward the root and the small end, while the pinion pattern was biased toward the addendum and the small end. The design therefore satisfied the TE-based vibration check but not the strength requirement. The TE peak-to-peak value was 62 µrad, and the main excitation orders were the first and second mesh frequencies and higher harmonics, with small amplitudes.
Vibration analysis was performed at the pinion bearing location, with a damping ratio of 0.01 assumed in the model. The predicted resonance peaks were 2,245, 2,837, 4,219, 5,292, 5,832, 6,426, 14,117, 14,708 and 19,461 r/min, with acceleration amplitudes ranging from 555 to 2,477 m/s². The distribution is consistent with the intended aero-engine duty: several low-speed resonances that can be passed quickly, and fewer high-speed resonances for long-duration operation.
Experimental validation
The simulation model was checked with a gearbox test. Before assembly, the static pattern was transferred on a gear rolling tester. After the loaded test, the dynamic pattern was photographed or transferred for comparison. An accelerometer was mounted on the pinion casing to record vibration acceleration. The comparison covered pattern shape, position and size under both static and loaded conditions.
The measured static and dynamic patterns agreed with the simulated patterns in shape, position and size. This supports the use of the system-level model for pattern prediction. The measured vibration response also showed the same overall trend as the simulation: a resonance band at low speed, lower amplitude in the intermediate speed range, and two high-speed peaks before the response settled. The measured resonance speeds are compared with the simulated values in the table.
| Simulated speed (r/min) | Measured speed (r/min) | Deviation (%) |
|---|---|---|
| 4,219 | 4,449 | 5.45 |
| 5,292 | 5,330 | 0.72 |
| 5,832 | 5,473 | −6.16 |
| 6,426 | 6,225 | −3.13 |
| 14,117 | 12,820 | −9.19 |
| 14,708 | 13,570 | −7.74 |
The maximum deviation between simulated and measured resonance speeds was below 10%. No clear measured counterpart was identified for the simulated peaks at 2,245, 2,837 and 19,461 r/min. The absolute acceleration amplitudes were not directly comparable: the simulation produced 555–2,477 m/s², while the measured values were 87.56–208.6 m/s². This difference is expected because the damping value was assumed rather than identified. The validated outputs are therefore the pattern location and the resonance-speed trend, not the absolute vibration amplitude. Within that scope, the model is reliable enough to guide tooth-surface optimization.
Optimization and trade-offs
The initial surface was strength-limited, so the radial position and pressure angle were adjusted within the manufacturing range to produce a new surface. The revised loaded pattern moved toward the heel and the middle of the face, giving a more balanced load distribution. The peak contact stress fell to 896 MPa, below the 980 MPa yield strength. The TE peak-to-peak value was 72 µrad, slightly above the 62 µrad of the initial design, but the peak TE range dropped from 490–560 µrad to 260–340 µrad. The main excitation orders remained the first and second mesh frequencies and higher harmonics, with small amplitudes.
| Metric | Initial design | Optimized design |
|---|---|---|
| Peak contact stress | 1,088 MPa | 896 MPa |
| TE peak-to-peak | 62 µrad | 72 µrad |
| Peak TE range | 490–560 µrad | 260–340 µrad |
| Low-speed resonances | 6, from 2,245 to 6,426 r/min | 4, from 2,619 to 5,922 r/min |
| High-speed resonances | 14,117; 14,708; 19,461 r/min | 14,039; 14,693; 19,406 r/min |
| Highest high-speed amplitude | 1,519 m/s² | 1,383 m/s² |
The vibration result is a trade-off rather than a uniform improvement. The number of low-speed resonances fell from six to four, which reduces the speed ranges that must be avoided or traversed quickly. The high-speed resonance speeds changed by only about 1.5%, and the highest high-speed amplitude decreased from 1,519 to 1,383 m/s². However, the low-speed amplitudes were not all lower; for example, the optimized 5,922 r/min peak reached 2,623 m/s². The strength gain and the reduction in low-speed resonance count are clear, while the low-speed amplitude penalty must be considered in the final duty-cycle assessment.
What the method establishes
The method is a closed loop: define the target loaded pattern and TE, generate a manufacturable tooth surface, analyze the complete gear–shaft–bearing–casing system under load, validate the pattern and resonance behavior by test, then optimize the surface within the same manufacturing constraints. This differs from after-the-fact pattern analysis because the surface is changed before commitment, and it differs from a gear-pair-only TCA because the system compliance and bearing clearance are present in the prediction.
The case also shows the limits of the validation. The pattern comparison supports the model, and the resonance speeds agree within 10%, but the absolute vibration amplitudes are not validated because the damping ratio was assumed at 0.01. The analysis used one operating point, 18,000 r/min and 300 N·m, and applied maximum tolerance values rather than a statistical distribution of machining and assembly errors. Off-design loads, transient maneuvers and production scatter would require additional load cases and tolerance studies. Within those limits, the approach is applicable to aero-engine spiral bevel gearboxes and other precision bevel drives where the loaded contact pattern and TE are specified as functional requirements rather than inspected after the fact.