
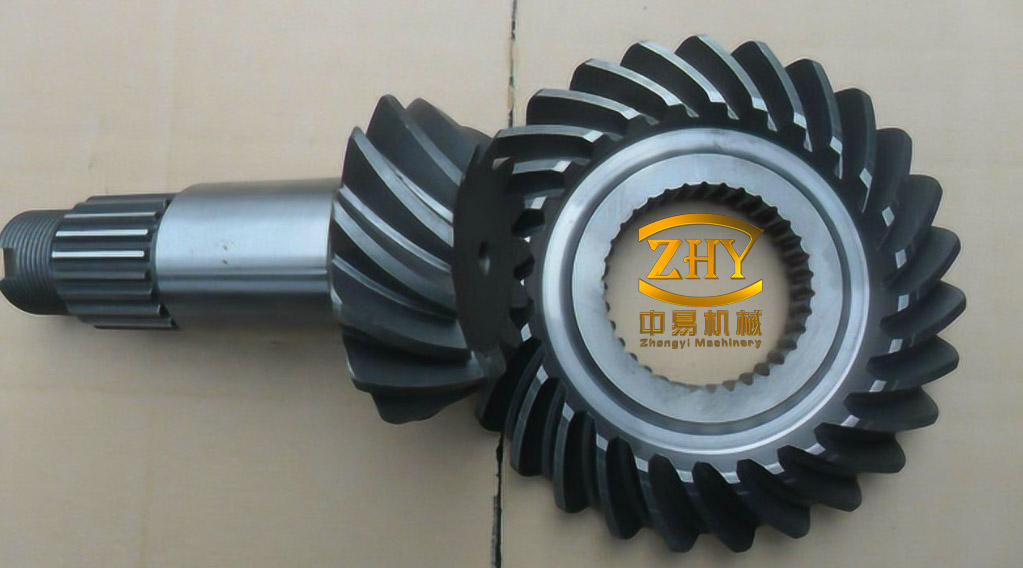
A spiral bevel gear transmits torque between intersecting shafts through teeth whose flanks are curved along the face width. The curvature produces a localized, slightly mismatched contact zone instead of full conjugate contact, which is what makes the drive insensitive to small mounting errors, but it also means that the meshing quality is governed by where, how large and how oriented that contact zone is. In aero-engine accessory and power take-off gearboxes, the same gear pair must carry high torque through thin-walled shafts and housings, run at speeds where mesh harmonics excite structural modes, and remain tolerant of bearing clearance and manufacturing scatter. Contact pattern and transmission error are therefore treated as the primary design outputs, not as inspection results obtained after the fact.
From passive cutting to active pattern control
Classical Gleason practice fixes the machine settings first, cuts the flanks, and then checks the pattern on a rolling tester. If the pattern falls outside the requirement, the settings are adjusted and the part is cut again. This loop is empirical: the pattern is a consequence of cutting parameters, and the designer has no direct handle on the pattern that will appear under torque. Active design reverses the sequence. The target pattern and transmission error under the actual working load are specified first, the flank form that produces them is synthesized, and the cutting data are derived from that flank. The loop then closes through a system-level simulation model, which must be accurate enough that an optimized flank can be released to the shop floor without a second hardware iteration.
Three physical effects separate the pattern on a rolling tester from the pattern in service: elastic deflection of shafts, bearings and housing under torque; bearing internal clearance and race fits, which displace the pinion and wheel axes relative to each other; and machining tolerance in the bore-and-shaft load path. A gear-pair-only model cannot capture the first and third of these, and its predictions of edge contact and stress are correspondingly optimistic.
Baseline geometry and static pattern synthesis
The case studied is an aero-engine spiral bevel gearbox with an 80° shaft angle, 43 and 49 teeth, a normal module of 3.3 mm, a face width of 21 mm, a 35° spiral angle and a 20° pressure angle, cut with a 95.25 mm cutter radius. The flanks are generated by a five-cut process and finished by grinding, with a normal backlash of 0.16–0.38 mm. The design load case is 18,000 r/min at the pinion and 300 N·m at the output.
| Parameter | Pinion | Wheel |
|---|---|---|
| Number of teeth | 43 | 49 |
| Hand of spiral | Right | Left |
| Face width / mm | 21 | 21 |
| Normal module / mm | 3.3 | |
| Spiral angle / (°) | 35 | |
| Pressure angle / (°) | 20 | |
| Shaft angle / (°) | 80 | |
| Cutter radius / mm | 95.25 | |
| Tooth form | Standard | |
| Cutting method | Five-cut generating process | |
| Finishing | Grinding | |
| Normal backlash / mm | 0.16–0.38 | |
Flank synthesis starts in a commercial bevel gear design environment (GEMS), where the macro geometry and cutter data produce an exact tooth surface, followed by tooth contact analysis (TCA) of the conjugate pair. The first TCA result is unusable as a design: the contact zone covers more than 90% of the tooth height. Such a pattern looks favorable on paper but leaves no margin for deflection or misalignment, and any load-induced shift pushes the contact over the tooth edges. The target for the unloaded state is a toe-biased pattern occupying roughly 50% of both tooth height and face width — small enough to tolerate displacement, large enough to keep the contact ratio and load distribution acceptable.
Modification is carried out with two families of parameters. In the TCA module, cutter profile angle (adjusted within ±1°), the contact-length coefficient (held between 0.35 and 0.5) and the profile coefficient Kp (2–6) set the length and width of the zone; basic factors control the tilt of the pattern, the profile separation coefficient sets the transmission error amplitude, the contact position coefficient moves the pattern along the face width, and the offset distance moves it along the tooth height. An ease-off module allows finer correction in each direction, at the risk of generating distorted teeth if overused. The resulting static pattern meets the 50% target and is toe-biased, providing the margin needed for the loaded analysis that follows.
System-level loaded contact analysis
The modified flanks are transferred as exact surfaces into a multibody/finite-element drivetrain environment (Masta), where the shaft, bearing and housing models are assembled. Full meshes of the gear shafts and the housing are imported, detailed bearing models are built internally, and the components are joined through nodes condensed from the connecting surfaces. This retains the compliance of the load path — including the thin-walled housing — while keeping the loaded tooth contact analysis (LTCA) computationally tractable.
Load, clearance and tolerance are applied before the LTCA solve. The tolerance values are taken at their worst-case limits, since machining error is random in sign but bounded by the dimension chain, and its dominant contribution lies on the force path between housing bore, bearing ring and shaft seat. Bearing clearance and fit tolerances are listed in Table 2.
| Bearing | Clearance | Housing tolerance / µm | Shaft tolerance / µm |
|---|---|---|---|
| Pinion ball bearing | Axial, 274 µm | +10 / +21 (inner), −10 / +10 (outer) | −8 / 0 |
| Pinion roller bearing 1 | Radial, 64 µm | +10 / +21 (inner), −10 / +10 (outer) | −9 / 0 |
| Pinion roller bearing 2 | Radial, 40–70 µm | +20 / +33 (inner), −10 / +10 (outer) | −6 / 0 |
| Wheel ball bearing | Axial, 702 µm | +40 / +65 (inner), +60 / +89 (outer) | −10 / 0 |
| Wheel roller bearing | Radial, 150 µm | +50 / +75 (inner), −12 / +12 (outer) | −13 / 0 |
Under the design load the predicted contact area is large, which favors load sharing, but the peak contact stress reaches 1,088 MPa. That exceeds the 980 MPa yield strength of the gear material and approaches its 1,230 MPa ultimate strength, so the baseline flank does not satisfy the strength requirement. The pattern position is also unfavorable: the wheel contact sits toward the root at the small end, and the pinion contact toward the tip at the small end. This configuration concentrates bending stress at the tooth root of the wheel while loading the pinion near its tip, both of which reduce life. The baseline is therefore retained only as the reference case for subsequent optimization.
Mesh excitation and vibration response
Transmission error is the kinematic deviation of the output from the nominal ratio, evaluated as
$$\varepsilon(\varphi_1)=\varphi_2-\frac{N_1}{N_2}\,\varphi_1,\qquad \Delta\varepsilon=\varepsilon_{\max}-\varepsilon_{\min}$$
where $\varphi_1$ and $\varphi_2$ are the rotation angles of pinion and wheel, $N_1$ and $N_2$ their tooth numbers, and $\Delta\varepsilon$ the peak-to-peak transmission error, reported here in µrad. Because the loaded contact is a mismatched point contact, the instantaneous ratio equals the nominal ratio only at the design reference point, and the residual error acts as a displacement excitation at the mesh harmonics. At 18,000 r/min with 43 pinion teeth, the first mesh order falls at 12.9 kHz.
For the baseline flank, $\Delta\varepsilon$ is 62 µrad, dominated by the first and second mesh orders with only small higher-order content. The vibration response is computed at the pinion bearing location with a modal damping value of 0.01, and the acceleration root-mean-square is plotted against speed. Nine resonances appear in the simulated speed range: a dense cluster between 2,245 and 6,426 r/min, and a second group at 14,117, 14,708 and 19,461 r/min (Table 4). This distribution suits an aero-engine duty cycle in which low speeds are traversed quickly and high speeds are held for long periods, since the high-speed region contains fewer resonances.
Rig verification of pattern and vibration
Verification used two pieces of hardware. Static patterns were replicated on a rolling tester before assembly, and the assembled gearbox was run on an instrumented rig with accelerometers bonded to the pinion housing at the location used in the simulation. After the loaded runs, the service pattern was replicated and photographed. Comparison covered three attributes of the pattern — shape, position and size — and the measured and predicted patterns agreed in all three, for both the unloaded and the loaded state.
Speed-sweep results are compared in Table 3. Every simulated resonance inside the measured window of 4,000–18,000 r/min was detected, with a speed deviation not exceeding 9.2%. The two lowest simulated resonances (2,245 and 2,837 r/min) lie below the sweep range and the 19,461 r/min peak above it, so no measured counterpart exists for them.
| Simulated speed / (r/min) | Simulated amplitude / (m/s²) | Measured speed / (r/min) | Measured amplitude / (m/s²) | Speed deviation / % |
|---|---|---|---|---|
| 2,245 | 555 | — | — | — |
| 2,837 | 556 | — | — | — |
| 4,219 | 1,382 | 4,449 | 136.0 | 5.45 |
| 5,292 | 2,008 | 5,330 | 208.6 | 0.72 |
| 5,832 | 2,477 | 5,473 | 141.7 | −6.16 |
| 6,426 | 857 | 6,225 | 95.0 | −3.13 |
| 14,117 | 998 | 12,820 | 97.9 | −9.19 |
| 14,708 | 931 | 13,570 | 87.6 | −7.74 |
| 19,461 | 1,519 | — | — | — |
The absolute amplitudes are not comparable: the simulated values exceed the measured ones by roughly an order of magnitude because damping in the assembled structure cannot be represented by a single assumed value of 0.01. What the comparison does establish is that the speed placement and the relative height of the peaks are reproduced, and that the measured response shows the same three-band structure — a resonance-rich low-speed band at 4,000–6,500 r/min, a quiet band at 6,500–12,500 r/min, and two high-speed peaks above 12,500 r/min followed by a flat region. Given that pattern, resonance placement and amplitude trend all agree, the model is considered validated for design use, with the caveat that it predicts frequencies rather than absolute vibration levels.
Flank optimization: stress relief versus resonance placement
The baseline failure mode is stress-driven, with a secondary penalty from the toe-root pattern position on the wheel. Optimization therefore moved the pattern toward the heel and the middle of the face by changing the radial position and pressure angle of the cutter, then re-ran the full loaded and vibrational analysis.
| Metric | Baseline flank | Optimized flank |
|---|---|---|
| Peak contact stress / MPa | 1,088 | 896 |
| Material yield / ultimate strength / MPa | 980 / 1,230 | |
| Peak-to-peak transmission error / µrad | 62 | 72 |
| Extreme values of the error trace / µrad | 490–560 | 260–340 |
| Pattern position | Toe, wheel root / pinion tip | Mid-face to heel |
The stress reduction is decisive: 896 MPa stays below the 980 MPa yield strength, so the strength criterion is met. The pattern shift toward the heel and mid-face also distributes load away from the tooth edges and reduces the root bending penalty on the wheel. On mesh excitation the picture is mixed. The peak-to-peak transmission error rises slightly, from 62 to 72 µrad, while the extreme values of the error trace fall from 490–560 µrad to 260–340 µrad; the two figures are different measures of the same LTCA output, and their divergence indicates that the error was redistributed within the mesh cycle rather than uniformly reduced. The dominant orders remain the first and second mesh harmonics, and the higher-order content stays small.
| Baseline speed / (r/min) | Baseline amplitude / (m/s²) | Optimized speed / (r/min) | Optimized amplitude / (m/s²) | Speed deviation / % | Amplitude change / % |
|---|---|---|---|---|---|
| 2,245 | 555 | — | — | — | — |
| 2,837 | 556 | 2,619 | 1,051 | −7.68 | +89.0 |
| 4,219 | 1,382 | 4,052 | 1,887 | −3.96 | +36.5 |
| 5,292 | 2,008 | 5,196 | 1,816 | −1.81 | −9.6 |
| 5,832 | 2,477 | 5,922 | 2,623 | +1.54 | +5.9 |
| 6,426 | 857 | — | — | — | — |
| 14,117 | 998 | 14,039 | 1,179 | −0.55 | +18.1 |
| 14,708 | 931 | 14,693 | 798 | −0.10 | −14.3 |
| 19,461 | 1,519 | 19,406 | 1,383 | −0.28 | −9.0 |
Two low-speed resonances disappear and the high-speed peaks shift by less than 0.6% in speed, with the largest high-speed amplitude falling from 1,519 to 1,383 m/s². The cost appears in the low-speed band, where the surviving resonances grow by up to 89% in amplitude under the same assumed damping. For the intended duty cycle this is an acceptable trade: the low-speed band is traversed rapidly and the high-speed band is where the gearbox spends its life, so removing resonances there and lowering the peak stress is worth a temporary amplification during acceleration. It is, however, a genuine trade rather than a uniform improvement, and a duty cycle with prolonged low-speed operation would require the weighting to be revisited.
What the method does and does not establish
The workflow gives a closed chain from a target pattern to a ground flank: macro geometry and cutter data define the surface, TCA sets the unloaded pattern, a system-level LTCA with clearance and worst-case tolerance predicts the loaded pattern and stress, and a dynamic analysis places the mesh harmonics against the structural resonances. Because the same model is used for both the baseline and the optimized flank, and because the model reproduces measured patterns and resonance speeds within 9.2%, the optimized flank can be released without an intermediate hardware iteration.
Several limits follow from the modeling choices. Absolute vibration amplitude is not predicted, since the single damping value of 0.01 is an assumption rather than an identified property; only speed placement and relative trends carry information. The tolerance treatment is worst-case rather than statistical, so the predicted stress is a conservative bound for a given batch rather than an expected value. The loaded analysis is quasi-static in the sense that mesh excitation is extracted from the LTCA result and applied to a linear structural model, which captures the resonance structure but not nonlinear contact loss or clearance-induced impacts. Thermal growth of the housing and shafts, and the stiffness of the lubricant film, are not separated from the mechanical compliance in this class of model, and they matter more as the gearbox temperature range widens.
Conclusions
An active contact-pattern design method for aero spiral bevel gears was established and demonstrated on an 80° shaft-angle, 43/49-tooth gearbox running at 18,000 r/min and 300 N·m. Static TCA reduced an over-wide initial pattern covering more than 90% of the tooth height to a toe-biased zone of about 50% in both directions, creating the margin needed for load-induced displacement. A system-level model combining exact flanks, detailed bearings and condensed shaft and housing meshes, loaded with worst-case fit tolerances and bearing clearance, predicted a peak contact stress of 1,088 MPa, above the 980 MPa yield strength, together with an unfavorable toe-root pattern on the wheel and a 62 µrad peak-to-peak transmission error.
Rolling-tester replicas and rig accelerometer data confirmed the model: pattern shape, position and size matched in both unloaded and loaded states, and all six simulated resonances inside the 4,000–18,000 r/min window were measured with speed deviations below 9.2%. Optimizing the radial position and pressure angle moved the pattern to mid-face and heel, lowered the peak contact stress to 896 MPa, eliminated two low-speed resonances and reduced the largest high-speed amplitude from 1,519 to 1,383 m/s², while raising the amplitudes of the remaining low-speed resonances and slightly increasing the peak-to-peak transmission error to 72 µrad. The result is a flank that satisfies the strength requirement and matches the high-speed-dwell duty cycle of an aero-engine gearbox, obtained without a hardware iteration between the baseline and the optimized design.