
In this study, we present a comprehensive investigation into the dynamic wear behavior and performance degradation of helical gears in high-speed train axle-suspended gearboxes. We developed a coupled dynamic wear model that integrates the SIMPACK multibody dynamics software with the Archard wear theory, incorporating critical factors such as gearbox bearings, elastic suspension of the housing, wheel-rail adhesion loads, and train vibration excitations. The model accounts for the dynamic coupling between internal and external excitations and gear wear, enabling realistic prediction of tooth surface wear evolution over a maintenance cycle of 1.2 million kilometers. We validated the model against experimental data and literature, and then systematically analyzed the influence of running speed, motor input torque, axle load, transmission error, backlash, and track irregularity on wear and performance indicators such as mesh stiffness and housing vibration. Our results reveal that wear accumulates non-uniformly along the tooth profile and width, with the root side and the rear face of the driving pinion experiencing the highest wear. Increasing operating parameters exacerbates wear, while transmission error and train vibration significantly accelerate performance degradation. By using tables and formulas, we summarize key findings to support gearbox maintenance and design.
1. Introduction
Helical gears are widely used in high-speed train transmissions due to their high contact ratio, smooth operation, and strong load-carrying capacity. However, prolonged service under high speed, heavy load, and continuous operation inevitably leads to tooth surface wear, which degrades the dynamic performance and reliability of the gearbox. Understanding the wear mechanism and the coupled effect of internal and external excitations is essential for predicting the remaining useful life and scheduling condition-based maintenance. In this work, we focus on the dynamic wear of a typical axle-suspended helical gearbox used in high-speed trains. Unlike previous studies that often simplified the gearbox as a pure torsional system or ignored the coupling with vehicle dynamics, our model includes the flexibility of bearings, the elastic suspension of the gearbox housing, and the realistic wheel-rail adhesion and track irregularities. This allows us to capture the true dynamic load distribution on the helical gear teeth and the resulting wear progression. The key novelty of our approach is the dynamic coupling between wear and system response: as wear modifies the tooth profile, the mesh stiffness, transmission error, and backlash change, which in turn alter the dynamic loads and further influence wear. We present a systematic analysis of various operating and excitation parameters, using extensive tabulated data and mathematical formulas to highlight the trends.
2. Dynamic Wear Model for Helical Gears
2.1 Multibody Gearbox Model
We built a detailed multibody model of the high-speed train gearbox in SIMPACK, as shown conceptually in the figure below. The model comprises the driving pinion (number of teeth \( z_1 = 35 \)) and the driven gear (\( z_2 = 85 \)) with a normal module \( m_n = 6 \) mm, pressure angle \( \alpha_n = 20^\circ \), helix angle \( \beta = 18^\circ \), and tooth width \( B = 66 \) mm for the pinion and 65 mm for the gear. The gear pair is connected through a force element (225: gear pair) with time-varying mesh stiffness computed using the slice method and energy method according to DIN 3990. The bearings supporting the pinion shaft (two cylindrical roller bearings NU215 and one angular contact ball bearing QJ214) and the gear shaft (two tapered roller bearings EC32944) are modeled with nonlinear stiffness and damping properties following ISO 16281. The gearbox housing is suspended from the bogie frame via C-shaped brackets with rubber bushings, represented by bushing elements (43) with nonlinear characteristics. The wheel-rail adhesion load is applied through a force element that simulates the traction and braking forces, while the train vibration excitation is introduced either by importing measured track irregularities or by integrating the gearbox as a subsystem into a full vehicle model. The dynamic normal load on the gear pair, \( F_n(t) \), is obtained from the multibody simulation.
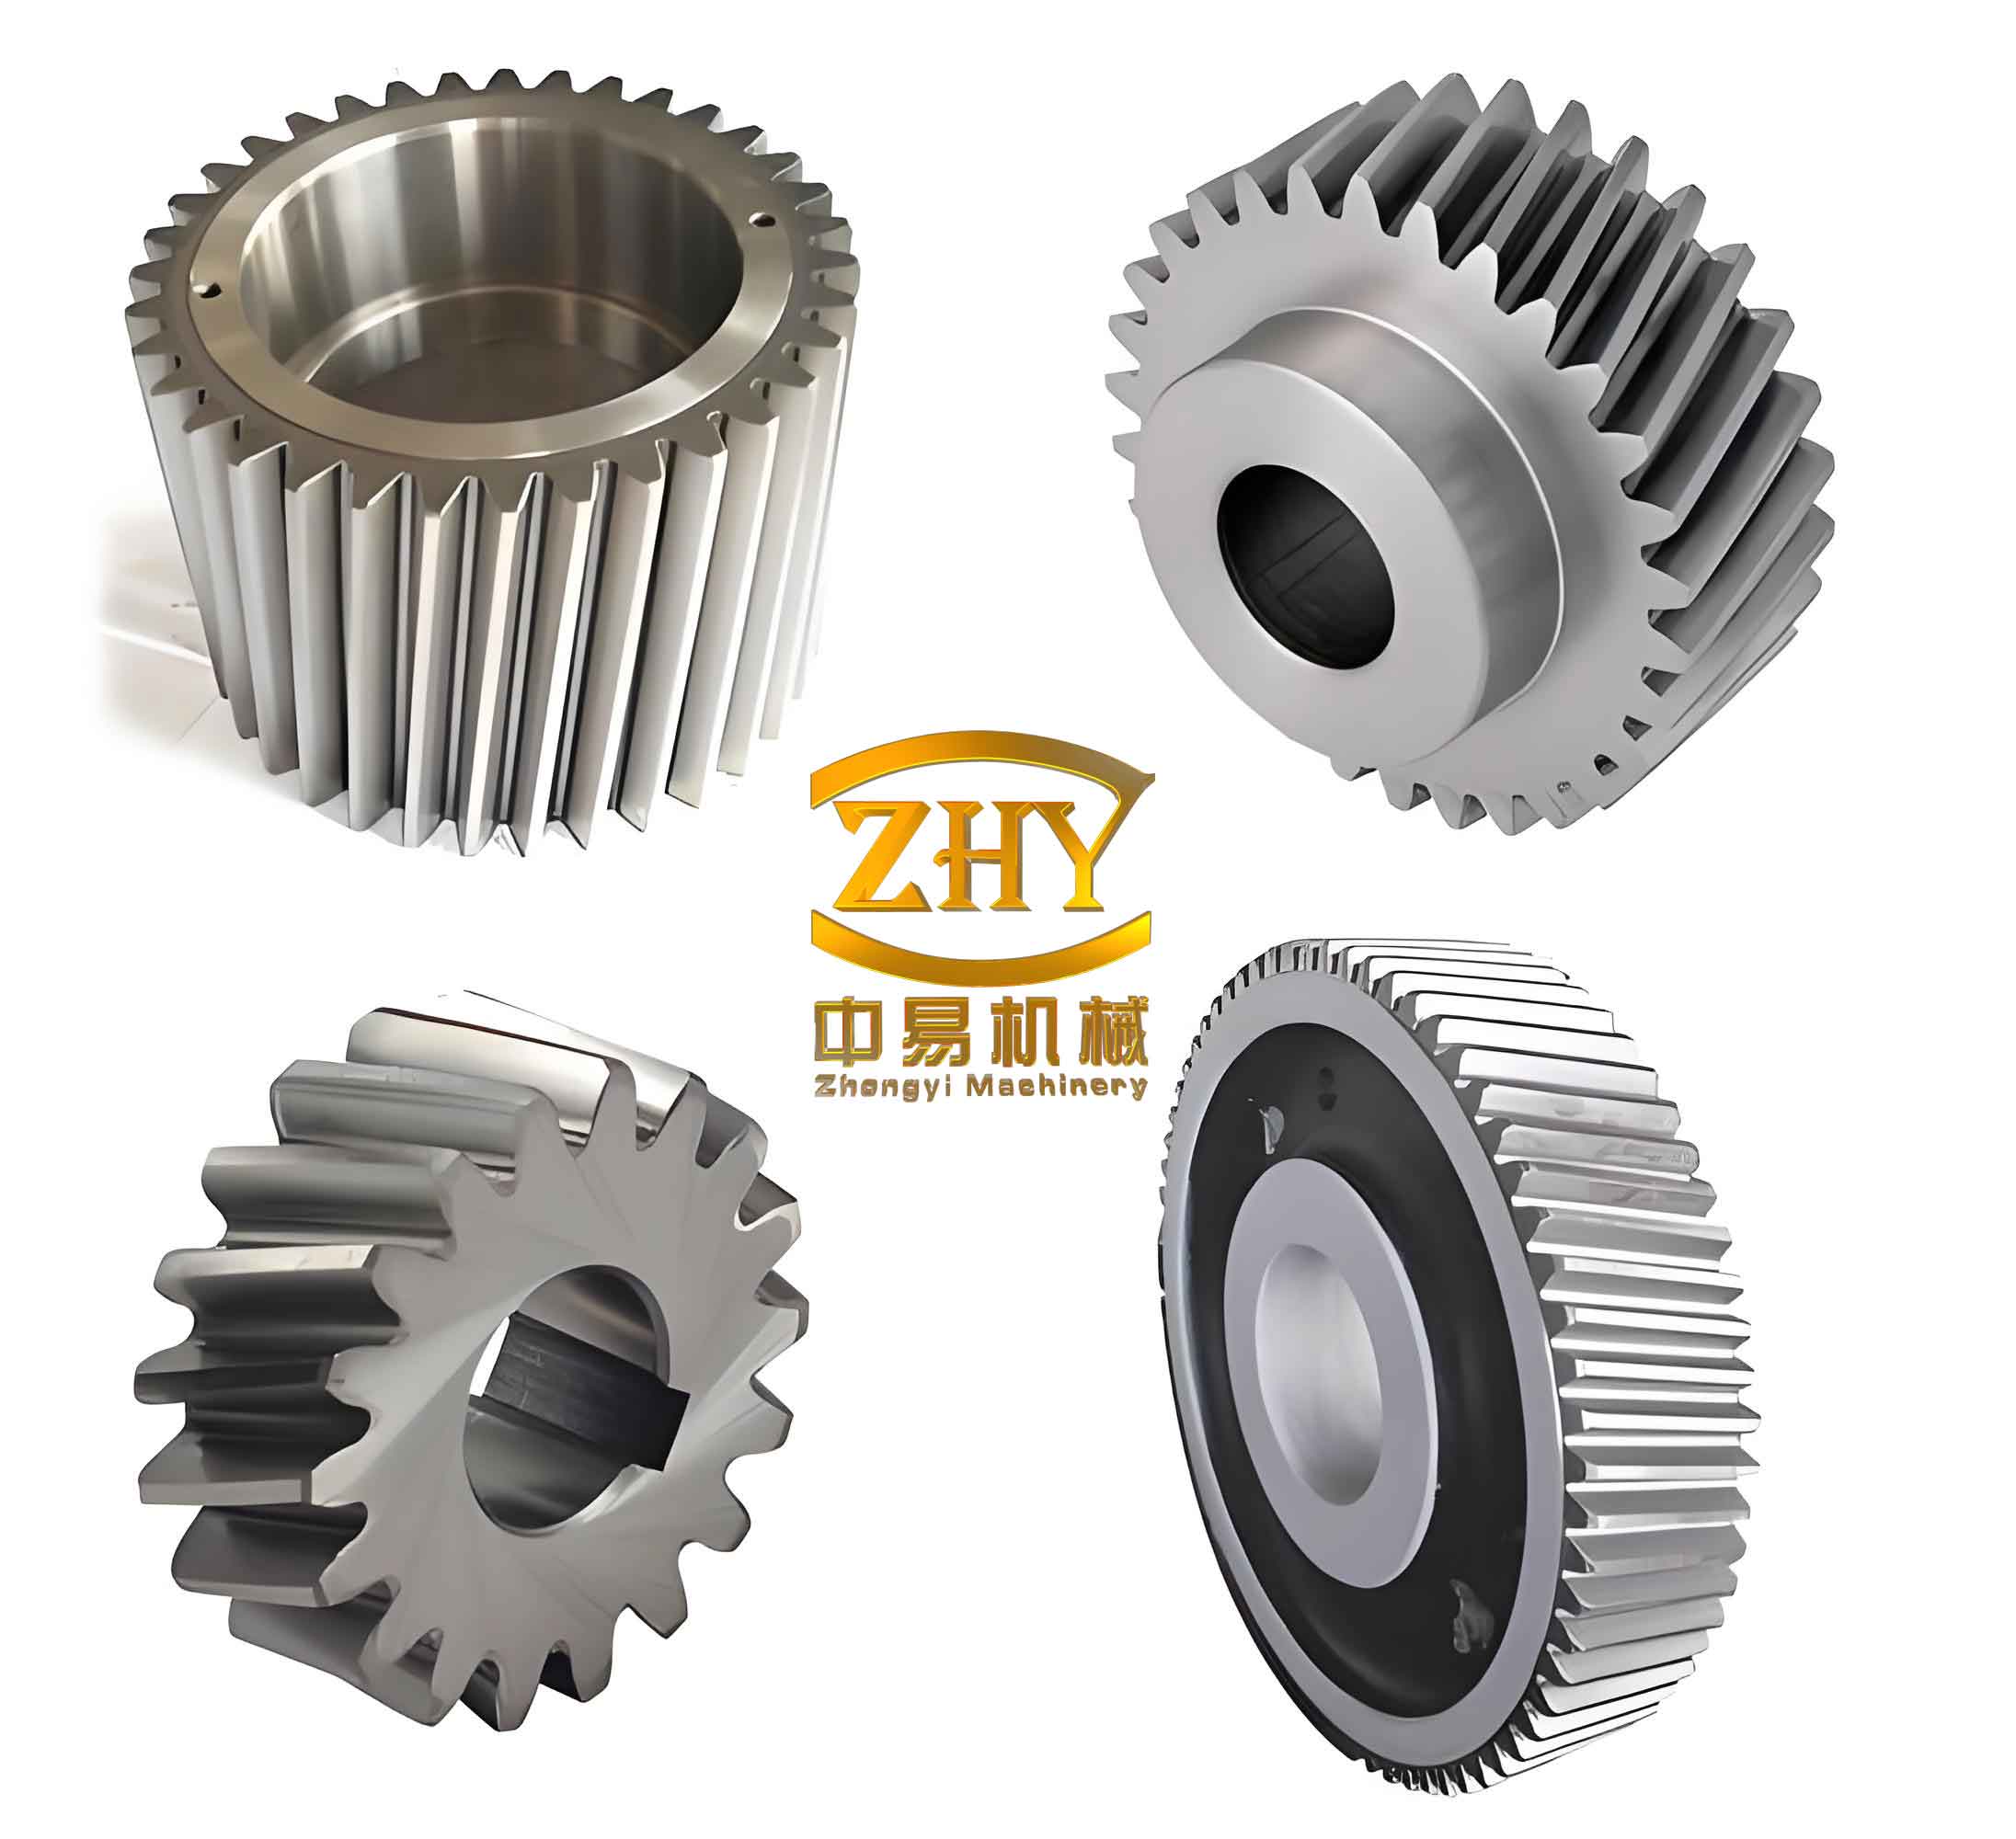
Figure 1: Schematic of the helical gear dynamic wear model used in this study (image of helical gears).
2.2 Dynamic Load Distribution on Contact Lines
The total normal load \( F_n(t) \) is distributed among the multiple tooth pairs in contact using the time-varying contact line length method. The total contact line length \( L(t) \) is the sum of the lengths of all active contact lines in the mesh cycle. Since the total contact ratio \( \gamma_\varepsilon = 2.648 \), there are either two or three pairs in contact at any instant. The length of the \( k \)-th contact line, \( l_k(t) \), is related to the first one by:
$$
l_k(t) = l_1(t – (k-1)T_m), \quad k=1,2,\dots,\lceil \gamma_\varepsilon \rceil
$$
where \( T_m \) is the mesh period. The load on the \( k \)-th tooth pair is then:
$$
F_k(t) = F_n(t) \cdot \frac{l_k(t)}{L(t)}
$$
This approach assumes uniform pressure along each contact line and is a practical simplification validated for moderate helix angles.
2.3 Archard Wear Model
We discretize the tooth surface into an \( I \times J \) grid along the profile and face width directions. For each grid point \( (i,j) \), the wear depth per mesh cycle, \( \Delta h_{n,ij} \), is obtained from the generalized Archard equation:
$$
\Delta h_{n,ij} = k_{ij} \, p_{ij} \, s_{n,ij}, \quad n=1,2
$$
where \( n=1 \) denotes the driving pinion and \( n=2 \) the driven gear. \( p_{ij} \) is the average Hertzian contact pressure in the contact ellipse:
$$
p_{ij} = \frac{4 f_{ij}}{3 \pi a_{ij}}
$$
with \( f_{ij} \) being the load per unit length, and \( a_{ij} \) the half-contact width:
$$
a_{ij} = \sqrt{\frac{4 f_{ij} \rho_{ij}}{\pi E_{eq}}}
$$
Here, \( \rho_{ij} \) is the equivalent radius of curvature at point \( (i,j) \), and \( E_{eq} \) is the equivalent Young’s modulus. The sliding distances, \( s_{1,ij} \) and \( s_{2,ij} \), are given by:
$$
s_{1,ij} = \frac{2 a_{ij} |\rho_{1,ij} \omega_1 – \rho_{2,ij} \omega_2|}{\rho_{1,ij} \omega_1}, \quad
s_{2,ij} = \frac{2 a_{ij} |\rho_{1,ij} \omega_1 – \rho_{2,ij} \omega_2|}{\rho_{2,ij} \omega_2}
$$
The wear coefficient \( k_{ij} \) is determined using the Janakiraman regression formula for mixed elastohydrodynamic lubrication conditions, which fits the high-speed train gear material (18CrNiMo7-6, hardened to 60–62 HRC):
$$
k_{ij} = 3.981 \times 10^{-29} \cdot (L)^{1.219} \cdot (G)^{7.377} \cdot (S)^{1.589} \cdot E_{eq}
$$
where the dimensionless parameters are:
$$
L = \frac{f_{ij}}{E_{eq} \rho_{ij}}, \quad G = \alpha E_{eq}, \quad S = \frac{\sqrt{R_{q1}^2 + R_{q2}^2}}{\rho_{ij}}
$$
with \( \alpha = 2.3683 \times 10^{-8} \) m²/N being the pressure-viscosity coefficient, and \( R_{q1}=R_{q2}=0.44 \) μm the root-mean-square surface roughness.
2.4 Cumulative Wear Iteration
Since the wear per mesh cycle is very small (on the order of nanometers), we update the tooth profile every \( 5 \times 10^4 \) km of train operation. The number of mesh cycles for the pinion and gear over a distance increment \( \Delta x_w \) is:
$$
\zeta_1 = \frac{\Delta x_w}{\pi d_w} i_g, \quad \zeta_2 = \frac{\Delta x_w}{\pi d_w}
$$
where \( d_w = 0.915 \) m is the wheel diameter and \( i_g = z_2/z_1 = 2.4286 \). The cumulative wear after the \( q \)-th update is:
$$
h_{n,ij} = \sum_{q=1}^{N} \zeta_n^{(q)} \Delta h_{n,ij}^{(q)}
$$
We repeat this process until the total mileage reaches 1.2 million km (the typical third-stage maintenance interval for high-speed trains in China).
3. Validation and Comparison of Modeling Fidelity
3.1 Model Validation
We first validated our dynamic wear calculation method by comparing with the results of Flodin and Andersson (1997) and Zhou et al. (2018) using a common helical gear case. The wear depth along the face width at the front, middle, and rear sections of the pinion matched well in trend, confirming the correctness of our implementation. Then, we validated the multibody gearbox model by comparing the vertical acceleration spectrum at the input bearing housing with a bench test of the same gearbox type under 300 km/h and two torque levels (500 N·m and 1000 N·m). The mesh frequency peak (theoretical 2716.5 Hz) was captured with deviations less than 0.45% in frequency and reasonable amplitude agreement.
3.2 Comparison of Different Model Fidelity Levels
We compared five models with increasing complexity: Model 1 – pure torsional; Model 2 – with bearings; Model 3 – with bearings and suspension (our baseline); Model 4 – Model 3 plus externally imposed track irregularity; Model 5 – Model 3 integrated into a full vehicle model (fully coupled). Table 1 summarizes the single meshing maximum wear at the beginning and end of the maintenance cycle. The results show that incorporating more realistic supporting conditions and vehicle dynamics increases wear predictions.
| Model | At 0 km | At 1.2×10⁶ km |
|---|---|---|
| Model 1 (pure torsional) | 1.15 | 1.19 |
| Model 2 (+ bearings) | 1.21 | 1.26 |
| Model 3 (+ suspension) | 1.24 | 1.29 |
| Model 4 (+ imposed irregularity) | 1.28 | 1.39 |
| Model 5 (full vehicle coupled) | 1.27 | 1.48 |
Model 3 gives 7.9% higher initial wear than Model 1, highlighting the importance of bearing flexibility and housing suspension. At the end of life, Model 5 predicts 6.2% higher wear than Model 4, indicating the significance of coupling between wear and train vibrations. Therefore, we adopt Model 5 for the subsequent parametric studies.
4. Results and Discussion
4.1 Influence of Train Operating Parameters
We examined the effect of running speed (200, 250, 300, 350 km/h), motor input torque (500, 1000, 1500 N·m), and axle load (15, 17, 19 t) on the pinion wear distribution. Table 2 presents the maximum cumulative wear (at the rear face root) after 1.2 million km. Higher speed, torque, and axle load all increase wear, with the largest sensitivity observed at the pinion root of the rear face.
| Parameter | Value 1 | Value 2 | Value 3 | Value 4 |
|---|---|---|---|---|
| Speed (km/h) | 200: 0.21 | 250: 0.29 | 300: 0.38 | 350: 0.47 |
| Torque (N·m) | 500: 0.21 | 1000: 0.38 | 1500: 0.56 | – |
| Axle load (t) | 15: 0.35 | 17: 0.38 | 19: 0.42 | – |
The growth is attributed to increased dynamic load fluctuations and sliding speeds at higher speeds, and higher normal loads for higher torque and axle load. The root region (where meshing starts for the pinion) experiences the greatest pressure and sliding, thus the highest wear.
4.2 Influence of Internal Excitations: Transmission Error and Backlash
4.2.1 Transmission Error
We introduced transmission errors as sinusoidal displacement excitations with amplitude e (0, 10, 20, 30 μm) superimposed on the cumulative wear profile. Figure 14 in the original text shows that larger e shifts the “running-in” period and accelerates wear. Table 3 quantifies the effect at the beginning and end of the maintenance cycle.
| e (μm) | Single meshing max wear at 0 km (×10⁻⁹ mm) | Single meshing max wear at 1.2×10⁶ km (×10⁻⁹ mm) | Average mesh stiffness at 1.2×10⁶ km (×10⁸ N/m) | Housing vert. accel. RMS at 1.2×10⁶ km (m/s²) |
|---|---|---|---|---|
| 0 | 1.24 | 1.29 | 11.4 | 6.8 |
| 10 | 1.42 | 1.63 | 11.0 | 8.2 |
| 20 | 1.60 | 1.86 | 10.5 | 9.5 |
| 30 | 1.77 | 2.18 | 9.8 | 10.6 |
With e = 30 μm, the final wear is 52.4% higher, mesh stiffness drops 10.8%, and housing RMS acceleration increases 43.2% compared to the ideal case (e=0). Transmission error exacerbates dynamic impacts and accelerates wear.
4.2.2 Backlash
We varied the nominal backlash b from 0.1 to 0.5 mm. Unlike error, backlash has a more moderate effect. The single meshing maximum wear initially decreases with b, reaches a minimum at around b = 0.3 mm for new gears and b = 0.2 mm for worn gears (due to wear adding ~0.1 mm effective clearance). The recommended design backlash of 0.286 mm from GB/Z 18620‑2008 coincides with our optimal value of 0.3 mm. Table 4 shows the wear and stiffness at the end of life.
| b (mm) | Single meshing max wear (×10⁻⁹ mm) | Average mesh stiffness (×10⁸ N/m) | Housing vert. accel. RMS (m/s²) |
|---|---|---|---|
| 0.1 | 1.33 | 11.2 | 7.0 |
| 0.2 | 1.28 | 10.9 | 7.6 |
| 0.3 | 1.26 | 10.5 | 8.1 |
| 0.4 | 1.31 | 10.1 | 8.7 |
| 0.5 | 1.38 | 9.7 | 9.4 |
Backlash larger than optimal increases wear and vibration due to impact. The stiffness decreases monotonically with backlash due to reduced tooth thickness.
4.3 Influence of Train Vibration Excitation
Finally, we compared three scenarios: (a) no train vibration (Model 3), (b) vibration from simulated rail irregularity without track (Model 4), and (c) full coupling with track irregularity in the vehicle model (Model 5). Table 5 summarizes the key indicators at the end of the maintenance cycle.
| Case | Single meshing max wear (×10⁻⁹ mm) | Average mesh stiffness (×10⁸ N/m) | Housing vert. accel. RMS (m/s²) |
|---|---|---|---|
| No vibration (Model 3) | 1.29 | 11.4 | 6.8 |
| With imposed irregularity (Model 4) | 1.39 | 10.9 | 10.2 |
| Full coupling (Model 5) | 1.48 | 10.8 | 10.8 |
The fully coupled case shows 13% higher wear than the no-vibration case, 58.8% higher housing acceleration RMS, and 5.3% lower stiffness. The coupling amplifies dynamic loads and accelerates degradation, especially when track irregularities are present.
4.4 Performance Degradation Trend
Throughout the 1.2 million km cycle, the single-meshing wear rate exhibits a three-stage behavior: a decreasing phase (running-in), a stable phase, and an accelerating phase (severe wear). The cumulative wear grows almost linearly because the rate changes slowly. However, the mesh stiffness gradually declines, and the housing vibration RMS increases, indicating progressive performance degradation. These trends are more pronounced when internal errors or external vibrations are present.
5. Conclusion
In this work, we developed a comprehensive dynamic wear model for helical gears in high-speed train gearboxes, integrating multibody dynamics with the Archard wear law. The model accounts for realistic internal and external excitations, including bearing flexibility, housing suspension, wheel-rail adhesion, and train vibrations. Our key findings are as follows:
- Wear on the tooth surface is non-uniform, with the highest values at the root side of the driving pinion near the rear face, and at the root of the driven gear near the front face. The cumulative wear over a maintenance cycle is approximately linear, but the single-meshing wear shows a three-stage evolution.
- Increasing running speed, motor torque, and axle load all intensify wear, with the maximum increment at the pinion root.
- Transmission error significantly accelerates wear and degrades performance: a 30 μm error increases wear by 52.4%, reduces mesh stiffness by 10.8%, and raises housing vibration by 43.2% at the end of life.
- Backlash has a milder effect; an optimal backlash around 0.25–0.3 mm minimizes wear and vibration during the maintenance interval.
- Train vibration excitation, especially from track irregularities, further elevates wear (13% increase) and performance degradation (58.8% higher vibration RMS, 5.3% lower stiffness). The coupling between vibration and wear accelerates the deterioration.
These insights provide valuable guidance for gearbox design, maintenance scheduling, and condition monitoring of high-speed train helical gears.