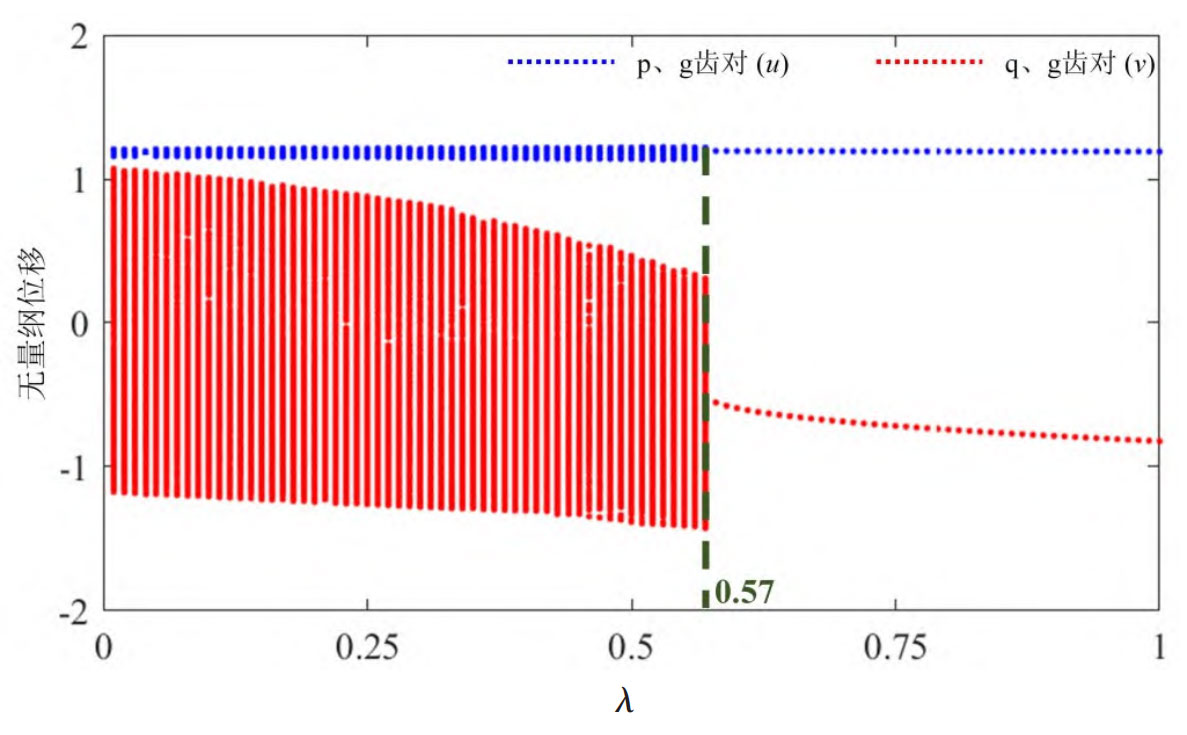
Figure 1 shows the dimensionless vibration displacement u and v of p, g tooth pairs, and q, g tooth pairs as a function of load ratio λ A bifurcation diagram of changes. For p and g tooth pairs, as the load ratio of the helical gear increases, the system undergoes quasi periodic motion( λ= 0 → 0.57) enters a stable single cycle motion state( λ= 0.57→1)。 Similarly, for q and g gear pairs, as the load ratio of the helical gear increases, the system experiences chaotic motion and stable single cycle motion in sequence.
Figures 2-3 show the system under different load ratios on helical gears λ The time-frequency curve, phase diagram, and Poin ⁃ car é cross-section of the dimensionless vibration displacement u at time. When λ When it is 0.1, the parameter u exhibits quasi single cycle vibration in the interval (0.7, 1.3), indicating that the p and g tooth pairs switch back and forth between the meshing and disengagement states of the positive teeth. The FFT plot contains a significant peak frequency of 0.5 (fundamental frequency) and a small amplitude vibration frequency of 1.0 (second harmonic). When λ When it is 0.8, the system is in a stable single cycle motion state, and the p and g tooth pairs also switch between the meshing and disengagement states.
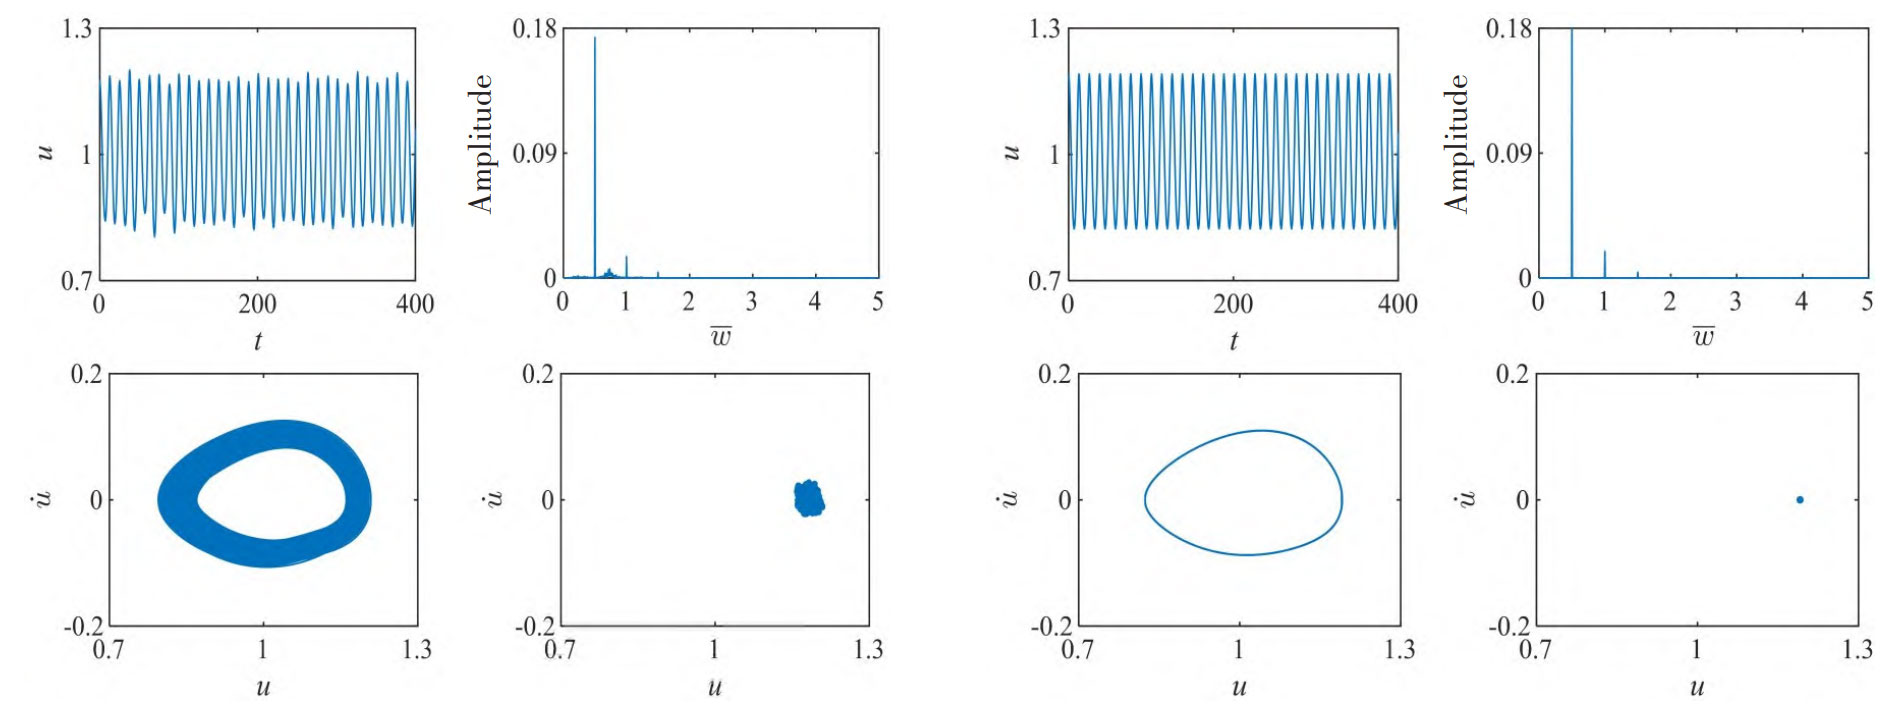
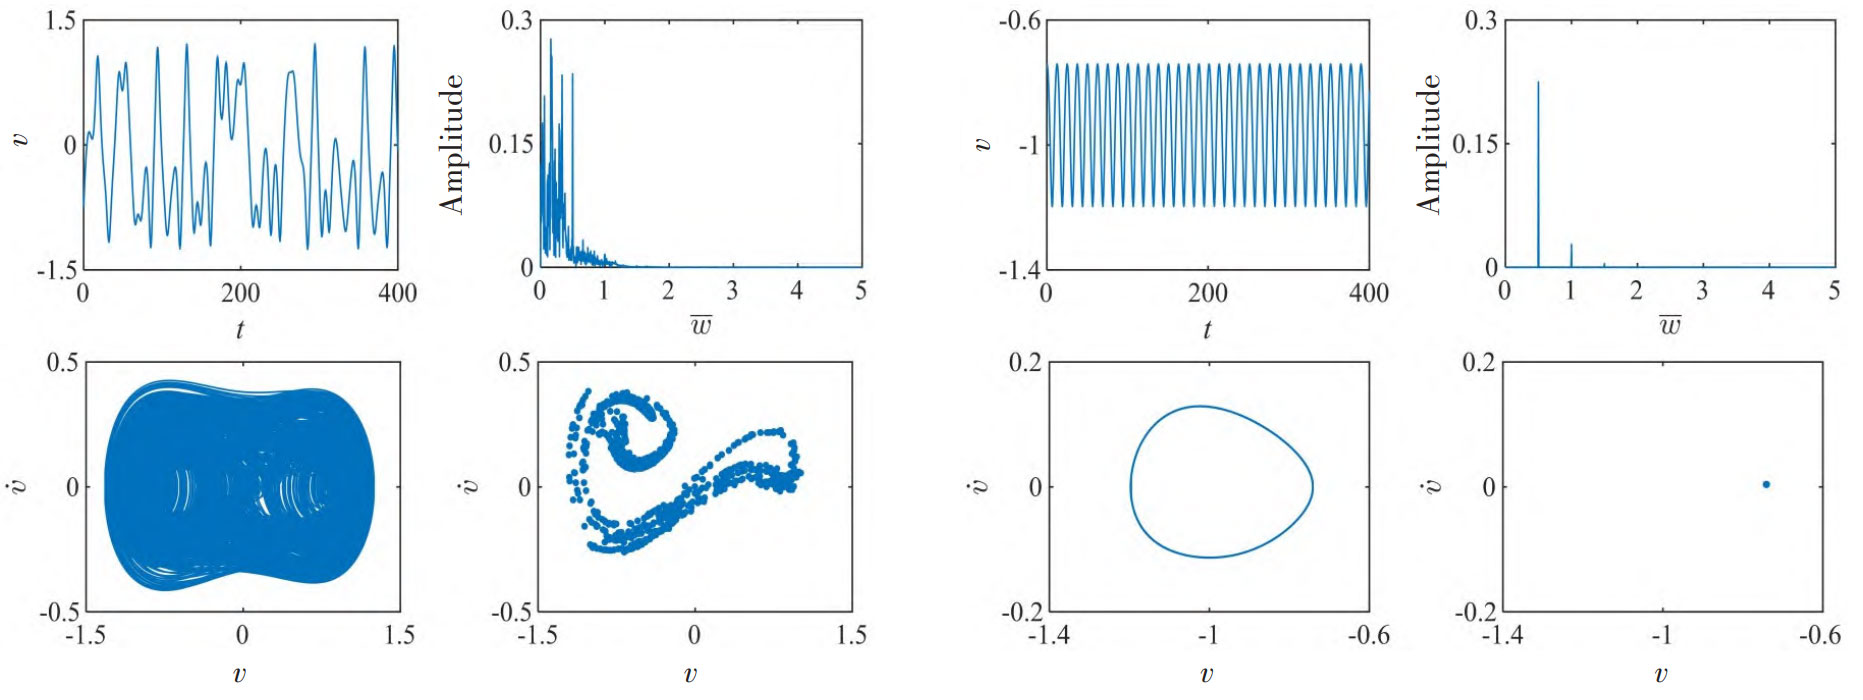
Figure 4-5 shows the system under different load ratios on helical gears λ The dynamic characteristics of the dimensionless vibration displacement v at time. When λ When it is 0.1, the parameter v oscillates within the range (-1.5, 1.5), indicating that there are three motion states of the q and g tooth pairs during the motion process: forward tooth engagement, disengagement, and back tooth engagement. The front and back impacts of the gear teeth alternate. The FFT plot presents a discrete spectrum with a certain width. At the same time, its phase space trajectories and Poincar é cross sections indicate that the system is in a chaotic state. When λ When it is 0.8, the system enters a stable single cycle motion state, and the q and g tooth pairs switch between the meshing and disengagement states. The FFT graph contains a clear peak frequency of 0.5 (fundamental frequency) and a small amplitude vibration frequency of 1.0 (second harmonic).