
In the field of mechanical engineering, the strength calculation of cylindrical gears has become increasingly refined, but for miter gears, the methods remain underdeveloped. The complex geometry of miter gears, which are a type of bevel gear with a shaft angle of 90 degrees, poses significant challenges. Traditional approaches, such as simplifying the three-dimensional problem into a two-dimensional one by assuming linear load distribution along the tooth width, are often inaccurate. To address this, I conducted a detailed investigation into the load distribution on the tooth surface and the root stress distribution of miter gears using three-dimensional finite element analysis and three-dimensional photoelastic experiments. This study aims to provide a more precise understanding of miter gear bending strength, leveraging advanced computational and experimental techniques.
The core of my methodology involves deriving a flexibility matrix equation to solve for the load distribution along the contact line of miter gears. In ideal meshing conditions, the tooth surface experiences normal forces distributed along the contact line. Let the contact line length be \( L \), and the normal load density function be \( p(s) \), where \( s \) is the position along the contact line. The deformation \( \delta(s) \) at point \( s \) due to the load distribution can be expressed as:
$$ \delta(s) = \int_{0}^{L} k(s, \xi) p(\xi) d\xi $$
where \( k(s, \xi) \) is the flexibility coefficient representing the deformation at point \( s \) due to a unit normal force at point \( \xi \). For two mating gears, denoted as Gear I and Gear II, the combined deformation must satisfy compatibility conditions. Under ideal contact, the normal comprehensive deformation along the contact line equals the rigid body displacement due to rotation. This leads to the deformation compatibility equation:
$$ \delta_I(s) + \delta_{II}(s) = \theta \cdot r(s) $$
where \( \delta_I(s) \) and \( \delta_{II}(s) \) are the deformations of Gear I and Gear II at point \( s \), respectively, \( \theta \) is the rigid rotation angle, and \( r(s) \) is the radius of rigid rotation at point \( s \). For discretization, the contact line is divided into \( n \) points, and the distributed load is approximated by concentrated forces \( P_1, P_2, \ldots, P_n \) at these points. The flexibility matrix equation becomes:
$$ [K] \{P\} = \{\Delta\} = \theta \{r\} $$
Here, \( [K] \) is the flexibility matrix of size \( n \times n \), with elements \( K_{ij} \) representing the deformation at point \( i \) due to a unit force at point \( j \). \( \{P\} \) is the load vector, and \( \{r\} \) is the radius vector. Given the total normal load \( F_n \), we have:
$$ \sum_{j=1}^{n} P_j = F_n $$
Combining these equations, we solve for the load distribution. If initial gaps exist, the equation modifies to account for additional deformations required to close these gaps. This flexibility matrix method allows for precise determination of load distribution under various meshing conditions.
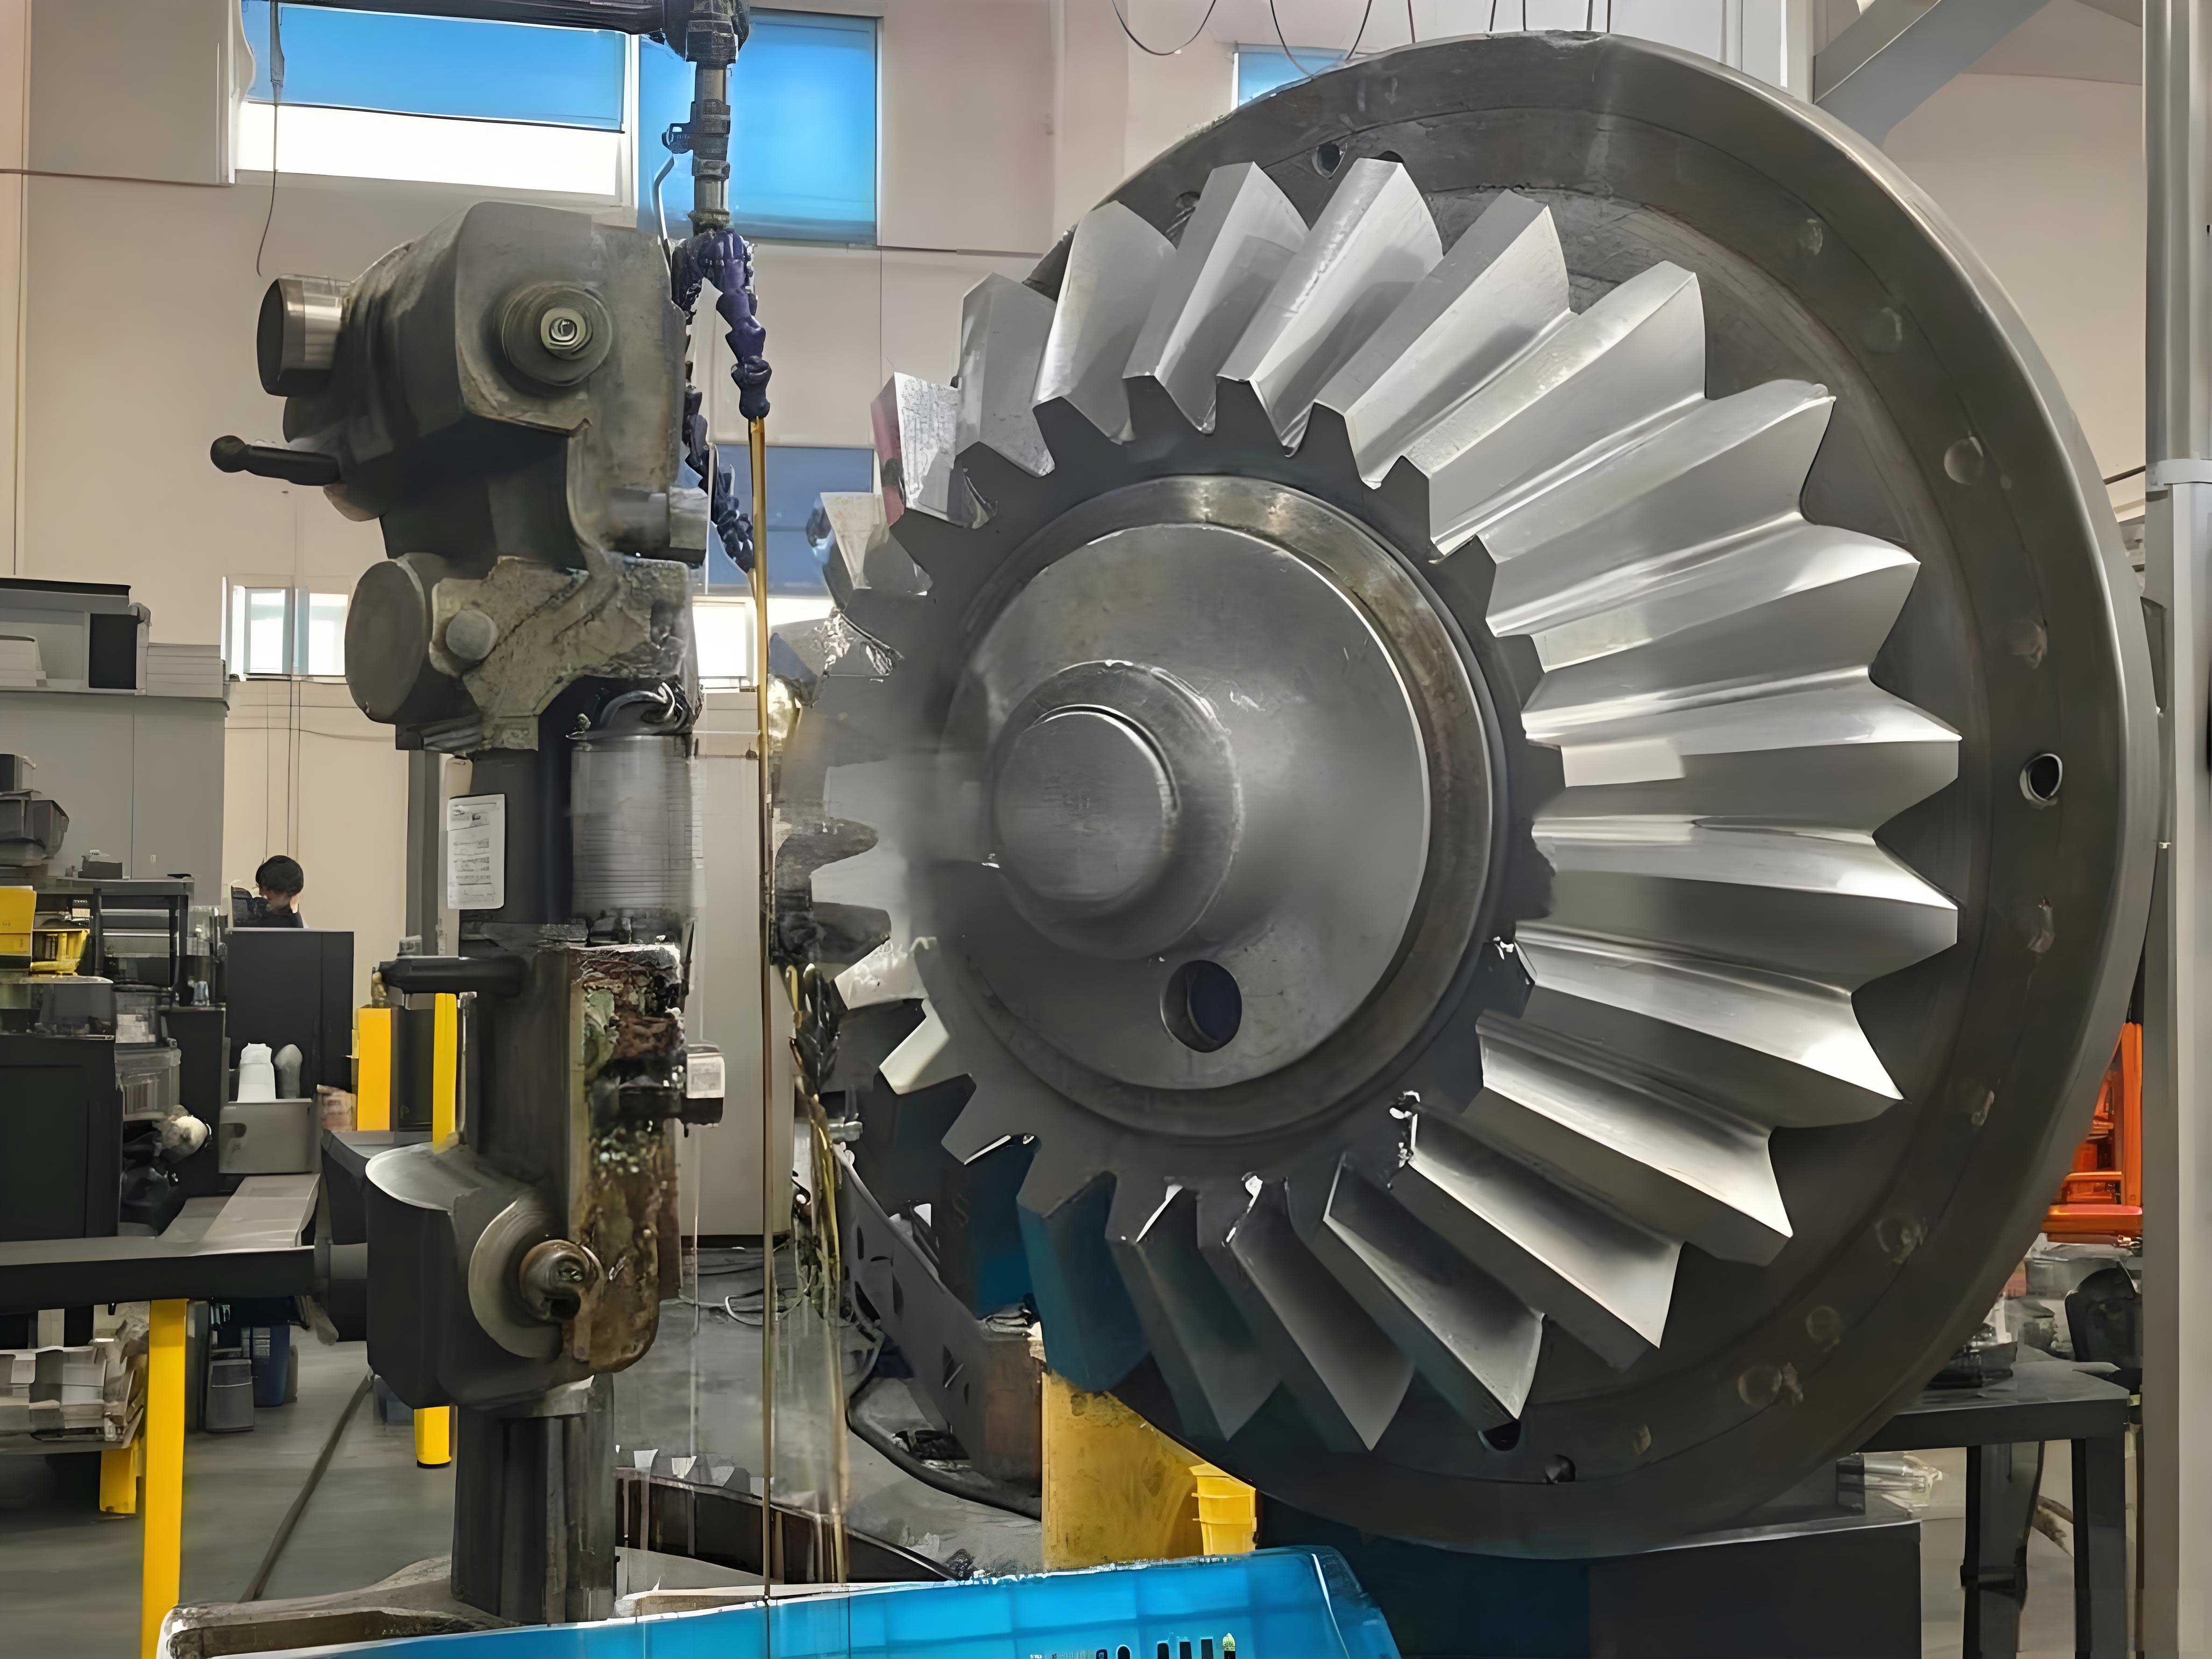
For the finite element analysis, I established a mechanical model of a standard miter gear with a gear ratio of 1. The primary parameters of the model miter gear are summarized in the table below:
| Parameter | Value |
|---|---|
| Number of Teeth (z) | 16 |
| Module (m) | 5 mm |
| Pressure Angle (α) | 20° |
| Shaft Angle | 90° |
| Face Width (b) | 25 mm |
| Pitch Diameter | 80 mm |
| Equivalent Pitch Radius at Midpoint | 40 mm |
The boundary conditions were simplified based on Saint-Venant’s principle. The model was discretized using 20-node hexahedral elements, with a finer mesh near the tooth root transition curve to capture high stress gradients. The finite element mesh consisted of 150 elements and 320 nodes, divided longitudinally into 5 layers with 6 equally spaced cross-sections. This allowed for discretizing the contact line into 6 points to analyze load distribution and evaluating root stress at 5 layers. The analysis was performed using a custom FEM program, with each computation taking approximately 15 minutes.
I selected three different meshing positions for analysis: the tooth tip, the highest point of single-tooth contact, and the tooth root. The contact lines for these positions are illustrated conceptually. For each position, unit normal forces were applied at the discrete points on the contact line to compute deformations and form the flexibility matrix. Assuming a total normal load \( F_n = 1000 \, \text{N} \), the concentrated load values at each point were solved using the flexibility matrix equation. The results are presented in the following table:
| Contact Line Position | Point 1 (Large End) | Point 2 | Point 3 | Point 4 | Point 5 | Point 6 (Small End) |
|---|---|---|---|---|---|---|
| Tooth Tip | 220 N | 190 N | 170 N | 150 N | 130 N | 110 N |
| Single-Tooth Contact Highest Point | 210 N | 185 N | 165 N | 145 N | 125 N | 105 N |
| Tooth Root | 200 N | 180 N | 160 N | 140 N | 120 N | 100 N |
These concentrated loads were converted to distributed loads and plotted. The load distribution curves show a non-linear trend, decreasing from the large end to the small end, with some fluctuations resembling a saddle shape. This indicates that the assumption of linear load distribution in traditional methods is not accurate for miter gears.
Using the actual load distribution obtained from the flexibility matrix method, I computed the root stress distribution for each meshing position via finite element analysis. The maximum root stress values at each layer (from large end to small end) are listed in the table below:
| Meshing Position | Layer 1 (Large End) | Layer 2 | Layer 3 | Layer 4 | Layer 5 (Small End) |
|---|---|---|---|---|---|
| Tooth Tip | 85 MPa | 78 MPa | 70 MPa | 65 MPa | 60 MPa |
| Single-Tooth Contact Highest Point | 95 MPa | 88 MPa | 80 MPa | 75 MPa | 70 MPa |
| Tooth Root | 80 MPa | 75 MPa | 68 MPa | 62 MPa | 58 MPa |
The stress distribution curves reveal a drum-shaped pattern, with stresses generally decreasing from the large end to the small end, and peaks occurring near the large end (around Layer 1 to Layer 2). This pattern holds across all meshing positions, emphasizing the three-dimensional nature of stress in miter gears.
To validate the finite element results, I conducted a three-dimensional photoelastic experiment on a scaled-up model of the miter gear. The experimental model was made of epoxy resin and machined to match the geometry. A loading device was designed to simulate actual meshing conditions, allowing adjustment of the contact position. The experiment focused on the single-tooth contact highest point, as it represents the most critical state for bending strength. After fine-tuning, near-ideal contact was achieved along the entire contact line.
The model was subjected to a frozen stress technique with a load weight of 500 N. Slices were cut from the frozen model and analyzed using a polariscope with a rotating analyzer method. Stress components were calculated from the fringe patterns using the following equations based on a flow coordinate system:
$$ \sigma_x = \frac{f}{d} \left( N_0 \cos^2 \phi + N_{+\phi} \sin^2 \phi \right) $$
$$ \sigma_y = \frac{f}{d} \left( N_0 \sin^2 \phi + N_{-\phi} \cos^2 \phi \right) $$
$$ \tau_{xy} = \frac{f}{2d} \left( N_{+\phi} – N_{-\phi} \right) \sin \phi \cos \phi $$
where \( f \) is the material fringe value, \( d \) is the slice thickness, \( N_0 \) is the fringe order under normal incidence, and \( N_{+\phi} \), \( N_{-\phi} \) are fringe orders under oblique incidences at angles \( +\phi \) and \( -\phi \), respectively. For this experiment, \( \phi = 45^\circ \). The measured fringe values were \( f = 12.5 \, \text{N/mm} \cdot \text{fringe} \) for the model, leading to stress calculations at critical points on the tensile and compressive sides of the tooth root.
The photoelastic results for root stress distribution were compared with the finite element results at the single-tooth contact highest point. The comparison is summarized in the table below:
| Layer | Finite Element Stress (MPa) – Tensile Side | Photoelastic Stress (MPa) – Tensile Side | Finite Element Stress (MPa) – Compressive Side | Photoelastic Stress (MPa) – Compressive Side |
|---|---|---|---|---|
| 1 (Large End) | 95 | 92 | -70 | -68 |
| 2 | 88 | 86 | -65 | -63 |
| 3 | 80 | 78 | -60 | -58 |
| 4 | 75 | 73 | -55 | -53 |
| 5 (Small End) | 70 | 67 | -50 | -48 |
The stress distribution curves from both methods align closely, especially from Layer 2 to Layer 4. Slight discrepancies at the ends (Layers 1 and 5) are attributed to imperfect contact in the photoelastic model. The maximum tensile stress from photoelasticity is 92 MPa, while finite element analysis gives 95 MPa, resulting in a relative error of about 3.3%. In contrast, applying the traditional bending stress formula for miter gears, such as the Lewis equation adapted for bevel gears, yields a stress of approximately 110 MPa, which is about 19% higher than the photoelastic result and 16% higher than the finite element result. This confirms that traditional methods tend to overestimate bending stress in miter gears.
The study of miter gears through flexibility matrix-based load distribution analysis, combined with three-dimensional finite element and photoelastic techniques, provides deep insights into their mechanical behavior. The non-linear load distribution along the contact line, characterized by a saddle-shaped curve, challenges the linear assumption used in conventional approaches. Furthermore, the drum-shaped root stress distribution, with peaks near the large end, highlights the importance of three-dimensional analysis. The close agreement between finite element and photoelastic results validates the accuracy of the proposed methodology. These findings underscore the need for advanced computational tools in the design and analysis of miter gears to ensure reliability and efficiency in power transmission systems. Future work could explore dynamic loading conditions, misalignment effects, and optimization of tooth geometry for enhanced performance of miter gears.