
As a professional engaged in the inspection and testing of special equipment, I have always been keen on exploring innovative methods that can enhance efficiency and accuracy in our field. The balance coefficient of an elevator is a critical performance indicator for traction-driven elevators, directly impacting safety and energy consumption. Traditionally, the balance coefficient is measured using the current-load curve method, which, while reliable, is time-consuming and labor-intensive. In this article, I will delve into a novel approach—the no-load power method—and examine its applicability, particularly for elevators with worm gear drive systems. This method has gained attention for its potential to streamline inspection processes, and through theoretical analysis and practical case studies, I aim to demonstrate its effectiveness for worm gear drive elevators.
The balance coefficient, denoted as q, is defined as the ratio of the counterweight mass to the sum of the empty car mass and the rated load. According to standards such as TSG T7001—2009, the balance coefficient for traction elevators should typically fall between 0.40 and 0.50. An incorrect balance coefficient can lead to serious safety incidents: if q is too low, the car may bottom out during满载下行; if q is too high, it may overtop during空载上行. The traditional method involves loading the car with different percentages of the rated load (e.g., 30%, 40%, 45%, 50%, 60%) and measuring the motor current during both up and down runs to plot curves and find the intersection point. This process requires multiple runs with heavy weights, increasing inspection time and costs. In contrast, the no-load power method promises to determine the balance coefficient with just one空载上行 and one空载下行 run, making it a game-changer for the industry.
The theoretical foundation of the no-load power method stems from basic physics principles. Power is defined as the rate of doing work, equal to the product of force and velocity. For an elevator system, the motor power during no-load operation can be derived from force analysis. Let W be the counterweight mass, P be the mass of the empty car and associated components (such as part of the traveling cable or compensation ropes), Q be the rated load, v be the car velocity, g_n be the gravitational acceleration (taken as 9.81 m/s²), and η be the transmission efficiency. The balance coefficient q is given by q = (W – P) / Q. During no-load operation, the counterweight side is always heavier than the car side, so when the elevator moves down空载, the motor operates in motoring mode, and when it moves up空载, the motor operates in regenerative braking mode. The motor power at the same horizontal position for both directions can be expressed as follows:
For no-load下行: $$ N_x = \frac{q Q g_n v_x}{\eta_x} + q Q g_n v_x (1 – \eta_x) $$
For no-load上行: $$ N_s = q Q g_n v_s – q Q g_n v_s (1 – \eta_s) $$
Here, v_x and v_s are the car velocities during no-load下行 and no-load上行, respectively, while η_x and η_s are the corresponding transmission efficiencies. By adding these two equations, we obtain:
$$ \frac{N_x}{v_x} + \frac{N_s}{v_s} = 2 q Q g_n + q Q g_n (\eta_s – \eta_x) $$
Solving for q yields:
$$ q = \frac{N_x v_s + N_s v_x}{(2 + \eta_s – \eta_x) Q g_n v_s v_x} $$
If the transmission efficiency is the same in both directions (i.e., η_x = η_s), the equation simplifies to:
$$ q = \frac{N_x v_s + N_s v_x}{2 Q g_n v_s v_x} $$
This simplified formula is the core of the no-load power method. Its applicability hinges on the assumption that η_x = η_s, meaning the transmission efficiency remains unchanged regardless of the direction of travel during no-load operation. This assumption holds true for certain types of drive systems, which I will explore next.
First, let’s consider permanent magnet synchronous gearless drives. These systems consist of a permanent magnet synchronous motor directly coupled to the traction sheave, without any intermediate transmission components. The transmission efficiency is high, typically around 95%, and since there are no gears or other mechanisms that introduce directional dependencies, the efficiency is identical for both forward and reverse rotation. Thus, for gearless drives, η_x = η_s, making the no-load power method fully applicable.
Now, turning to worm gear drive systems, which are widely used in older elevators due to their advantages such as high reduction ratios, smooth operation, compact structure, and self-locking capability. However, worm gear drives have lower transmission efficiency, typically around 70%, compared to gearless systems. The efficiency of a worm gear drive can be broken down into three components: the meshing efficiency (η₁), bearing efficiency (η₂), and oil churning efficiency (η₃). The overall efficiency is given by:
$$ \eta = \eta_1 \eta_2 \eta_3 $$
For no-load operation in a worm gear drive elevator, the counterweight side is always heavier, so the torque on the traction sheave remains constant in magnitude and direction (excluding acceleration and deceleration phases). Due to the self-locking nature of worm gears, the worm always drives the worm wheel, regardless of whether the elevator is moving up or down空载. This means that the force direction on the worm and worm wheel teeth remains unchanged, and the same tooth surfaces are engaged in both directions. Consequently, the coefficient of friction between the tooth surfaces, which affects the meshing efficiency, is identical for both travel directions. Therefore, η₁ is the same for no-load上行 and no-load下行, and since η₂ and η₃ are also direction-independent, we have η_x = η_s. This theoretical analysis suggests that the no-load power method is applicable to worm gear drive elevators as well.
To validate this theory, I conducted a case study involving four worm gear drive elevators installed in a residential complex. All elevators were of the same model and specifications, installed in the same batch. The key parameters are summarized in the table below:
| Parameter | Value |
|---|---|
| Manufacturing Date | July 2002 |
| Equipment Type | Traction Passenger Elevator |
| Drive System | Worm Gear Drive |
| Rated Load (Q) | 1000 kg |
| Rated Speed | 1.75 m/s |
| Floors/Stations | 22/22 |
I first used the traditional current-load curve method to measure the balance coefficient for each elevator. The procedure involved loading the car with 30%, 40%, 45%, 50%, and 60% of the rated load and recording the motor current during full-travel up and down runs. The balance coefficient was determined from the intersection point of the current curves. The results are presented in Table 2.
| Elevator ID | Balance Coefficient q (%) | Load Rate (%) | Actual Load (kg) | Upward Current (A) | Downward Current (A) |
|---|---|---|---|---|---|
| A | 44.2 | 30 | 300 | 13.2 | 15.8 |
| 40 | 400 | 13.4 | 14.2 | ||
| 45 | 450 | 13.7 | 13.6 | ||
| 50 | 500 | 14.5 | 13.4 | ||
| 60 | 600 | 16.2 | 13.1 | ||
| B | 43.6 | 30 | 300 | 9.4 | 13.9 |
| 40 | 400 | 10.4 | 11.6 | ||
| 45 | 450 | 11.4 | 10.7 | ||
| 50 | 500 | 12.3 | 10.2 | ||
| 60 | 600 | 14.3 | 9.5 | ||
| C | 43.1 | 30 | 300 | 13.0 | 15.7 |
| 40 | 400 | 13.5 | 14.3 | ||
| 45 | 450 | 14.2 | 13.5 | ||
| 50 | 500 | 15.1 | 13.3 | ||
| 60 | 600 | 16.6 | 13.1 | ||
| D | 42.9 | 30 | 300 | 9.5 | 14.5 |
| 40 | 400 | 10.7 | 11.9 | ||
| 45 | 450 | 12.1 | 10.5 | ||
| 50 | 500 | 13.1 | 10.1 | ||
| 60 | 600 | 15.3 | 9.4 |
Next, I applied the no-load power method using a dedicated elevator balance coefficient tester. The test required only one no-load上行 and one no-load下行 run for each elevator, during which the motor power and car velocity were measured at the same horizontal position. The balance coefficient was calculated using the simplified formula. The results are shown in Table 3.
| Elevator ID | Balance Coefficient q (%) | Rated Load Q (kg) | Upward Velocity v_s (m/s) | Downward Velocity v_x (m/s) | Operator Mass (kg) |
|---|---|---|---|---|---|
| A | 45.0 | 1000 | 1.64 | 1.63 | 60 |
| B | 44.5 | 1000 | 1.47 | 1.55 | 60 |
| C | 43.8 | 1000 | 1.61 | 1.60 | 60 |
| D | 43.1 | 1000 | 1.64 | 1.61 | 60 |
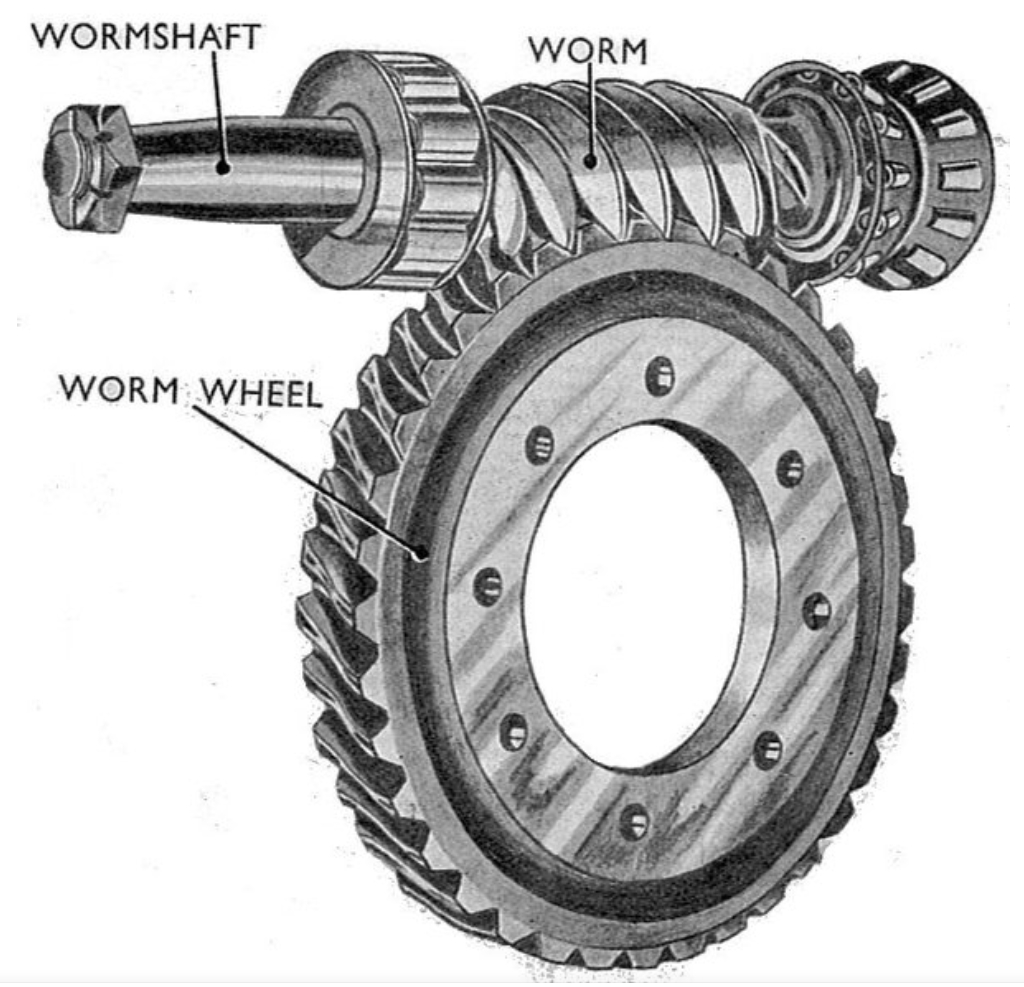
To assess the impact of wear on the worm gear drive system, I inspected the tooth surfaces of the worm wheels for each elevator. Wear levels were categorized into three grades: Grade I (lightest wear), Grade II (moderate wear), and Grade III (severe wear). The wear conditions are visually documented in the image linked earlier, which shows the worm gear components. A comparison of the results from both methods, along with wear grades, is summarized in Table 4.
| Elevator ID | Balance Coefficient by Current Method (%) | Balance Coefficient by Power Method (%) | Worm Gear Tooth Wear Grade | Relative Deviation Between Methods (%) |
|---|---|---|---|---|
| A | 44.2 | 45.0 | I | 1.8 |
| B | 43.6 | 44.5 | I | 2.1 |
| C | 43.1 | 43.8 | III | 1.6 |
| D | 42.9 | 43.1 | II | 0.5 |
The data reveals that the relative deviations between the two methods are small (all below 2.5%), regardless of the wear grade. This consistency supports the theoretical premise that transmission efficiency remains directionally symmetric in worm gear drive systems during no-load operation. Even with significant wear (Grade III for Elevator C), the no-load power method yielded a result close to that of the traditional method, indicating its robustness. Thus, the no-load power method is indeed applicable to worm gear drive elevators, validating the assumption that η_x = η_s for such systems.
The implications of this finding are particularly significant for the inspection of older elevators. In many regions, elevators exceeding 15 years of service are classified as aged and often continue to operate without mandatory retirement. These older elevators, many of which employ worm gear drive systems, are prone to safety hazards such as worn suspension ropes, degraded traction sheave grooves, insufficient brake torque, and imbalanced coefficients. Since replacement parts may be scarce, maintenance can be challenging, leading to “operating with defects” scenarios. Therefore, efficient and accurate inspection methods are crucial. The no-load power method offers substantial advantages in this context. Compared to the current-load curve method, which typically takes about an hour per elevator due to repeated loading and unloading of weights, the no-load power method reduces the time to approximately 10 minutes per elevator. Moreover, it requires fewer personnel—often just one inspector—thereby cutting labor costs and minimizing disruption to building operations.
Furthermore, some modern elevator manufacturers have integrated power method modules into control cabinets for new installations, enabling real-time monitoring of the balance coefficient. However, for existing worm gear drive elevators, on-site testing remains necessary. The no-load power method provides a viable solution that aligns with the push for technological innovation in special equipment inspection, as advocated by regulatory bodies like the State Administration for Market Regulation. By adopting such methods, inspectors can enhance productivity while ensuring safety standards are met.
In conclusion, the no-load power method is a promising technique for measuring elevator balance coefficients, and its applicability extends to worm gear drive systems. Through theoretical derivation and empirical validation, I have demonstrated that the transmission efficiency in worm gear drive elevators is symmetric during no-load上行 and no-load下行, satisfying the key condition for the method. The case study involving four worm gear drive elevators showed minimal deviations from traditional measurements, confirming the method’s reliability. For the inspection of older elevators, which predominantly use worm gear drives, this method offers a faster, more efficient, and cost-effective alternative. As the industry evolves, embracing innovative approaches like the no-load power method will be essential for advancing the safety and sustainability of elevator operations. I encourage fellow professionals to explore and adopt such methods to contribute to the progress of our field.