
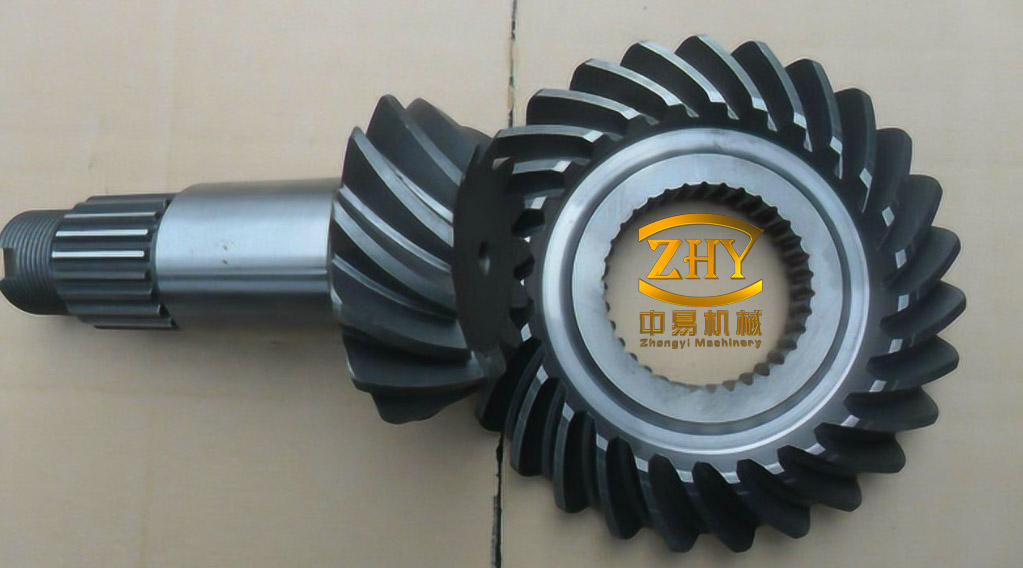
Spiral bevel gears carry power between intersecting shafts, usually at 90°, and they do so in automotive axles, helicopter and turboprop transmissions, machine-tool spindles and rail traction gearboxes. Their teeth are cut on a curved pitch cone, so contact starts near one end of the tooth and sweeps diagonally across the flank, which spreads load and smooths engagement relative to straight bevels. The same geometry, combined with alternating single- and double-tooth contact, a time-varying mesh stiffness and the inevitable backlash needed for lubrication and assembly, makes the drive strongly nonlinear. Under light load the teeth can separate completely, re-engage with impact, and under reversed or oscillating load can strike the non-driving flank. These events are not cosmetic: they raise dynamic load, radiate noise and can nucleate pitting and tooth-root fatigue.
Lumped-parameter models with backlash and time-varying mesh stiffness have been the standard tool for predicting this behaviour since the early 2000s, when a spiral bevel model with clearance and periodic stiffness was used to locate bifurcations and amplitude jumps. Later refinements added mixed-elastohydrodynamic lubrication and surface roughness to the contact description, finite-element bearing–gear rotor models to capture the influence of support stiffness on dynamic mesh force, and lubricated contact-path analyses. A consistent picture has emerged: the loss-of-contact and back-side impact regimes are separated from the well-behaved regime by grazing and crisis bifurcations that depend jointly on speed and load, and single-parameter studies miss most of that structure.
A seven-degree-of-freedom mesh model
The dynamics are represented by two rigid gear bodies whose support flexibility is lumped at the mid-face centres, with the two axes intersecting at the origin at 90°. Each body retains three translational coordinates plus rotation about its own axis, and the two torsional coordinates are condensed into one relative coordinate by combining the two twist equations through the mesh. The eight coordinates {X₁, Y₁, Z₁, θ₁, X₂, Y₂, Z₂, θ₂} therefore reduce to seven independent degrees of freedom, three translations per gear plus the mesh-line coordinate.
The relative displacement along the line of action, including the static transmission error en(t), is
$$\Lambda_n=(X_1-X_2)a_1-(Y_1-Y_2)a_2-(Z_1-Z_2+r_1\theta_1-r_2\theta_2)a_3-e_n(t)$$
with a₁ = cos δ₁ sin αn, a₂ = cos δ₁ cos αn sin βm and a₃ = cos αn cos βm, where δ₁ is the pinion pitch-cone angle, αn the normal pressure angle, βm the mid-face spiral angle, and r₁, r₂ the pitch radii. The mesh force combines a periodic stiffness kh(t), a viscous mesh damper ch and a clearance function:
$$F_n=k_h(t)\,f(\Lambda_n)+c_h\dot\Lambda_n,\qquad
f(\Lambda_n)=\begin{cases}\Lambda_n-b_n & \Lambda_n>b_n\\ 0 & |\Lambda_n|\le b_n\\ \Lambda_n+b_n & \Lambda_n<-b_n\end{cases}$$
The stiffness is expanded in a Fourier series, kh(t) = km + Σ Akl cos(lΩht + Φkl), and the mesh force is projected onto the three coordinate directions through the direction cosines a₄, a₅, a₆ obtained from the same geometry. Merging the two rotational equations gives a single mesh-line equation governed by the equivalent mass me = J₁J₂/(r₁²J₂ + r₂²J₁), driven by the mean torque Tpm, the torque fluctuation Tpv and the inertial excitation meën(t). After non-dimensionalisation with the half-backlash bh and the natural frequency Ωn = (km/me)1/2, the two design-relevant parameters are the frequency ratio Ω = Ωh/Ωn, which scales with shaft speed, and the normalised mean load fpm = Fpm/(mebhΩn²).
Mapping the speed–load plane
Because speed and load are the two variables an engineer actually sets, the useful object is a two-parameter map rather than a single bifurcation diagram. Cell-mapping theory provides the framework: the region Ω ∈ [1.5, 2.1] × fpm ∈ [0.1, 0.6] is divided into 401 × 401 cells, each cell is coloured by its attractor type, and the boundaries between colour regions trace the bifurcation and impact-transition curves. Solutions are continued across the grid with a pseudo-fixed-point continuation scheme, a continué-Poincaré–Newton–Floquet (CPNF) algorithm that tracks periodic orbits and their Floquet multipliers from cell to cell, so that each reported boundary is a computed solution rather than an interpolation between sampled simulations.
Each cell is labelled I/P. The impact index I distinguishes no impact (I = 0), single-sided impact after loss of contact (I = 1) and double-sided impact with back-flank contact (I = 2); P is the period of the orbit, with periods above 30, quasi-periodic and chaotic responses all collapsed into a single “period n” class so that the low-order structure remains legible. Two complementary metrics quantify severity: the no-meshing duty cycle and the back-meshing duty cycle,
$$\mathrm{NMDC}=\frac{t_1}{T},\qquad \mathrm{BMDC}=\frac{t_2}{T}$$
where t₁ and t₂ are the separation time and back-contact time within one mesh period T, together with the dynamic load coefficient
$$\mathrm{DLC}=\max\left[k_h f(\lambda)+2\xi_h\dot\lambda\right]$$
evaluated on the steady-state orbit. The simulation parameters used for the maps are listed in Table 1; stiffness modulation is harmonic, kh = 1 + α cos(Ωτ), with α = 0.2.
| Parameter | Symbol | Value |
|---|---|---|
| Tooth numbers (pinion/gear) | Z₁/Z₂ | 47/53 |
| Module | m | 3 mm |
| Mid-face spiral angle | βm | 35° |
| Mesh damping ratio | ξh | 0.05 |
| Half-backlash | b | 1.0 |
| Stiffness modulation amplitude | α | 0.2 |
| Internal excitation coefficient | fe | 0.2 |
| Load fluctuation coefficient | fav | 0.0 |
| Support damping (gear 1/gear 2) | ξi1/ξi2 | 0.01 |
| Support stiffness (gear 1/gear 2) | ki1/ki2 | 1.25 |
| Mesh stiffness (gear 1/gear 2) | kh1/kh2 | 0.5 |
| Mesh damping (gear 1/gear 2) | ξh1/ξh2 | 0.0125 |
Bifurcation, impact and load in the parameter plane
The resulting maps show all three impact states coexisting in the same plane, with single-sided impact after separation dominating by area. Periodic windows of order 1, 3, 5, 7, 9, 10, 14, 21 and 24 interleave with multi-period, quasi-periodic and chaotic bands. Walking across the plane along fixed-load sections reveals ordered sequences of transitions: at fpm = 0.5 the state runs 1/1 → 2/3 → 1/3 → 1/n → 2/n → 1/n → 1/3 → 0/1 → 2/n → 1/n → 1/24 → 1/n → 0/1; at fpm = 0.4 it runs 1/3 → 2/9 → 2/10 → 2/n → 1/n → 1/1 → 2/9 → 2/n → 1/7 → 1/n → 0/1; and at the light load fpm = 0.11 it runs 2/3 → 2/n → 1/n → 1/n → 1/14 → 1/n → 1/7 → 1/n → 1/1. The mechanisms behind these sequences are period-3 grazing, Hopf bifurcation from a periodic orbit to a torus, period-7 grazing, period doubling, saddle-node bifurcation and crisis, the last two being the abrupt, hysteretic jumps between widely separated attractors.
The severity metrics are not distributed uniformly. Light load and chaotic bands combine into the worst separation behaviour: for fpm below about 0.3, the NMDC peaks near 0.67, meaning the teeth spend roughly two-thirds of each mesh cycle out of contact. Back-flank contact is concentrated even lower, with BMDC reaching about 0.35 for fpm < 0.15, so the double-sided impact corner of the map sits in the light-load region. As load rises, separation and single-sided impact shrink and the no-impact area (0/1) grows, which is the intuitive result that preload suppresses rattle. Dynamic load behaves oppositely: the DLC maximum of about 1.55 appears in the heavily loaded multi-period bands. Overall, the periodic structure of the map is governed mainly by Ω and by the impact state itself, whereas separation, back contact and dynamic load respond to both the period-doubling structure and the mean load.
Verification by direct integration
To check that the cell-map boundaries are real and not artefacts of continuation, the fpm = 0.5 section was recomputed by direct Runge–Kutta integration, sweeping Ω and recording the impact/period state, NMDC, BMDC and DLC. The state sequence along that section, 1/1 → 2/3 → 1/3 → 1/n → 2/n → 1/1 → 2/n → 1/n → 1/7 → 1/n → 1/24 → 1/n → 0/1, reproduces the transition order read from the map. The grazing points are visible as simultaneous jumps in all three severity metrics, which identifies clearance-induced grazing and crisis bifurcations as the direct cause of dynamic-load spikes: the orbit touches the backlash boundary, escapes to a distant attractor, and the load coefficient steps discontinuously. Within a single impact class, quasi-periodic and chaotic bands consistently show higher separation and dynamic load than the periodic windows they border.
Representative attractors confirm the classification. At Ω = 1.50 the response is single-sided-impact period 1; at Ω = 1.535 and 1.55 it is period 2 with double-sided and single-sided impact respectively; at Ω = 1.57 it is quasi-periodic, with three Hopf loops visible in the phase portrait; and at Ω = 1.62 and 1.65 the Poincaré section shows bounded, self-similar point sets characteristic of chaos, with single-sided and double-sided impact respectively.
Feedback control through a radial basis function network
Once a drive sits in a chaotic or quasi-periodic band, the practical remedy is a small, fast adjustment of an accessible parameter rather than a redesign. Shaft speed is the natural candidate because it is directly commanded, so the frequency ratio Ω is treated as the control input and the controller output is a bounded perturbation |u| ≤ umax added to it. Control laws built on the OGY paradigm are a poor fit here: in a high-dimensional gear model the Jacobian spectrum readily contains complex conjugate eigenvalue pairs, the saddle instability manifold changes dimension, and the control loses authority. A model-free alternative is used instead, in which a radial basis function neural network learns the map from measured orbit error to parameter correction.
The network is fed two scalars computed on the Poincaré section of period T = 2π/Ω: the distance between successive map points, D(k) = ‖X(k) − X(k−1)‖, and its previous value D(k−1). These two inputs drive five hidden nodes with Gaussian activation and a single output, the frequency correction — a 2-5-1 structure chosen as the most compact arrangement that meets the control specification:
$$\varphi_i\left(\left\|D-C_i\right\|\right)=\exp\left(-\frac{\left\|D-C_i\right\|^2}{2\sigma_i^2}\right)$$
The control target is expressed as a reference distance D* equal to the numerical resolution, 1 × 10⁻⁷, so that the error e(k) = D* − D(k) → 0 corresponds to a fixed point of the Poincaré map, that is, to a periodic orbit of the gear system. Hidden-node centres Ci, widths σi and output weights w are tuned by an adaptive hybrid gravitational search algorithm (AHGSA), a variant of the gravitational search algorithm augmented with chaotic population initialisation, a mutation operator borrowed from artificial bee colony search and an adaptively adjusted gravitational constant. The fitness function penalises both residual orbit error and control effort:
$$f(P_i)=\gamma_1\sum_{k=1}^{L}\left|D^*-D(k)\right|\ln\!\left(\frac{1}{\eta}\right)+\gamma_2\sum_{k=1}^{L}\left|\hat u(k)-u(k)\right|$$
where ū(k) and u(k) are the expected and applied inputs at step k, η is a uniformly distributed random number in (0, 1) that prevents premature convergence, γ₁ and γ₂ weight the two objectives, and L is the length of the input/output record. Optimisation runs with a population of 30, at most 200 iterations, initial gravitational constant G₀ = 130, α = 18 and P = 0.96; because the procedure only needs input–output data, it is indifferent to the size of the underlying dynamic model.
Control performance
Three regimes were tested with the controller engaged after step 50, together with a multi-period case engaged at step 100. In every case the perturbation settles to a small constant offset in Ω and the Poincaré distance collapses to the 10−7 resolution, which is the signature of a locked periodic orbit rather than a suppressed transient. Table 2 summarises the outcomes and Table 3 lists the optimised network parameters for the period-1 and period-3 targets.
| Initial Ω | Initial state | Target orbit | Steady ΔΩ | Steps to lock |
|---|---|---|---|---|
| 1.54 | Period 2/3, single-sided impact | Period 1 (1/1) | −0.022 | 21 (71 total) |
| 1.57 | Quasi-periodic (1/n) | Period 3 (1/3), single-sided impact | −0.015 | 11 (61 total) |
| 1.65 | Chaotic (1/n), double-sided impact | Period 1 (1/1) | +0.029 | 6 |
| 1.91 / 1.96 | Chaotic | Period 7 | — | ≈120 from step 100 |
| Centre C (P1) | Width σ (P1) | Weight w (P1) | Centre C (P3) | Width σ (P3) | Weight w (P3) |
|---|---|---|---|---|---|
| (3.535 2, 2.226 4) | 0.317 3 | 0.496 2 | (−0.013 0, −1.297 5) | 2.891 9 | 0.473 8 |
| (0.029 6, 6.340 1) | 0.818 7 | −0.935 7 | (0.782 6, −2.490 2) | 6.081 9 | −0.349 2 |
| (−6.187 2, −2.585 1) | 0.521 5 | 0.182 6 | (−5.455 7, −1.473 0) | 6.999 4 | −0.126 6 |
| (2.714 9, 1.033 5) | 0.340 3 | −0.430 5 | (−0.107 4, −0.388 5) | 9.444 5 | 0.305 0 |
| (−5.344 2, 0.161 6) | 0.894 1 | −0.442 4 | (0.444 4, −0.231 5) | 5.088 2 | −0.304 1 |
The convergence speed differs by regime in a way that reflects the local dynamics rather than the network: the chaotic case at Ω = 1.65 locks in six perturbed steps because the chaotic attractor is densely threaded with periodic orbits, so a small shift in Ω finds one almost immediately; the quasi-periodic case needs about ten steps to reach period 3; and the period-2/3 to period-1 conversion needs roughly twenty. Driving chaos at Ω = 1.91 and 1.96 onto period 7 is slower, requiring more than 120 steps, because the target window is narrow and the perturbation must remain small enough not to leave the basin.
Design implications
For a spiral bevel drive of this configuration, the safest operating region in the speed–load plane is the no-impact, period-1 zone, which occupies a growing share of the plane as load increases. Two rules follow for design and for active operation. First, because the periodic structure is controlled mainly by the frequency ratio and by impact state while dynamic load responds to both the bifurcation structure and the mean load, a speed sweep at fixed nominal torque is not sufficient to certify a design — the certification must be made on the two-parameter map. Second, the DLC spike is not a resonance phenomenon but a grazing and crisis phenomenon, so it appears as a discontinuity at a specific parameter boundary rather than as a smooth peak, and it can be predicted from the clearance boundary condition without a dense frequency sweep.
When a drive must operate inside a chaotic or quasi-periodic band, the network-based parametric controller offers a practical route: the correction it applies is a fraction of a percent in Ω, it does not require a mathematical model of the gear train, and it can target multi-period orbits as well as period 1, which matters because the period-7 window at heavy load carries a lower dynamic load than the surrounding chaotic band. The remaining engineering question is measurement: the controller consumes Poincaré-section distances, so it presupposes an encoder or tachometer signal of sufficient resolution to reconstruct the mesh-cycle map at the operating speed.