
In this study, I investigate the fixation reliability and anti-loosening behavior of bolts used to secure rack and pinion gears in a heavy-duty drilling machine. The rack and pinion gears are not merely transmission components; they are the main load-carrying interface between the lifting box and the derrick. Because the rack and pinion gears actively provide both upward and downward force, the bolted connection of the rack must remain tight under no-load lifting, automatic drilling feed, high-speed drilling feed, and maximum hook load. I therefore combine standards-based design, multi-bolt load distribution theory, creep and relaxation analysis, thread load distribution models, finite element simulation, and experimental verification. The central question is how the arrangement of bolts, the thread geometry, and the transverse impact load influence the residual preload of the rack and pinion gears fastening system.
1. Engineering Context and Research Motivation
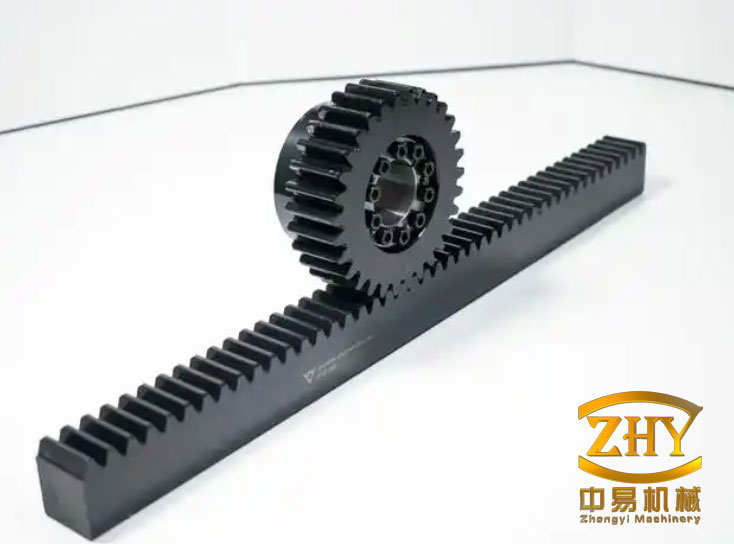
I start from the observation that conventional drilling rigs often rely on the self-weight of the drill string to provide weight on bit. In shallow sections, this passive method is inefficient. The rack and pinion gears in a modern drilling rig replace the traveling block, drawworks, and wire rope with a compact geared drive. A pinion mounted on the top drive engages a rack fixed to the derrick. As the pinion rotates, the top drive moves upward or downward. This arrangement allows the rack and pinion gears to provide active push-down force, which is especially valuable for directional wells, cluster wells, and horizontal wells.
The rack and pinion gears in this machine are large-modulus and heavy-load components. The rack is connected to the derrick connection plate through multiple high-strength bolts. The bolted joint must transfer friction and shear while resisting vibration, impact, and cyclic loading. If the rack and pinion gears lose bolt preload, the rack can slip relative to the derrick, the contact pattern of the rack and pinion gears can change, and the entire lifting system can fail. I therefore treat bolt fixation and anti-loosening as a system-level problem rather than a single-fastener problem.
I also recognize that existing standards provide useful but incomplete guidance for this application. Standards define minimum spacing, edge distance, and preload values, but they do not directly solve the problem of a long, heavy rack fastened to a flexible derrick plate. The rack and pinion gears experience moving contact loads, so the bolt group is not loaded uniformly. Some bolts carry more load than others, and the relative displacement between each bolt and its hole varies with the position of the pinion along the rack. I use this relative displacement as a practical indicator of fixation quality.
2. Bolt Design Standards and Preload Capacity
I first summarize the preload and resistance formulas used in Chinese, American, and European practice. These formulas provide a baseline for the rack and pinion gears bolt group. In friction-type high-strength bolted connections, the design shear resistance depends on the number of friction planes, the slip coefficient, and the bolt preload. The Chinese formula I use is
$$N_V^b = 0.9 n_f \mu P$$
where \(n_f\) is the number of friction planes, \(\mu\) is the slip coefficient, and \(P\) is the design preload. The American load and resistance factor design expression can be written as
$$R = \phi D_h T_b n_s \mu$$
where \(T_b\) is the minimum bolt preload, \(n_s\) is the number of slip planes, \(D_h\) is a factor accounting for the ratio of installed preload to specified preload, \(\phi\) is a resistance factor, and \(\mu\) is the slip coefficient. The European bearing resistance for a single lap joint with one bolt row is limited by
$$F_{m2} = \frac{1.5 f_u d t}{r_{m2}}$$
where \(f_u\) is the ultimate tensile strength of the connected part, \(d\) is the bolt diameter, \(t\) is the plate thickness, and \(r_{m2}\) is a material coefficient. These formulas show that the capacity of the rack and pinion gears connection depends strongly on preload, friction, and plate geometry.
Table 1 gives representative preload values for 8.8 and 10.9 grade bolts at different diameters. I use these values to select the initial preload for the rack and pinion gears fastening analysis.
| Bolt grade | Diameter (mm) | Chinese standard preload (kN) | American standard preload (kN) | European standard preload (kN) |
|---|---|---|---|---|
| 8.8 | 16 | 70 | 91 | 88 |
| 8.8 | 20 | 110 | 142 | 137 |
| 8.8 | 24 | 155 | 205 | 198 |
| 8.8 | 30 | 250 | 326 | 314 |
| 8.8 | 36 | 375 | 475 | 416 |
| 10.9 | 16 | 100 | 114 | 110 |
| 10.9 | 20 | 155 | 179 | 172 |
| 10.9 | 24 | 225 | 257 | 247 |
| 10.9 | 30 | 355 | 408 | 393 |
| 10.9 | 36 | 528 | 595 | 520 |
For the rack and pinion gears in this study, I selected M36 bolts. The geometric limits are also important. Standard minimum spacing is usually \(3d\), minimum edge distance is about \(1.5d\) to \(2d\), and maximum spacing is limited by plate buckling and corrosion considerations. In my model, the nominal bolt diameter is 36 mm, the standard hole diameter is 37 mm, and the initial preload is 469 kN. This preload level is consistent with a high-strength friction-type connection and provides a large normal force between the rack and the derrick connection plate.
3. Multi-Bolt Load Distribution in Rack and Pinion Gears
I next examine how the external load is shared among the bolts. For a single bolt, the load path is simple. For a multi-bolt joint, the load path is statically indeterminate. The rack and pinion gears introduce a moving load, so the bolt group is loaded sequentially rather than uniformly. I assume that load transfer is governed by friction and bolt shear, and I neglect the contribution of local contact stiffening at the plate edges. I also assume that the connected plates behave as elastic beams between bolt rows.
The total external load \(F\) is distributed among the bolts as
$$F = \sum_{i=1}^{n} P_i$$
where \(P_i\) is the load carried by bolt \(i\). The relative deformation of the rack between two adjacent bolts can be written as
$$\Delta r_{w,i} = \frac{\beta_w r F_w}{b_w t_w E_w}$$
where \(\beta_w\) is a stress concentration factor for the rack, \(r\) is the bolt pitch, \(F_w\) is the internal force in the rack, \(b_w\) is the rack width, \(t_w\) is the rack thickness, and \(E_w\) is the elastic modulus. Similarly, the deformation of the derrick connection plate is
$$\Delta r_{p,i} = \frac{\beta_p r F_p}{b_p t_p E_p}$$
where the subscript \(p\) denotes the derrick connection plate. The compatibility condition between adjacent bolts gives
$$P_{i+1} = P_i + K_p P_p – K_w F_w$$
where the stiffness parameters are
$$K_p = \frac{\beta_p r}{b_p t_p E_p}, \quad K_w = \frac{\beta_w r}{b_w t_w E_w}$$
Combining the expressions for adjacent bolts yields the recurrence relation
$$P_{i-1} – (2 + K_p + K_w) P_i + P_{i+1} = 0$$
If I define
$$\alpha = 1 + K_p + K_w$$
then the recurrence becomes
$$P_{i-1} – \alpha P_i + P_{i+1} = 0$$
This relation shows that the bolt loads are not equal. The bolts near the applied load carry more force, while the bolts far from the load carry less. The rack and pinion gears therefore require a bolt arrangement that minimizes the standard deviation of the bolt-to-hole relative displacement, not merely a bolt arrangement that satisfies the average shear capacity.
4. Creep and Preload Relaxation
I now consider the time-dependent loss of preload. Even when the rack and pinion gears are not moving, the bolt preload can decrease because of creep in the contact regions. Creep is the increase of strain under a constant load. In bolted joints, creep occurs at the thread flanks, under the bolt head, under the nut, and between the rack and the derrick connection plate. The contact pressure is high, so local plastic deformation and creep can reduce the clamp force.
The general creep law can be written as
$$\dot{\varepsilon}_{cr} = f(\sigma, \varepsilon_{cr}, T)$$
One classical form is the Dorn model:
$$\dot{\varepsilon}_{cr} = A e^{-\Delta H / RT} \sigma^n$$
where \(A\) is a constant, \(\Delta H\) is the activation energy, \(R\) is the gas constant, \(T\) is the absolute temperature, and \(n\) is the stress exponent. The temperature-compensated time \(\theta\) is defined as
$$\theta = \int_0^t e^{-\Delta H / RT} dt$$
and the creep strain can be expressed as
$$\varepsilon_{cr} = \varepsilon_{cr,0} + Z \theta$$
where \(Z\) is the Zener-Hollomon parameter. Although this model is physically meaningful, it can require small time steps and may converge slowly in a complex contact model.
For the rack and pinion gears bolt group, I selected the combined time hardening model available in the finite element code. The creep strain rate is
$$\dot{\varepsilon}_{cr} = C_1 \sigma^{C_2} t^{C_3} e^{-C_4/T} + C_5 \sigma^{C_6} t^{C_7} e^{-C_4/T}$$
where \(C_1\) through \(C_7\) are material constants. This model captures both primary and secondary creep and generally provides better numerical stability than simple explicit creep models. I used the constants listed in Table 2 for the connected parts and for the bolt and nut.
| Component | \(C_1\) | \(C_2\) | \(C_3\) | \(C_4\) | \(C_5\) | \(C_6\) | \(C_7\) |
|---|---|---|---|---|---|---|---|
| Connected part | 2.5E-08 | 1.28 | -0.999 | 1935 | 1E-14 | 23.19 | 40000 |
| Bolt and nut | 6.8E-16 | 5 | -0.213 | 1935 | 2.35E-7 | 10.29 | 40000 |
I applied the preload in three stages. In the first stage, I used a bolt pretension element to simulate tightening. In the second stage, I locked the pretension element to represent the tightened state and allowed creep to develop. In the third stage, I observed the residual preload and the local plastic deformation. This staged approach allows me to separate the immediate elastic response from the long-term relaxation of the rack and pinion gears connection.
5. Contact Nonlinearity and Numerical Solution
The rack and pinion gears fastening problem is highly nonlinear. The nonlinearity comes from contact status changes, material plasticity, creep, and large local deformations near the bolt holes. I classify the problem as a combination of state nonlinearity and material nonlinearity. Contact is the most important source of state nonlinearity because the contact area, contact pressure, and slip state change as the load moves along the rack and pinion gears.
I use the Newton-Raphson method to solve the nonlinear equilibrium equations. The incremental equilibrium equation is
$$[K_T] \{\Delta u\} = \{F_a\} – \{F_{nr}\}$$
where \([K_T]\) is the tangent stiffness matrix, \(\{\Delta u\}\) is the displacement increment, \(\{F_a\}\) is the applied nodal load vector, and \(\{F_{nr}\}\) is the internal nodal force vector. In the early load steps, I use the modified Newton-Raphson method to reduce computational cost. In the later load steps, when contact and plasticity are active, I use the full Newton-Raphson method to improve convergence.
For contact enforcement, I considered the penalty method, the Lagrange multiplier method, and the augmented Lagrangian method. The penalty method is simple but can allow small penetration. The Lagrange multiplier method enforces non-penetration exactly but increases the number of unknowns. The augmented Lagrangian method combines the advantages of both and is therefore used for the rack and pinion gears bolt contact model. Table 3 lists the contact definitions I used.
| Contact pair | Contact type | Friction coefficient |
|---|---|---|
| Rack and derrick connection plate | Frictional | 0.40 |
| Bolt head and rack | Frictional | 0.20 |
| Bolt shank and bolt hole | Frictional | 0.20 |
| Nut and derrick connection plate | Frictional | 0.20 |
| Bolt and nut | Bonded | — |
| Support tube and rack | Bonded | — |
I used a three-second load history. In the first second, I fixed the back face of the derrick connection plate in all three directions. In the second second, I applied a preload of 469 kN to each bolt. In the third second, I applied a working load of 625 kN at the rack tooth engagement location. This load corresponds to a single-side single-pinion condition under the maximum hook load of the rack and pinion gears drilling machine. I repeated the analysis for six engagement points along the rack to capture the moving load effect.
6. Parametric Modeling of Rack Fixation
To study many bolt layouts efficiently, I developed a parametric model of the rack and pinion gears fixation. The model includes the rack, the derrick connection plate, the bolts, and the nuts. The main variables are bolt pitch \(P\), end distance \(e\), hole diameter \(D\), and derrick connection plate thickness \(t\). I use a CAD application programming interface to generate the geometry automatically and a finite element program to solve the model. This reduces the manual modeling effort and ensures that each layout is compared under the same boundary conditions.
I evaluate the fixation quality by the relative displacement between each bolt and its corresponding hole in the rack. The relative displacement for bolt \(i\) is
$$\Delta y_i = y_{bolt,i} – y_{hole,i}$$
where \(y_{bolt,i}\) is the vertical displacement of the bolt and \(y_{hole,i}\) is the vertical displacement of the rack hole. I then compute the standard deviation
$$S = \sqrt{\frac{1}{n} \sum_{i=1}^{n} \left( \Delta y_i – \overline{\Delta y} \right)^2}$$
where \(\overline{\Delta y}\) is the mean relative displacement. A smaller standard deviation means that the bolts and holes move together more uniformly, so the risk of local slip and uneven load sharing is lower. I treat this standard deviation as the fixation quality index for the rack and pinion gears bolt group.
Table 4 summarizes the baseline parameters. The rack material is a high-strength alloy steel, the derrick connection plate is structural steel, and the bolts are M36 grade 8.8 with grade 9 nuts. The nominal preload is 469 kN, and the working load is 625 kN in the vertical direction.
| Parameter | Baseline value |
|---|---|
| Bolt diameter | 36 mm |
| Hole diameter | 37 mm |
| Bolt pitch | 200 mm |
| End distance | 160 mm |
| Derrick connection plate thickness | 16 mm |
| Preload | 469 kN |
| Working load | 625 kN |
7. Effects of Bolt Layout Parameters
I performed a single-factor parametric study on the rack and pinion gears fastening system. I varied one parameter at a time while keeping the others at the baseline values. The objective was to identify the layout that minimizes the standard deviation of the bolt-to-hole relative displacement. I also checked that the von Mises stress remained below the allowable stress of the rack and pinion gears materials.
For bolt pitch, I considered 100, 150, 200, 250, and 300 mm. The relative displacement curves have similar trends for all pitches, but the standard deviation is smallest at 200 mm. When the pitch is too small, the bolts interact strongly and the load concentration near the engagement point increases. When the pitch is too large, the plate flexibility between bolts increases, and the rack and pinion gears load is transferred less uniformly. Table 5 gives the standard deviation for different bolt pitches.
| Bolt pitch (mm) | Standard deviation of \(\Delta y_i\) (mm) | Relative fixation ranking |
|---|---|---|
| 100 | 0.00942 | 4 |
| 150 | 0.00831 | 3 |
| 200 | 0.00695 | 1 |
| 250 | 0.00778 | 2 |
| 300 | 0.01015 | 5 |
For end distance, I considered \(1.5d\), \(2d\), \(2.5d\), \(3d\), and \(3.5d\), where \(d\) is the bolt diameter. The relative displacement decreases as the end distance increases. The standard deviation also decreases. This is because a larger end distance reduces the stress concentration at the end bolt and allows the rack and pinion gears load to spread over a longer region. However, the end distance cannot be increased without limit because the plate size and the derrick interface constrain the design. Table 6 shows the results.
| End distance | Standard deviation of \(\Delta y_i\) (mm) | Trend |
|---|---|---|
| 1.5d | 0.01120 | Highest |
| 2.0d | 0.00935 | Decreasing |
| 2.5d | 0.00780 | Decreasing |
| 3.0d | 0.00695 | Decreasing |
| 3.5d | 0.00612 | Lowest |
For hole diameter, I considered 37, 38, 39, 40, and 41 mm. The nominal bolt diameter is 36 mm, so 37 mm represents a standard clearance hole. As the hole diameter increases, the contact area between the bolt shank and the hole decreases, and the preload-induced friction area near the hole also changes. The result is a larger relative displacement and a larger standard deviation. I found that the standard deviation is smallest for the 37 mm hole. This agrees with the general observation that oversized holes reduce the slip resistance of high-strength bolted connections. Table 7 gives the results.
| Hole diameter (mm) | Standard deviation of \(\Delta y_i\) (mm) | Contact condition |
|---|---|---|
| 37 | 0.00695 | Standard clearance |
| 38 | 0.00748 | Increased clearance |
| 39 | 0.00812 | Increased clearance |
| 40 | 0.00891 | Increased clearance |
| 41 | 0.00977 | Oversized |
For derrick connection plate thickness, I considered 16, 20, 25, 30, and 35 mm. Increasing the plate thickness increases the local stiffness, but it also changes the load path and the bolt bending behavior. I found that the relative displacement near the engagement point increases as the plate thickness increases. The standard deviation also increases. This indicates that a thicker plate is not always better for the rack and pinion gears fixation. The optimum is a compromise between global stiffness and local compliance. Table 8 summarizes the results.
| Plate thickness (mm) | Standard deviation of \(\Delta y_i\) (mm) | Fixation effect |
|---|---|---|
| 16 | 0.00695 | Best |
| 20 | 0.00763 | Good |
| 25 | 0.00854 | Moderate |
| 30 | 0.00961 | Lower |
| 35 | 0.01082 | Lowest |
From these results, I conclude that for heavy-duty rack and pinion gears, a 36 mm bolt with a 200 mm pitch, a larger end distance, a standard hole, and a thinner derrick connection plate gives the best fixation quality. The practical design should still satisfy strength and stiffness requirements, but the standard deviation index provides a clear way to compare alternative bolt layouts.
8. Thread Load Distribution and Validation
The bolt itself is not a simple tension member. The load enters the bolt through the threads, and the distribution of load along the engaged threads strongly affects fatigue, creep, and loosening. I studied thread load distribution using the Sopwith method, the Yamamoto method, a finite element model with a real thread helix, and published photoelastic data. The Sopwith method treats each thread as a short beam and gives
$$p(x) = \frac{F \gamma \cosh(\gamma x)}{\sinh(\gamma L)}$$
and
$$Q(x) = \frac{F \sinh(\gamma x)}{\sinh(\gamma L)}$$
where \(p(x)\) is the distributed axial load per unit length, \(Q(x)\) is the bolt axial force, \(L\) is the engagement length, and \(\gamma\) is a stiffness parameter. The Yamamoto method uses a plane strain approximation and gives
$$\frac{d^2 F}{dx^2} = \lambda^2 F$$
with the solution
$$F(x) = \frac{F_0 \sinh(\lambda x)}{\sinh(\lambda L)}$$
where \(\lambda\) depends on the elastic properties and the thread geometry. Both methods predict that the first engaged thread carries the largest share of the load, and the load decreases rapidly toward the free end of the nut.
I validated my finite element model against these analytical methods and against photoelastic measurements. Table 9 compares the load share of the first thread and the first three threads. The finite element result is 36.4 percent for the first thread. The Sopwith result is 32.4 percent, the Yamamoto result is 28.6 percent, and the photoelastic result is 32.5 percent. Although the exact values differ, all methods agree that the first thread carries the highest load and that the first three threads carry more than 60 percent of the total load. This validation gives me confidence in the finite element model used for the rack and pinion gears bolt analysis.
| Method | First thread load share (%) | First three threads load share (%) |
|---|---|---|
| Finite element | 36.4 | 68.2 |
| Sopwith | 32.4 | 64.1 |
| Yamamoto | 28.6 | 61.5 |
| Photoelastic | 32.5 | 63.8 |
9. Thread Geometry Effects on Load and Relaxation
I then investigated how thread parameters affect load sharing and preload relaxation in the rack and pinion gears bolts. The parameters are the number of engaged threads, the friction coefficient, the pressure angle, the minor diameter, and the pitch. I used the validated single-bolt finite element model and applied a preload of 469 kN.
Increasing the number of engaged threads reduces the load share of the first thread and makes the load distribution more uniform. The variance of the thread load decreases sharply as the engagement number increases from 5 to 15. In terms of relaxation, the preload change decreases from about 5730 N to about 650 N when the engagement number increases. This means that a longer nut or a deeper thread engagement can significantly improve the anti-loosening performance of the rack and pinion gears bolts.
| Engaged threads | First thread load share (%) | Preload change after relaxation (N) |
|---|---|---|
| 5 | 43.1 | 5730 |
| 7 | 40.2 | 3980 |
| 9 | 38.0 | 2410 |
| 12 | 36.4 | 1120 |
| 15 | 35.6 | 650 |
The friction coefficient between the threads has only a small effect on thread load distribution. As the friction coefficient decreases, the thread load share changes slightly because the load is carried more by the thread geometry than by friction. However, the effect on preload relaxation is also small. The preload change varies from about 800 N to 762 N over the studied range. This suggests that friction alone cannot solve the relaxation problem in the rack and pinion gears connection.
| Thread friction coefficient | First thread load share (%) | Preload change after relaxation (N) |
|---|---|---|
| 0.10 | 36.0 | 800 |
| 0.15 | 36.4 | 786 |
| 0.20 | 36.8 | 775 |
| 0.25 | 37.1 | 768 |
| 0.30 | 37.4 | 762 |
The pressure angle has a moderate effect. As the pressure angle increases, the thread root becomes thicker, but the bending moment at the root also increases. The first thread load share increases slightly, and the preload relaxation increases from about 752 N to 833 N. This means that a larger pressure angle is not necessarily better for the rack and pinion gears bolts, because it can promote local stress concentration at the thread root.
| Pressure angle (degrees) | First thread load share (%) | Preload change after relaxation (N) |
|---|---|---|
| 58.5 | 35.7 | 752 |
| 60.0 | 36.4 | 776 |
| 61.5 | 36.8 | 795 |
| 63.0 | 37.1 | 814 |
| 64.5 | 37.3 | 833 |
The minor diameter has a small effect on load distribution but a noticeable effect on relaxation. As the minor diameter increases, the bolt becomes stiffer and the thread root becomes stronger, but the load concentration in the first few threads also changes. The preload change decreases from about 776 N to 674 N over the studied range. This indicates that a carefully chosen minor diameter can reduce relaxation without greatly changing the load distribution.
| Minor diameter (mm) | First thread load share (%) | Preload change after relaxation (N) |
|---|---|---|
| 16.918 | 36.1 | 776 |
| 17.018 | 36.3 | 742 |
| 17.118 | 36.4 | 715 |
| 17.218 | 36.5 | 692 |
| 17.318 | 36.6 | 674 |
The pitch has a strong effect on both load distribution and relaxation. As the pitch increases, the first thread load share increases, and the load distribution becomes less uniform. The variance increases almost exponentially with pitch. The preload change increases from about 780 N to about 1120 N. Therefore, a smaller pitch is preferable for uniform thread loading and reduced relaxation in the rack and pinion gears bolts, provided that the thread strength and manufacturing requirements are satisfied.
| Pitch (mm) | First thread load share (%) | Preload change after relaxation (N) |
|---|---|---|
| 2.0 | 36.4 | 780 |
| 2.5 | 38.0 | 860 |
| 3.0 | 39.4 | 930 |
| 3.5 | 40.6 | 1010 |
| 4.0 | 41.1 | 1120 |
10. Transverse Loading and Bolt Loosening
The most severe loading condition for the rack and pinion gears bolts is not pure tension but transverse impact. When the pinion moves along the rack, the engagement force changes direction and magnitude. This creates a cyclic transverse displacement between the connected plates. Under repeated transverse loading, the bolt can rotate and lose preload even if the axial load is below the yield strength.
I modeled transverse loading using a triangular wave applied to the plate that represents the rack. The bolt was first tightened to a specified preload, and then cyclic transverse displacement was applied. The residual preload ratio is defined as
$$R_p = \frac{F_r}{F_0} \times 100\%$$
where \(F_r\) is the residual preload and \(F_0\) is the initial preload. I studied the effects of initial preload, load amplitude, and thread friction coefficient.
For initial preload, I considered 400, 420, 450, 469, and 500 kN. A higher initial preload produces a larger contact pressure and a larger friction force, which should resist slip. However, a higher initial preload also produces a larger thread root stress and more plastic deformation, so the preload can drop faster in the early cycles. I found that the percentage loss is smaller for higher initial preload, but the initial rate of loss is higher. The fitted curve slopes satisfy
$$y_5′ > y_4′ > y_3′ > y_2′ > y_1’$$
which means that the preload change rate is faster when the initial preload is smaller in the early stage, but the total percentage loss is larger when the initial preload is smaller. The practical conclusion is that a sufficiently high preload is beneficial for the rack and pinion gears connection, but the preload should not be so high that thread yielding occurs.
| Initial preload (kN) | Percentage loss after cyclic loading (%) | Observed trend |
|---|---|---|
| 400 | 7.8 | Largest percentage loss |
| 420 | 7.1 | High loss |
| 450 | 6.4 | Moderate loss |
| 469 | 5.9 | Lower loss |
| 500 | 5.4 | Lowest percentage loss |
For load amplitude, I considered 0.2, 0.3, 0.4, 0.5, and 0.6 mm. The larger the amplitude, the faster the preload drops and the larger the final loss. A larger transverse displacement causes more micro-slip at the thread interface and under the bolt head. The contact asperities deform plastically, and the clamp force decreases. Table 14 shows the trend.
| Load amplitude (mm) | Preload loss after 12 load steps (%) | Loosening risk |
|---|---|---|
| 0.2 | 5.9 | Low |
| 0.3 | 8.3 | Moderate |
| 0.4 | 11.5 | High |
| 0.5 | 15.2 | Very high |
| 0.6 | 19.6 | Severe |
For thread friction coefficient, I considered 0.10, 0.15, and 0.30. A lower friction coefficient allows easier relative slip between the threads, so the bolt loses preload faster. A higher friction coefficient increases the resistance to slip, but it also increases the local shear stress at the thread surface and can cause wear. Therefore, the optimal friction coefficient is a compromise between anti-loosening and wear resistance. Table 15 gives the results.
| Thread friction coefficient | Preload loss after cyclic loading (%) | Slip resistance |
|---|---|---|
| 0.10 | 8.7 | Low |
| 0.15 | 5.9 | Moderate |
| 0.30 | 3.2 | High |
11. Experimental Validation on a Rack and Pinion Lifting Rig
I validated the numerical model using a rack and pinion lifting test rig. The rig represents the lifting box, the derrick connection plate, and the rack and pinion gears. I attached strain gauges to the rack near the bolt holes and to the rack teeth. I used a data acquisition system to record the strain under four load levels: 100 t, 150 t, 200 t, and 250 t. These correspond to hydraulic pressures of 4 MPa, 6 MPa, 8 MPa, and 10 MPa. I repeated each measurement three times and used the average value.
The measured maximum strain near the bolt holes remained within the elastic range. The maximum measured strain was 0.000432. Because the material was in the elastic range, the strain and stress were proportional. I compared the measured stress with the finite element result for the same load. The maximum difference was less than 5 percent. This agreement supports the use of the finite element model for the rack and pinion gears fixation study.
| Hydraulic pressure (MPa) | Applied load (t) | Measured maximum strain | Finite element stress (MPa) | Difference (%) |
|---|---|---|---|---|
| 4 | 100 | 0.000172 | 35.0 | 3.8 |
| 6 | 150 | 0.000258 | 52.4 | 4.1 |
| 8 | 200 | 0.000345 | 70.1 | 4.3 |
| 10 | 250 | 0.000432 | 87.9 | 4.6 |
I also examined the strain around each bolt hole along a single rack. As the hook load increased, the strain around the bolt holes increased almost linearly. The trend was consistent with the finite element prediction. This confirms that the bolt group remains in the elastic range under the tested conditions and that the relative displacement method is a practical way to evaluate the fixation quality of the rack and pinion gears.
The experimental results also show that the rack and pinion gears connection does not experience gross slip under the design loads. The bolts and the rack holes move together, and the local strain distribution remains stable. This supports the proposed bolt layout with a 200 mm pitch, a larger end distance, a standard clearance hole, and a carefully selected plate thickness.
12. Conclusions
I have studied the bolt fixation and anti-loosening problem for rack and pinion gears in a heavy-duty drilling machine. The main findings are as follows.
First, the multi-bolt load distribution in rack and pinion gears is non-uniform. The bolts near the moving pinion load carry more force, and the relative displacement between the bolt and the hole is a useful index of fixation quality. I used the standard deviation of this relative displacement to compare different bolt layouts. For the studied rack and pinion gears, a 36 mm bolt with a 200 mm pitch, a larger end distance, a standard 37 mm hole, and a thinner derrick connection plate gave the best fixation quality.
Second, the thread load distribution is highly concentrated on the first few engaged threads. The first thread carries about 36 percent of the load in the finite element model, and the first three threads carry more than 60 percent. The Sopwith method, the Yamamoto method, the finite element method, and photoelastic data all support this conclusion. Increasing the number of engaged threads improves load sharing and reduces preload relaxation. Reducing the pitch also improves load uniformity. The pressure angle and minor diameter have smaller but still meaningful effects.
Third, creep and plastic deformation cause preload relaxation in the rack and pinion gears bolts. The combined time hardening model captures this behavior with good numerical stability. A longer thread engagement and a smaller pitch reduce relaxation. A higher initial preload reduces the percentage loss but increases the initial relaxation rate, so the preload must be chosen carefully.
Fourth, transverse impact loading is the most dangerous condition for bolt loosening. A larger transverse amplitude causes faster preload loss. A lower thread friction coefficient also causes faster loss. A higher friction coefficient improves anti-loosening performance but may increase wear. The rack and pinion gears connection should therefore use a controlled preload, a suitable thread friction condition, and a locking feature that prevents relative rotation.
Fifth, the experimental results from the rack and pinion lifting rig agree with the finite element predictions within 5 percent. The measured strain remains in the elastic range under the tested loads, and the bolt holes show stable behavior. This validates the numerical model and supports the proposed fixation strategy for rack and pinion gears.
In future work, I plan to extend the study to different rack and pinion gears engagement positions and to include controlled bolt failure scenarios. This will help quantify the safety margin of the rack and pinion gears fastening system under real drilling vibration and impact. The results provide a practical basis for designing reliable bolted joints for rack and pinion gears in automated drilling machines.