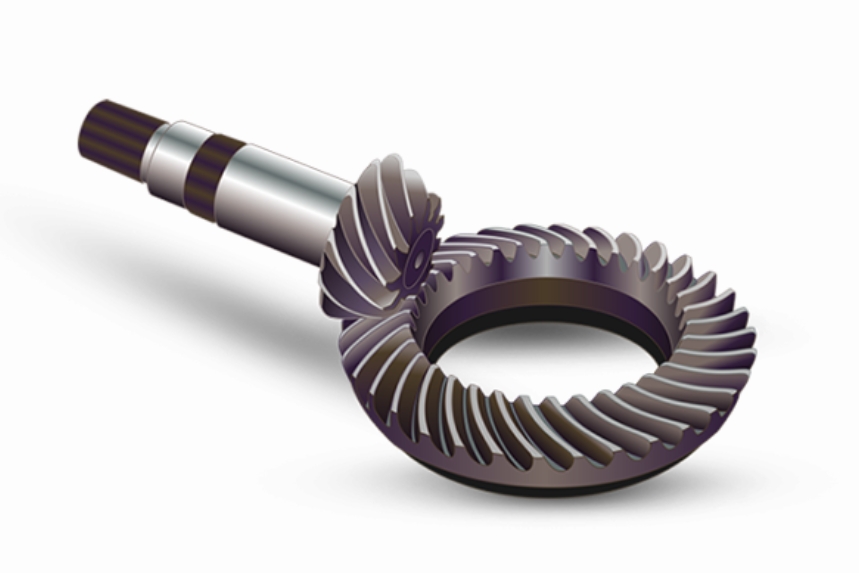
Spiral bevel gears are critical components in mechanical transmission systems for intersecting or skew axes. Their tooth surface accuracy directly impacts operational performance, noise, and durability. This study proposes a bootstrap-based statistical model to evaluate the tooth surface deviation of heat-treated spiral bevel gears, enabling efficient batch quality assessment with limited samples.

1. Bootstrap Statistical Methodology
For spiral bevel gears with identical materials, machining processes, and heat treatment specifications, the bootstrap method resamples limited measurement data to predict batch characteristics:
1.1 Probability Feature Extraction
Let $\sigma_i$ denote the tooth surface deviation at the $m^{th}$ measurement point of the $i^{th}$ gear. The initial sample sequence is:
$$\sigma = (\sigma_1, \sigma_2, \ldots, \sigma_n)$$
Bootstrap resampling generates $B$ simulated datasets $\xi_B$ through $L$-times random sampling with replacement:
$$\xi_B = (\xi_b(1), \xi_b(2), \ldots, \xi_b(B))$$
The mean and variance of bootstrap samples are calculated as:
$$\bar{\xi}_B = \frac{1}{B}\sum_{j=1}^{B}\bar{\xi}_{b(j)}$$
$$\delta^2 = \frac{1}{B-1}\sum_{j=1}^{B}(\bar{\xi}_{b(j)} – \bar{\xi}_B)^2$$
1.2 Confidence Interval Estimation
Using percentile method for $1-\alpha$ confidence level:
$$P\{\theta_{\alpha/2} < \theta < \theta_{1-\alpha/2}\} = 1-\alpha$$
where $\theta_{K1}$ and $\theta_{K2}$ represent the $\frac{\alpha}{2}$ and $1-\frac{\alpha}{2}$ quantiles of ordered bootstrap estimates.
2. Tooth Surface Reconstruction
The NURBS surface reconstruction for spiral bevel gears is expressed as:
$$P(u,v) = \frac{\sum_{i=0}^n \sum_{j=0}^m B_{i,k}(u)B_{j,l}(v)W_{i,j}V_{i,j}}{\sum_{i=0}^n \sum_{j=0}^m B_{i,k}(u)B_{j,l}(v)W_{i,j}}$$
where $B_{i,k}(u)$ and $B_{j,l}(v)$ are B-spline basis functions, $W_{i,j}$ are weights, and $V_{i,j}$ are control vertices.
3. Experimental Validation
Batch testing of automotive differential spiral bevel gears (15×15 measurement grid) demonstrates the methodology:
3.1 Bootstrap Analysis
Table 1 compares probability features between original and bootstrap samples:
| Samples | Original Mean | Bootstrap Mean | Error | Original Variance | Bootstrap Variance | Error |
|---|---|---|---|---|---|---|
| 10 | -1.6100 | -1.5994 | 0.66% | 3.7693 | 3.5798 | 5.03% |
| 20 | -0.9050 | -0.9082 | 0.35% | 3.2744 | 3.1908 | 2.64% |
| 35 | 0.5029 | 0.5030 | 0.019% | 4.0072 | 3.9493 | 1.44% |
3.2 Surface Reconstruction Comparison
Figure 1 illustrates the relationship between reconstructed surfaces using different sample sizes. The bootstrap mean deviation surface converges toward the actual mean surface as sample size increases, particularly at critical measurement points.
4. Conclusion
The bootstrap statistical model effectively predicts heat treatment-induced deviations in spiral bevel gears:
- Requires only 10-35 samples for accurate batch characterization
- Reduces mean estimation error to <0.5% with 35 samples
- Provides 95% confidence intervals for process control
This methodology enables efficient quality evaluation and process optimization for high-precision spiral bevel gear manufacturing.
$$B_{i,k}(x) = \frac{x-s_i}{s_{i+k}-s_i}B_{i,k-1}(x) + \frac{s_{i+k+1}-x}{s_{i+k+1}-s_{i+1}}B_{i+1,k-1}(x)$$
| Parameter | 5 Samples | 10 Samples | 20 Samples |
|---|---|---|---|
| Mean ($\mu$m) | (-1.732, 1.698) | (-0.913, -0.903) | (0.426, 0.437) |
| Variance | (3.122, 3.891) | (3.187, 3.194) | (3.922, 3.931) |
