
Abstract
The hypoid gear is a crucial component in drive axles, often operating under heavy-load and high-speed conditions. This leads to significant system deformation and complex tooth surface meshing. Existing research on gear meshing efficiency has limitations, especially in considering system deformation. This paper proposes a method to calculate the meshing efficiency of hypoid gears in drive axles, considering system deformation. It involves using a multi-support shaft system model to calculate gear misalignment, deriving the friction coefficient distribution, and establishing a gear friction-loaded tooth contact analysis method. Experimental results validate the accuracy of the proposed method, showing its effectiveness in calculating tooth surface load distribution and meshing efficiency.
1. Gear Friction Loaded Contact Analysis
1.1 Drive Axle System Deformation and Gear Mismatch
1.1.1 Multi-Support Shaft System Coupling Analysis Model
The drive axle system’s complexity causes deformation under load, leading to gear misalignment. The multi-support shaft system coupling analysis model calculates system deformation. For a commercial vehicle’s rear drive axle, the system stiffness equation K•δ=F is used, where K is the system stiffness matrix, δ is the node displacement, and F is the external force. Solving this equation gives the displacement and force at each node.
| Component | Description |
|---|---|
| Power Input | Source of power to the system |
| Front Bearing | Supports the active gear |
| Middle Bearing | Also supports the active gear |
| Differential Case | Houses the differential gears |
| Active Gear | Transfers power |
| Power Output | Where power exits the system |
| Left and Right Bearings | Support the output shafts |
| Left and Right Output Half Axles | Transmit power to the wheels |
| Passive Gear | Receives power from the active gear |
1.1.2 Gear Mismatch Calculation
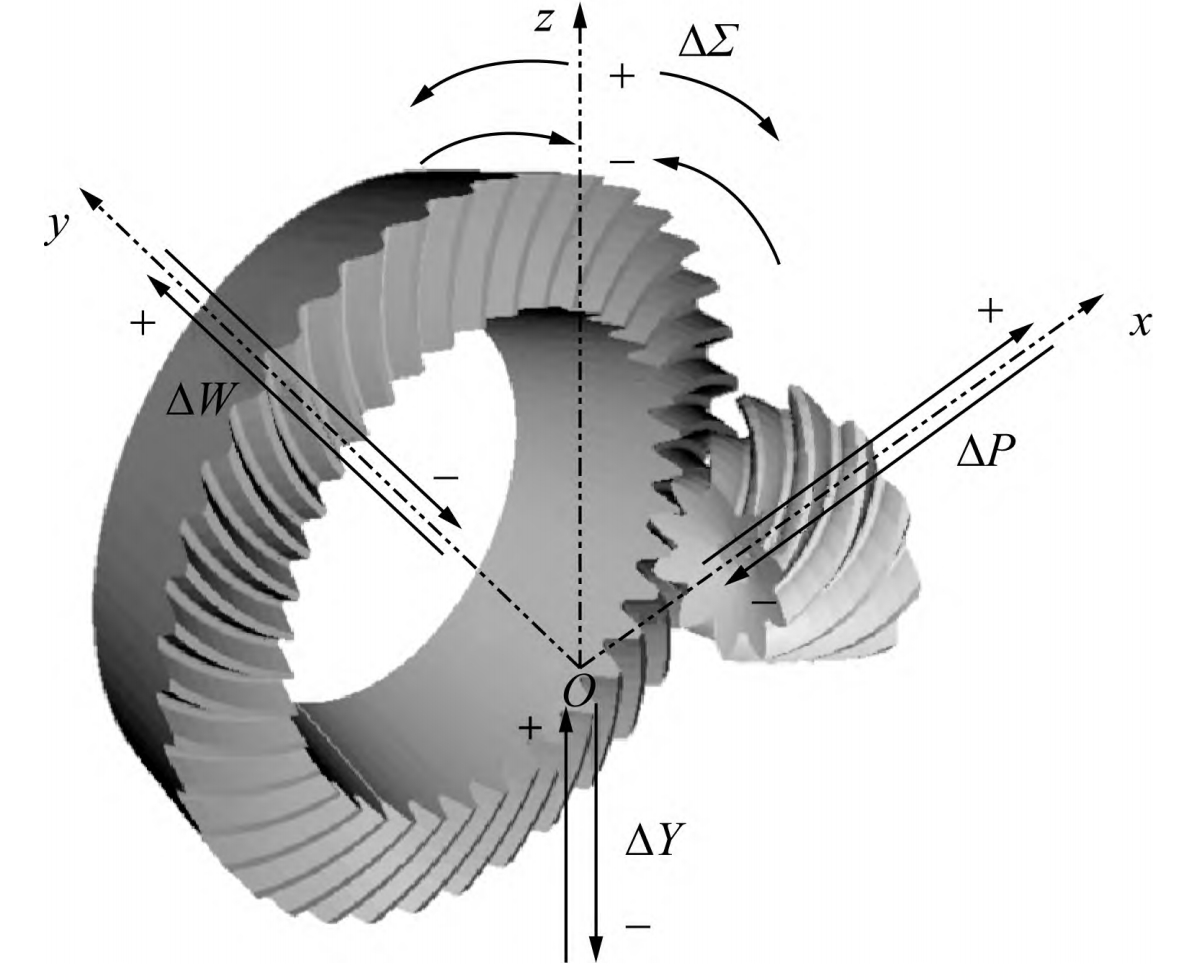
The misalignment of hypoid gears is calculated based on the node displacements of the active and passive gears. The displacements in different directions are used to determine the misalignment in the axial, transverse, and offset directions, as well as the angular misalignment. The total misalignment of the gear pair is then calculated by combining these individual misalignments.
| Displacement | Active Gear | Passive Gear |
|---|---|---|
| Axial (ΔP) | ΔP1=δpx | ΔP2=-δgx-GPcosβsinθgz |
| Transverse (ΔW) | ΔW1=-δpy+WPcosαsinθpx | ΔW2=δgy |
| Offset (ΔY) | ΔY1=-δpz+WPcosαsinθpy | ΔY2=δgz-GPcosβsinδgy |
| Angular (Δ∑) | Δ∑1 = -θpz | Δ∑1 = -θgz |
1.2 Hypoid Gear Tooth Surface
The tooth surface of the hypoid gear is determined by machine tool processing parameters. By simulating the tool’s motion, the spatial coordinates of the tooth surface points are obtained and transformed to the gear blank coordinate system. The radial and normal coordinates of the tooth surface points are functions of the machine tool processing parameters. Discrete tooth surface points are fitted using the Ferguson curve cubic spline function for contact analysis.
| Parameter | Description |
|---|---|
| θd | Tool disc rotation angle around the center |
| φd | Tool disc center rotation angle around the cradle |
| ξc | Machine tool processing parameter vector |
| r | Radial coordinate of the tooth surface point |
| n | Normal coordinate of the tooth surface point |
1.3 Mixed Lubrication Friction Coefficient
In high-speed and heavy-load conditions, the tooth surface of the hypoid gear is in a mixed lubrication state. The friction coefficient is calculated using a weighted function model, considering fluid and boundary lubrication. The oil film thickness and various factors related to the lubrication state are used in the calculation (see Eqs. 8 – 16).
| Parameter | Formula | Description |
|---|---|---|
| μML | μML = μFLf12k+μDC(1-fK) | Mixed lubrication friction coefficient |
| fK | fK = 1.21λ^0.64/1+0.37^1.28 | Contact load carrying factor |
| λ | λ = h0/S | Oil film thickness ratio |
| S | S = √Sr1^2+Sr2^2 | Equivalent roughness |
| h0 | h0 = 2.69W^-0.067U^0.67G^0.53(1-0.61e^-0.73t) | Central oil film thickness at the meshing point |
| W | W = Fm/EeqRx^2 | Dimensionless load factor |
| U | U = Veu0/EeqRx | Dimensionless speed factor |
| G | G = αEeq | Dimensionless material factor |
| Eeq | Eeq = 2[1-v1^2/E1+1-v2^2/E2]^-1 | Equivalent elastic modulus of materials |
| I | I = 1.03(Rx/Ry)^0.64 | Contact point ellipticity |
| μFL | See Eq. 15 | Fluid lubrication friction coefficient |
| SR | SR = 2Vs/Vr | Sliding – rolling ratio |
1.4 Drive Axle System Gear FLTCA Method
The FLTCA method for the drive axle system gear involves several steps. It starts with establishing and solving the static model of the drive axle system to obtain gear misalignment and bearing forces. Then, the actual tooth surfaces of the gears are calculated based on geometric and processing parameters. After determining the lubrication parameters, an iterative process is carried out to calculate the tooth surface load distribution and meshing efficiency, considering deformation and load balance equations.
| Step | Description |
|---|---|
| 1 | Build and solve the drive axle system’s static model to get gear misalignment and bearing forces |
| 2 | Calculate the actual tooth surfaces of the gears using basic geometric and processing parameters |
| 3 | Determine the lubrication oil parameters and tooth surface roughness |
| 4 | Perform a no-load contact analysis considering system deformation to get the contact points and patterns |
| 5 | Calculate the gear’s bending, shear, and contact deformations and check the deformation coordination equation |
| 6 | Compute the tooth surface contact force at each meshing moment and verify the load balance equation |
| 7 | Calculate the tooth surface contact pressure distribution using the Hertz contact formula and check for convergence |
| 8 | Output the results of tooth surface load distribution and meshing efficiency |
2. Meshing Efficiency
The meshing efficiency of the hypoid gear is calculated using the drive axle transmission efficiency test bench. The efficiency is expressed as the ratio of output power to the sum of output power and total meshing power loss (see Eqs. 19 – 21). The total meshing power loss is calculated by integrating the instantaneous power loss over a meshing cycle, which is related to the tooth surface contact force and relative sliding speed.
| Parameter | Formula | Description | ||||
|---|---|---|---|---|---|---|
| ηg,fric | ηg,fric = Pout/Pout+Pg,fric=|Tout|ωαut/|Tout|ωαut + Pg,fric | T_{out}\right | \omega_{aut}}{ | T_{out} | \omega_{aut}+p_{g, fric}}$ | Gear meshing efficiency |
| Pg,fric | Pg,fric = 1/θ1-θ2∫θ2θ1Pinstdθ | Total meshing power loss of the gear pair | ||||
| Pinst | Pinst = m∑i=1 n∑j=1|Fij||vsij| | F_{ij}\right | \left | v_{sij}\right | $ | Instantaneous power loss at each meshing moment |
3. Experimental Verification
3.1 System Loading Test
A loading test on the drive axle was conducted to verify the consistency between the theoretical and actual contact patterns of the hypoid gear. The test included forward and reverse driving conditions with different load levels. The gear misalignment under various load conditions was calculated (see Table 1). The contact patterns in the no-load state and under full-load conditions were compared. The results showed that the proposed method considering system deformation accurately calculated the contact state of the gear pair.
| Load Condition | ΔP(μm) | ΔW(μm) | ΔY(μm) | Δ∑(prαd) |
|---|---|---|---|---|
| Forward 20% Full Load | 101.6 | -17.8 | -128.6 | 0.22 |
| Forward 40% Full Load | 191.7 | -31.7 | -236.6 | 0.38 |
| Forward 60% Full Load | 279.8 | -44.9 | -341.3 | 0.51 |
| Forward 80% Full Load | 366.8 | -57.7 | -444.1 | 0.63 |
| Forward 100% Full Load | 453.2 | -70.3 | -545.9 | 0.75 |
| Reverse 20% Full Load | -173.9 | 231.1 | 173.7 | 0.21 |
| Reverse 40% Full Load | -326.6 | 411.4 | 312.2 | 0.49 |
| Reverse 60% Full Load | -475.7 | 583.5 | 445.9 | 0.75 |
3.2 Meshing Efficiency Test
The meshing efficiency of the drive axle system was tested under different operating conditions. The test parameters included vehicle speed, load power, lubrication oil type, and temperature. The power loss components of the drive axle were analyzed . The meshing efficiency was calculated and compared with the theoretical results . The results showed that the meshing efficiency was affected by vehicle speed and load, and the proposed method considering system deformation provided more accurate results.
| Power Loss Component | Description |
|---|---|
| Pg,drαg | Gear churning power loss |
| Pb,drαg | Bearing churning power loss |
| Pg,fric | Gear friction power loss |
| Pb,fric | Bearing friction power loss |
4. Conclusions
This paper proposes a method to calculate the meshing efficiency of hypoid gears in drive axles, considering system deformation. By using the FLTCA method and taking into account gear misalignment and mixed lubrication, the tooth surface load distribution and meshing efficiency can be accurately calculated. Experimental results validate the effectiveness of the proposed method, providing a basis for further gear design optimization.