
Distortion as the binding constraint after carburizing and quenching
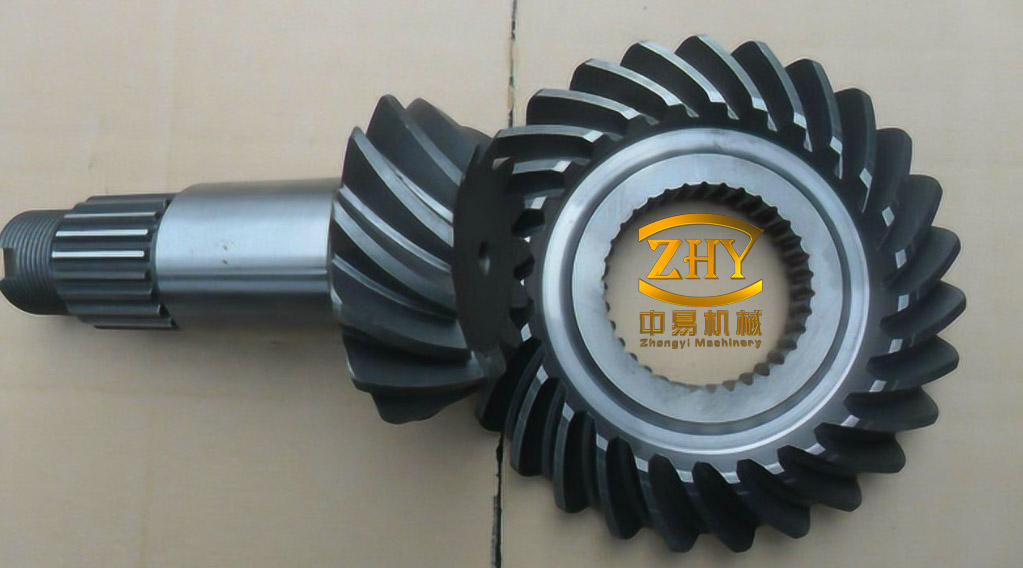
Spiral bevel gears carry high torque in a compact envelope and mesh with gradual, overlapping tooth contact, which is why they dominate the final drives of aircraft, ships and road vehicles. That same load capacity makes the tooth flanks dependent on a hard, carbon-rich surface layer supported by a tough core. Carburizing raises the carbon content of the surface, and the subsequent quench transforms the carbon-enriched austenite into high-carbon martensite, producing surface hardness typically above 60 HRC together with a compressive residual stress state that resists wear and tooth-root fatigue.
The cost of that treatment is dimensional change. Two mechanisms act simultaneously: thermal gradients between surface and core during heating and cooling, and transformation strain as the case and the core transform at different temperatures and to different extents. Because carbon depresses the martensite start and finish temperatures, a high-carbon case transforms later and retains more austenite than the core, and the mismatch expresses itself as a change in tooth geometry. On a spiral bevel gear with a curved flank and a narrow, precisely defined contact pattern, even a few hundredths of a millimeter of flank movement shifts the contact patch toward the toe or heel, raises mesh noise, and can push a finished part out of tolerance after all grinding allowance has been consumed. Distortion is therefore the variable that determines whether a heat-treat schedule is usable, not hardness alone.
For 18Cr2Ni4WA — a high-hardenability Ni–Cr–W carburizing steel with good core toughness — the sensitivity is pronounced, because nickel stabilizes austenite and the case microstructure responds strongly to how much carbon is introduced and how steeply the carbon concentration falls with depth. The five parameters that shape that profile are the carburizing (boost) temperature, the boost-stage carbon potential, the boost-stage duration, the diffusion-stage carbon potential and the diffusion-stage duration. Together they set case depth, surface carbon concentration and the concentration gradient, and hence both the hardness achieved and the distortion incurred. Trial-and-error adjustment of these five variables on production furnaces is slow and expensive, which is what motivates predicting the response numerically before cutting steel.
Gear geometry, material model and thermal boundary conditions
The component analysed is a left-hand spiral bevel gear with module 3 mm, 44 teeth, 20° pressure angle, face width 20.2 mm and addendum coefficient 0.85. Its pitch diameter is 132 mm and outer cone distance 69.73 mm, with a pitch cone angle of 71.1°, a tip cone angle of 73.39° and a root cone angle of 67°. The blank was modelled in the DEFORM finite-element environment, where the material database entry BS655M13 is used for 18Cr2Ni4WA. The discretized model contains 18,218 nodes and 77,031 elements. The bottom face of the gear was constrained to reproduce flat, stacked loading in the furnace, which is the usual production configuration for this part class.
To isolate the carburizing stage, all quench parameters were held constant: an austenitizing/quench temperature of 820 °C, a hold of 1200 s and oil quenching from an oil temperature of 20 °C, with the oil-side heat transfer coefficient taken from published quench-oil data as the thermal boundary condition. Only the five carburizing parameters were varied across the experimental array.
A five-factor, four-level orthogonal simulation array
A full factorial treatment of five factors at four levels would require 1024 simulations. An orthogonal array reduces this to 16 runs while retaining the ability to separate main effects, and the level structure was chosen to bracket the industrially relevant window: 900–930 °C for temperature, 0.75–0.90 % for boost carbon potential, 2.5–4.0 h for boost time, 0.80–0.95 % for diffusion carbon potential and 1.0–2.5 h for diffusion time (Table 1). Factors are labelled A, B, C, E and F; the letter D is reserved for the distortion response and H for surface hardness.
| Level | A: Carburizing temperature (°C) | B: Boost carbon potential (%) | C: Boost time (h) | E: Diffusion carbon potential (%) | F: Diffusion time (h) |
|---|---|---|---|---|---|
| 1 | 900 | 0.75 | 2.50 | 0.80 | 1.00 |
| 2 | 910 | 0.80 | 3.00 | 0.85 | 1.50 |
| 3 | 920 | 0.85 | 3.50 | 0.90 | 2.00 |
| 4 | 930 | 0.90 | 4.00 | 0.95 | 2.50 |
The sixteen simulated schedules and their computed responses are listed in Table 2. Distortion spans 0.0944 mm to 0.1160 mm, a spread of about 23 % relative to the smallest value, whereas surface hardness varies only between 62.3 and 62.8 HRC. The narrow hardness band is itself informative: within this process window the steel is already hard enough, and the practical differentiation between schedules lies almost entirely in the distortion column.
| Run | A (°C) | B (%) | C (h) | E (%) | F (h) | D (mm) | H (HRC) |
|---|---|---|---|---|---|---|---|
| 1 | 900 | 0.75 | 2.50 | 0.80 | 1.00 | 0.0944 | 62.3 |
| 2 | 900 | 0.80 | 3.00 | 0.85 | 1.50 | 0.1030 | 62.7 |
| 3 | 900 | 0.85 | 3.50 | 0.90 | 2.00 | 0.1100 | 62.8 |
| 4 | 900 | 0.90 | 4.00 | 0.95 | 2.50 | 0.1160 | 62.4 |
| 5 | 910 | 0.75 | 3.00 | 0.90 | 2.50 | 0.1090 | 62.7 |
| 6 | 910 | 0.80 | 2.50 | 0.95 | 2.00 | 0.1040 | 62.6 |
| 7 | 910 | 0.85 | 4.00 | 0.80 | 1.50 | 0.1080 | 62.7 |
| 8 | 910 | 0.90 | 3.50 | 0.85 | 1.00 | 0.1040 | 62.7 |
| 9 | 920 | 0.75 | 3.50 | 0.95 | 1.50 | 0.1060 | 62.7 |
| 10 | 920 | 0.80 | 4.00 | 0.90 | 1.00 | 0.1060 | 62.7 |
| 11 | 920 | 0.85 | 2.50 | 0.85 | 2.50 | 0.1070 | 62.7 |
| 12 | 920 | 0.90 | 3.00 | 0.80 | 2.00 | 0.1070 | 62.7 |
| 13 | 930 | 0.75 | 4.00 | 0.85 | 2.00 | 0.1120 | 62.7 |
| 14 | 930 | 0.80 | 3.50 | 0.80 | 2.50 | 0.1120 | 62.7 |
| 15 | 930 | 0.85 | 3.00 | 0.95 | 1.00 | 0.1020 | 62.6 |
| 16 | 930 | 0.90 | 2.50 | 0.90 | 1.50 | 0.1020 | 62.8 |
Entropy-weighted scoring of distortion and hardness
Distortion and hardness are measured in different units and pull in opposite directions, so a single quality index requires normalization, weighting and aggregation. Because lower distortion preserves tooth accuracy and higher hardness extends life, the distortion response is treated as smaller-is-better and hardness as larger-is-better:
$$x_{ij}=\frac{a_{ij}-\min_k a_{ij}^{(k)}}{\max_k a_{ij}^{(k)}-\min_k a_{ij}^{(k)}} \qquad \text{(hardness, larger-is-better)}$$
$$x_{ij}=\frac{\max_k a_{ij}^{(k)}-a_{ij}}{\max_k a_{ij}^{(k)}-\min_k a_{ij}^{(k)}} \qquad \text{(distortion, smaller-is-better)}$$
Objective weights follow from the information entropy of each normalized indicator, corrected by a subjective weight reflecting established heat-treatment priorities:
$$L_{ij}=\frac{x_{ij}}{\sum_{j=1}^{n}x_{ij}},\qquad H_i=-\frac{1}{\ln n}\sum_{j=1}^{n}L_{ij}\ln L_{ij}$$
$$\omega_i=\frac{1-H_i}{m-\sum_{i=1}^{m}H_i},\qquad W_i=\frac{\tau_i\,\omega_i}{\sum_{i=1}^{m}\tau_i\,\omega_i}$$
where \(n=16\) runs, \(m=2\) indicators, \(\tau_i\) is the subjective weight and \(W_i\) the combined weight. The resulting weights are given in Table 3: distortion receives 0.717 and hardness 0.283. The dominance of distortion in the combined index is a direct consequence of the data — hardness varies by only one unit of entropy-relevant range across all sixteen runs, so there is little information for the entropy method to reward.
| Indicator | Entropy \(H_i\) | Objective weight \(\omega_i\) | Subjective weight \(\tau_i\) | Combined weight \(W_i\) |
|---|---|---|---|---|
| Distortion | 0.9447 | 0.6042 | 0.624 | 0.717 |
| Hardness | 0.9638 | 0.3958 | 0.376 | 0.283 |
Per-run memberships \(r_1\) (distortion), \(r_2\) (hardness) and the combined score \(B_j=\sum_i W_i r_{ij}\) are collected in Table 4. Run 1 scores highest (0.7170) because it combines the minimum distortion of the array with a hardness at the lower end of the band, while run 4 scores lowest (0.0566) with the maximum distortion.
| Run | \(r_1\) (distortion) | \(r_2\) (hardness) | \(B_j\) |
|---|---|---|---|
| 1 | 1.0000 | 0.0 | 0.7170 |
| 2 | 0.6019 | 0.8 | 0.6579 |
| 3 | 0.2778 | 1.0 | 0.4822 |
| 4 | 0.0000 | 0.2 | 0.0566 |
| 5 | 0.3241 | 0.8 | 0.4588 |
| 6 | 0.5556 | 0.6 | 0.5681 |
| 7 | 0.3704 | 0.8 | 0.4920 |
| 8 | 0.5556 | 0.8 | 0.6247 |
| 9 | 0.4630 | 0.8 | 0.5583 |
| 10 | 0.4630 | 0.8 | 0.5583 |
| 11 | 0.4167 | 0.8 | 0.5251 |
| 12 | 0.4167 | 0.8 | 0.5251 |
| 13 | 0.1852 | 0.8 | 0.3592 |
| 14 | 0.1852 | 0.8 | 0.3592 |
| 15 | 0.6481 | 0.6 | 0.6345 |
| 16 | 0.6481 | 1.0 | 0.7477 |
Ranking the parameters: time dominates, potential follows
To rank the factors, the combined scores are summed for each level of each factor and normalized so that the four values of a factor add to unity (Table 5). The normalized sum expresses how strongly the presence of a parameter at a given level shifts the combined quality index; the largest value for each factor then serves as that factor’s influence index.
| Factor | Level 1 | Level 2 | Level 3 | Level 4 |
|---|---|---|---|---|
| A: Carburizing temperature | 1.9137 / 0.2299 | 2.1436 / 0.2575 | 2.1670 / 0.2603 | 2.1006 / 0.2523 |
| B: Boost carbon potential | 2.0933 / 0.2515 | 2.1436 / 0.2575 | 2.1338 / 0.2563 | 1.9542 / 0.2347 |
| C: Boost time | 2.5580 / 0.3073 | 2.2764 / 0.2734 | 2.0244 / 0.2432 | 1.4661 / 0.1761 |
| E: Diffusion carbon potential | 2.0933 / 0.2515 | 2.1670 / 0.2603 | 2.2470 / 0.2699 | 1.8176 / 0.2183 |
| F: Diffusion time | 2.5350 / 0.3040 | 2.4560 / 0.2950 | 1.9350 / 0.2320 | 1.4000 / 0.1680 |
Taking the maximum of each row gives the ranking C (0.3073) > F (0.3040) > E (0.2699) > A (0.2603) > B (0.2575): boost time and diffusion time are the dominant factors, diffusion carbon potential is intermediate, and carburizing temperature and boost carbon potential are the weakest of the five within the tested window. The spread between the top and bottom factor is only about 0.05 in normalized units, so the ordering should be read as a graded ranking rather than a sharp separation — the two time variables, however, are clearly ahead of the two potentials and the temperature.
The level-wise ordering changes with level, which is the more useful result for process design. At level 1, boost time (0.3073) and diffusion time (0.3040) outweigh the potentials and temperature, reflecting that early in the cycle the duration of carbon supply controls how fast a high-carbon surface layer forms. At level 2 the diffusion time (0.2950) overtakes the boost time (0.2734), consistent with the diffusion hold becoming the rate-limiting step for carbon transport into the core. At level 3 the ordering inverts again, with diffusion carbon potential (0.2699) leading and temperature (0.2603) second: at this point the carbon-potential schedule governs whether a smooth concentration gradient is maintained. At level 4, temperature (0.2523) becomes dominant, with the two potentials next, because at the longest times and highest potentials the temperature-dependent carbon diffusivity and the thermal gradient of the quench set the final state.
The two extreme responses in Table 2 both occur at the lowest carburizing temperature of 900 °C: run 1, with the shortest times and lowest potentials, gives the smallest distortion (0.0944 mm), while run 4, with the longest times and highest potentials, gives the largest (0.1160 mm). Temperature level alone therefore does not determine distortion; the cumulative carbon flux, which is the product of potential and time, does.
Pairwise interactions and the selected process window
Because the five parameters act on the same carbon profile, their effects are not additive, and a main-effect ranking can miss a combination that performs better than either factor alone. For each of the ten factor pairs, a 4 × 4 joint evaluation matrix was constructed from the four level memberships of the two factors, giving a joint membership for every one of the sixteen level pairings; the pairing with the highest joint membership was retained (Table 6).
| Pair | Best combination | Joint membership |
|---|---|---|
| A and B | A3 with B2 | 0.2575 |
| A and C | A3 with C1 | 0.2603 |
| A and E | A3 with E3 | 0.2603 |
| A and F | A3 with F1 | 0.2603 |
| B and C | B2 with C1 | 0.2575 |
| B and E | B2 with E3 | 0.2575 |
| B and F | B2 with F1 | 0.2575 |
| C and E | C1 with E3 | 0.2699 |
| C and F | C1 with F1 | 0.3045 |
| E and F | E3 with F1 | 0.2699 |
The boost-time/diffusion-time interaction is the strongest (0.3045), followed by diffusion potential combined with either time variable (0.2699). Interactions involving carburizing temperature reach 0.2603 at most, and every interaction with boost carbon potential is limited to 0.2575 — the same value as its own main effect, which indicates that the boost potential contributes little beyond a weak level-setting role in this window. Physically this is plausible: once the surface carbon is high enough to form the required case, raising the boost potential further adds distortion through a steeper gradient without adding useful hardness.
Applying the maximum-membership principle across all five factors simultaneously — taking the level that maximizes each factor’s normalized influence and checking consistency with the pairwise results — gives the combination A3B2C1E3F1: carburizing temperature 920 °C, boost carbon potential 0.80 %, boost time 2.5 h, diffusion carbon potential 0.90 %, diffusion time 1.0 h, with factor memberships 0.2603, 0.2575, 0.3073, 0.2699 and 0.3045. Notably, the optimum uses the shortest boost time and the shortest diffusion time of the array and the second-lowest boost potential, combining a moderately high temperature with a lean, short carbon schedule.
Response-surface models and control simulations
Second-order response equations were fitted by least squares to the sixteen runs, with statistically insignificant terms removed, so that the parameters can be interpolated without further simulation. With A in °C, B and E in %, C and F in hours, distortion D in mm and hardness H in HRC:
$$D = 0.0843 – 0.000153A + 0.0837B – 0.0418C + 0.1702E + 0.007857F – 0.04B^{2} – 0.0009C^{2} – 0.09E^{2} – 0.0004F^{2} + 0.000058AC$$
$$H = -257 + 0.601A + 20.3B + 8.02C + 47.77E + 0.798F – 0.000313A^{2} – 12.5B^{2} – 0.175C^{2} – 27.5E^{2} – 0.225F^{2} – 0.0075AC$$
The distortion model fits the array with \(R^{2}=99.97\,\%\), adjusted \(R^{2}=99.92\,\%\), \(F=1888.02\) and \(P<0.0001\); the hardness model gives \(R^{2}=97.35\,\%\), adjusted \(R^{2}=90.06\,\%\), \(F=13.36\) and \(P<0.0001\). Residuals of both models fall close to the diagonal of the normal probability plot, supporting the assumption of normally distributed error and indicating that the fitted surfaces reproduce the simulated responses closely. The distortion equation carries a positive interaction term in \(AC\), so raising temperature and boost time together increases distortion more than the sum of their separate effects. Substituting the selected combination into the equations returns approximately 0.096 mm and 62.2 HRC, in agreement with the simulated values for that schedule.
Five control simulations were then run against the preferred schedule, changing one factor at a time to test whether the optimum is a genuine local minimum in distortion (Table 7).
| Case | A (°C) | B (%) | C (h) | E (%) | F (h) | D (mm) | H (HRC) |
|---|---|---|---|---|---|---|---|
| Selected | 920 | 0.80 | 2.5 | 0.90 | 1.0 | 0.0966 | 62.6 |
| Control 1 | 930 | 0.80 | 2.5 | 0.90 | 1.0 | 0.0972 | 62.1 |
| Control 2 | 920 | 0.85 | 2.5 | 0.90 | 1.0 | 0.0984 | 61.9 |
| Control 3 | 920 | 0.80 | 3.0 | 0.90 | 1.0 | 0.1020 | 62.2 |
| Control 4 | 920 | 0.80 | 2.5 | 0.85 | 1.0 | 0.0972 | 62.2 |
| Control 5 | 920 | 0.80 | 2.5 | 0.90 | 1.5 | 0.0998 | 62.8 |
The selected combination returns the lowest distortion of the six (0.0966 mm) with a hardness of 62.6 HRC, which is within 0.2 HRC of the highest value in the group. The sensitivity to boost time is the largest of the single-factor perturbations: extending the boost from 2.5 h to 3.0 h raises distortion by 0.0054 mm, over 5 %, for a hardness change of −0.4 HRC. Raising the boost potential from 0.80 % to 0.85 % costs 0.0018 mm and 0.7 HRC, and raising the temperature from 920 °C to 930 °C costs 0.0006 mm and 0.5 HRC. The one perturbation that improves hardness, lengthening the diffusion stage to 1.5 h, adds 0.0032 mm of distortion for +0.2 HRC — a poor exchange given that the gear is already well above the hardness requirement.
Reading the optimum in shop-floor terms
The practical content of the result is that the carbon-supply schedule, not the austenitizing temperature, should be the first lever pulled when a carburized spiral bevel gear distorts. Within 900–930 °C and 0.75–0.90 % boost potential, hardness is effectively saturated at 62–63 HRC, so shortening the boost and diffusion stages buys distortion reduction at almost no cost in surface hardness. For 18Cr2Ni4WA, a lean schedule of 2.5 h boost at 0.80 % and 1.0 h diffusion at 0.90 % at 920 °C is predicted to hold distortion near 0.097 mm while keeping hardness at 62.6 HRC, and the fitted models allow the trade-off to be re-evaluated quickly if a different case depth or a different grinding allowance requires a longer cycle.
Two boundaries on the conclusions deserve emphasis. The responses are computed for a single tooth geometry and a fixed quench — 820 °C, 1200 s, oil at 20 °C, flat stacked loading — so a change in quenching orientation, oil agitation or part size will shift both the absolute distortion and the relative sensitivity of the factors. The verification reported is a set of numerical control simulations rather than furnace trials, and the ranking therefore describes the computed response surface rather than a measured production distribution. The models are best used to narrow the parameter set that must be tested on real parts, which is where the remaining uncertainty in transformation plasticity and in the actual quench-oil heat transfer coefficient can be resolved.