
Accurately calculating the time-varying mesh parameters of hyperbolic gears, commonly known as hypoid gears, is a fundamental prerequisite for conducting rigorous system-level dynamics analysis. The inherent complexity of their geometry—featuring crossed axes, an offset, and curvilinear teeth—results in mesh characteristics that are intrinsically time-dependent. Traditional methods for determining mesh stiffness and excitation often rely on simplifying assumptions that may not capture the full non-linear, multi-tooth contact behavior under load. This paper presents a detailed methodology for precisely calculating these critical time-varying equivalent mesh parameters based on a three-dimensional finite element loaded tooth contact analysis (LTCA).
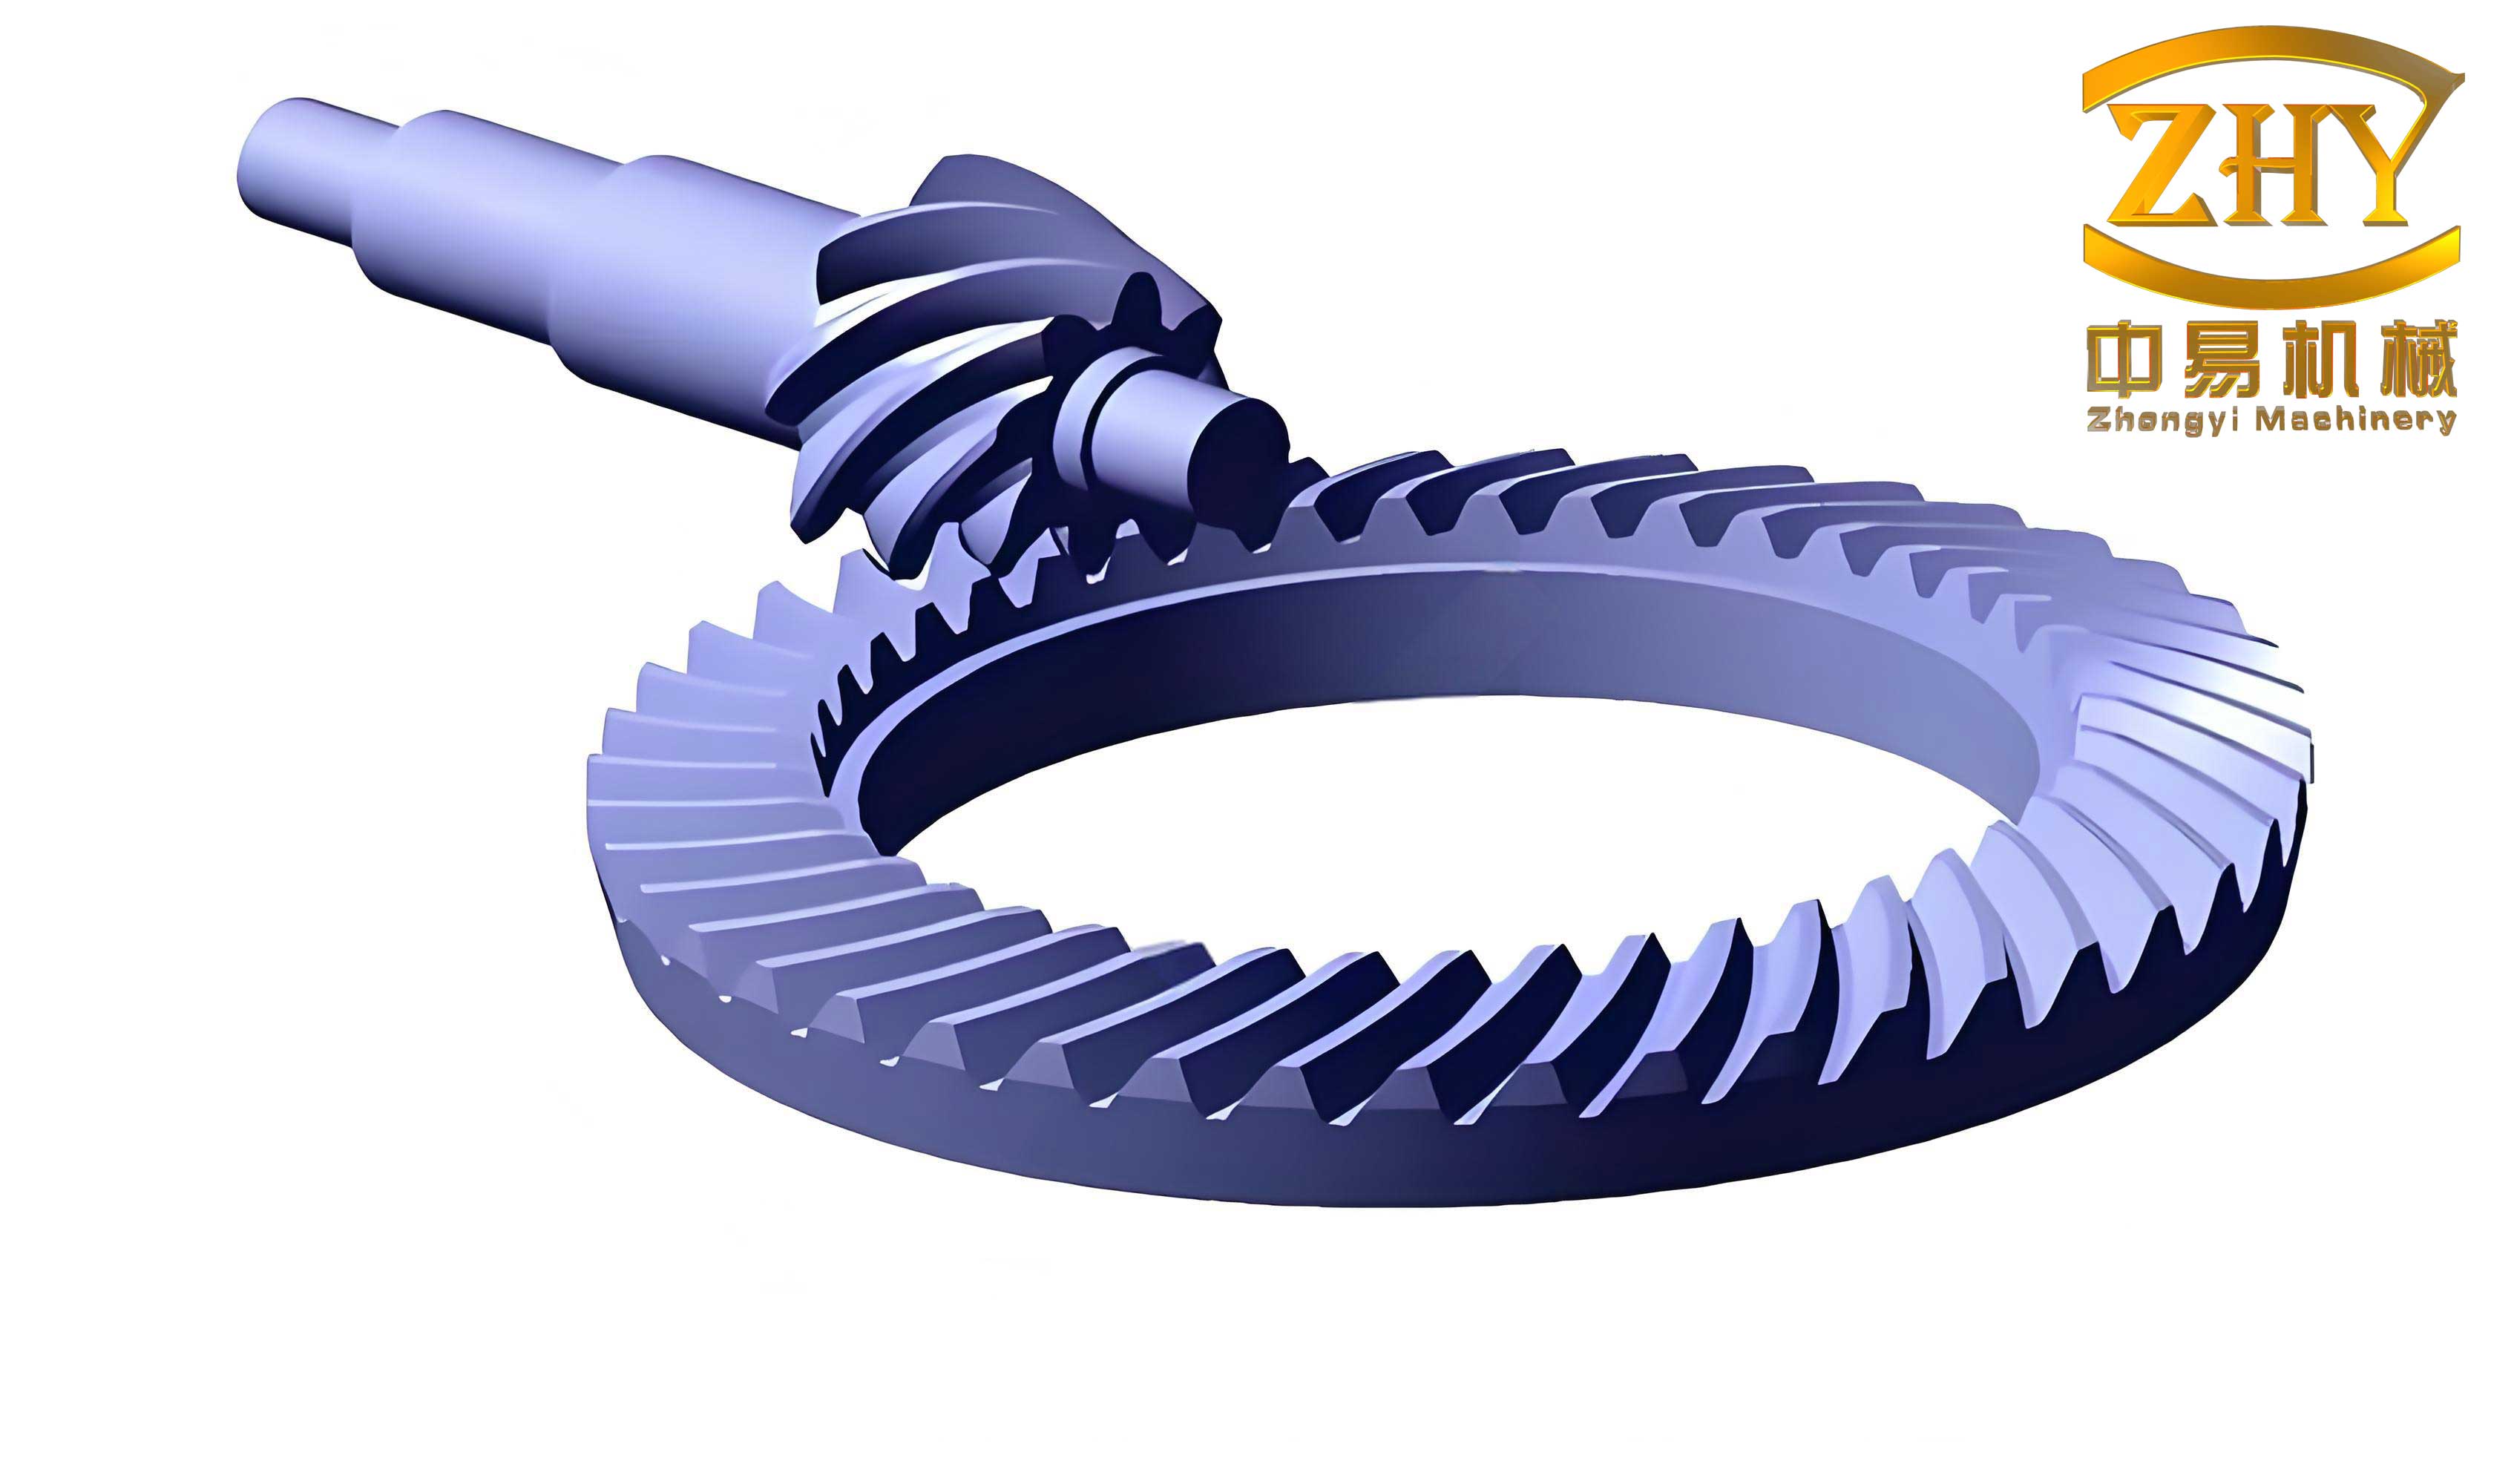
The dynamic modeling of geared systems frequently represents the gear mesh interface as a spring-damper element. The primary source of vibration and noise excitation in this model is the transmission error, which is influenced by the time-varying mesh stiffness. While extensive research exists for parallel-axis spur and helical gears, the analysis of hyperbolic gear pairs, crucial in automotive drive axles, is less common due to their geometrical intricacy. This study addresses this gap by employing a robust finite element framework to simulate the quasi-static loaded啮合 process of a hyperbolic gear pair, thereby extracting high-fidelity data on its瞬变啮合特性.
1. Methodology: Finite Element Modeling and Analysis
The core of this investigation lies in the development and execution of a high-fidelity finite element model capable of simulating the loaded contact between hyperbolic gear teeth. The process encompasses model creation, definition of contact physics, application of realistic boundary conditions and loads, and subsequent parameter extraction.
1.1 Finite Element Model Development
The analysis begins with the geometric definition of the hyperbolic gear pair. The pinion (driver) has 7 teeth and the gear (driven) has 39 teeth, with a significant offset of 26 mm. Key parameters defining the tooth geometry are summarized below.
| Parameter | Pinion (Driver) | Gear (Driven) |
|---|---|---|
| Number of Teeth | 7 | 39 |
| Module (mm) | 10.9 | |
| Face Width (mm) | 64.79 | 61 |
| Pressure Angle (°) | 22.5 | |
| Offset (mm) | 26 | |
| Spiral Angle (°) | 43.85 | 35.84 |
| Hand of Spiral | Left | Right |
Based on the principles of gear generation, the precise coordinates of the tooth surfaces are calculated. These coordinates are used to generate the nodal and elemental data, which is imported into the commercial finite element software ABAQUS. The model employs 8-node linear brick (C3D8) elements with realistic material properties. A five-tooth segment model is constructed to balance computational accuracy and efficiency, capturing the effects of multi-tooth contact during the mesh cycle. The global coordinate system is defined with the pinion axis along the x-direction and the gear axis along the y-direction; the pinion is offset in the positive z-direction.
1.2 Contact Definition, Boundary Conditions, and Load Steps
The simulation setup is designed to replicate the operating conditions of a hyperbolic gear pair in a drive axle under a steady torque load.
| Analysis Step | Description |
|---|---|
| Initial | Fully constrain all degrees of freedom (DOFs) except axial rotation for both pinion and gear body reference points. |
| Step 1 | Constrain the gear rotation. Apply a small rotational displacement to the pinion to initiate tooth contact. |
| Step 2 | Constrain the pinion rotation. Apply a small torque to the gear to establish a stable initial meshing state under minimal load. |
| Step 3 (LTCA) | Apply a prescribed, uniformly varying rotational displacement to the pinion to drive the mesh cycle. Apply a constant torque load to the gear to simulate the operating condition (e.g., 3000 N·m). An implicit, quasi-static analysis is performed. |
Surface-to-surface contact pairs are defined between the concave side of the pinion teeth and the convex side of the gear teeth for all five potential contact pairs. A friction coefficient of 0.1 is specified.
1.3 Model Validation
The accuracy of the finite element model and analysis procedure is paramount. Validation is performed in two stages.
Unloaded Validation (vs. TCA): The unloaded transmission error (UTE) from the finite element analysis (FEA), obtained with a minimal applied torque for numerical stability, is compared against results from classical Tooth Contact Analysis (TCA). The close agreement between the two curves validates the geometric accuracy of the finite element hyperbolic gear model.
Loaded Validation (vs. Experiment): The loaded contact pattern predicted by the FEA under a 3000 N·m load is compared with physical test results from a gear testing apparatus. The location, length, and width of the contact ellipse show excellent correlation, confirming the fidelity of the finite element LTCA in predicting real-world contact behavior under load. This two-tier validation establishes confidence in the subsequent extraction of mesh parameters.
2. Theory: Calculation of Time-Varying Equivalent Mesh Parameters
In a hyperbolic gear pair, multiple tooth pairs can be in contact simultaneously. For dynamic modeling, this complex contact system is often reduced to an equivalent, time-varying mesh model represented by a single spring-damper element acting along a line of action. The parameters of this equivalent element must be derived from the detailed LTCA results. The following methodology details this derivation.
2.1 Time-Varying Equivalent Mesh Force and Line of Action
From the FEA output, for each discrete rotational position (time step), we obtain the contact force vector $\mathbf{f}_i = (f_{ix}, f_{iy}, f_{iz})$ and its application point $\mathbf{r}_i = (r_{ix}, r_{iy}, r_{iz})$ on the $i$-th contacting tooth pair in the global coordinate system.
The total equivalent mesh force vector $\mathbf{F}_m$ for the entire hyperbolic gear pair at that instant is the vector sum of all active contact forces ($N_c$ is the number of contacting pairs):
$$
\mathbf{F}_m = \sum_{i=1}^{N_c} \mathbf{f}_i = (F_x, F_y, F_z)
$$
where
$$ F_x = \sum_{i=1}^{N_c} f_{ix}, \quad F_y = \sum_{i=1}^{N_c} f_{iy}, \quad F_z = \sum_{i=1}^{N_c} f_{iz} $$
The magnitude of the total mesh force is:
$$ F_{\text{total}} = \sqrt{F_x^2 + F_y^2 + F_z^2} $$
The unit vector defining the equivalent line of action $\mathbf{L}_m$ is then:
$$ \mathbf{L}_m = (n_x, n_y, n_z) = \left( \frac{F_x}{F_{\text{total}}}, \frac{F_y}{F_{\text{total}}}, \frac{F_z}{F_{\text{total}}} \right) $$
This direction is critical as it defines the path along which the equivalent spring acts.
2.2 Time-Varying Equivalent Mesh Point
The location of the single equivalent mesh point $\mathbf{R}_m = (x_m, y_m, z_m)$ is found by enforcing force and moment equilibrium. The $x$-coordinate is found from the force-weighted average of application points. The $y_m$ and $z_m$ coordinates are solved using moment balance equations about the global axes:
$$
x_m = \frac{\sum_{i=1}^{N_c} (r_{ix} \cdot |\mathbf{f}_i|)}{\sum_{i=1}^{N_c} |\mathbf{f}_i|}
$$
$$
y_m = \frac{M_z + F_x \cdot z_m}{F_{\text{total}} \cdot n_z}, \quad z_m = \frac{M_y + F_z \cdot x_m}{F_{\text{total}} \cdot n_x}
$$
where $M_y$ and $M_z$ are the net moments of the contact forces about the respective global axes.
2.3 Translational Transmission Error Along the Line of Action
Transmission error is a key excitation source. The FEA provides angular transmission errors under unloaded ($\epsilon_{A0}$) and loaded ($\epsilon_{AL}$) conditions. These must be projected onto the equivalent line of action to obtain the translational transmission error that directly excites the translational degrees of freedom in a lumped-parameter dynamic model.
Let $(x_m^0, z_m^0)$ and $(x_m^L, z_m^L)$ be the equivalent mesh point coordinates under unloaded and loaded conditions, respectively, at the same pinion angle. The translational transmission errors are:
$$
\epsilon_0 = \epsilon_{A0} (z_m^0 n_x – x_m^0 n_z) \quad \text{(Unloaded)}
$$
$$
e_L = \epsilon_{AL} (z_m^L n_x – x_m^L n_z) \quad \text{(Loaded)}
$$
The loaded translational transmission error $e_L$ is the primary dynamic excitation.
2.4 Time-Varying Equivalent Mesh Stiffness: Secant vs. Tangent
The mesh stiffness is a critical parameter. A common but simplistic approach defines a secant stiffness $k_m^n$ as the ratio of the total force to the net deflection along the line of action:
$$
k_m^n = \frac{F_{\text{total}}}{e_L – \epsilon_0}
$$
This formulation, however, ignores the non-linear force-deflection relationship inherent in gear contact. As shown in the conceptual figure below, the true stiffness at an operating point is the tangent stiffness $k_m^t$, representing the local slope of the force-deflection curve:
$$
k_m^t = \frac{dF}{d\delta}
$$
We propose a novel and more accurate method to compute the tangent stiffness for hyperbolic gears using FEA. Three separate LTCA runs are performed for a given mesh position $\theta$: one at the nominal load $T$, and two at perturbed loads $T-\Delta T$ and $T+\Delta T$. The central difference approximation is then used:
$$
k_m^t(\theta) \approx \frac{1}{2} \left[ \frac{F_{\text{total}}^{T} – F_{\text{total}}^{T-\Delta T}}{e_L^{T} – e_L^{T-\Delta T}} + \frac{F_{\text{total}}^{T+\Delta T} – F_{\text{total}}^{T}}{e_L^{T+\Delta T} – e_L^{T}} \right]
$$
where $F_{\text{total}}^{T}$ and $e_L^{T}$ are the total mesh force and loaded translational transmission error at load $T$ and pinion angle $\theta$. This tangent stiffness provides a more physically accurate representation for dynamic simulations.
3. Results and Analysis: A Case Study at 3000 N·m
The developed methodology is applied to analyze a hyperbolic gear pair under a constant gear torque of 3000 N·m. The following sections present the detailed time-varying equivalent mesh parameters over one complete mesh cycle.
3.1 Trajectory of the Equivalent Mesh Point
The equivalent mesh point $\mathbf{R}_m$ does not remain fixed but traces a closed, three-dimensional trajectory near the center of the gear face width as the hyperbolic gear rotates. The variation in its coordinates reveals the nature of contact transition.
The $x$-coordinate shows the most significant variation (several millimeters), corresponding to the movement of the contact zone along the gear’s lengthwise direction (primarily aligned with the global x-axis). The $y$ and $z$ coordinates, representing shifts along the gear axis and the face height direction, respectively, exhibit smaller variations. This confirms that the dominant motion of the contact region is along the tooth length.
3.2 Variation of the Equivalent Line of Action
The direction cosines $(n_x, n_y, n_z)$ of the equivalent line of action $\mathbf{L}_m$ also vary cyclically with the pinion rotation. While the direction remains relatively stable, the small periodic variations in each component are significant for precise dynamic modeling. These variations are directly linked to the changing geometry of the contacting tooth surfaces as the mesh progresses from the root to the tip and across the face width of the hyperbolic gear teeth.
3.3 Loaded Translational Transmission Error
The calculated loaded translational transmission error $e_L$ along the time-varying line of action forms a periodic function with a dominant once-per-mesh (1X) component and higher harmonics. The amplitude and shape of this $e_L$ curve are the primary source of vibration excitation for the hyperbolic gear system at this load condition. Accurate prediction of this curve is essential for noise and vibration analysis.
3.4 Secant vs. Tangent Mesh Stiffness Comparison
Calculating both stiffness definitions for the 3000 N·m case yields crucial insight. The time-varying tangent stiffness $k_m^t$ is consistently and significantly higher than the secant stiffness $k_m^n$ throughout the entire mesh cycle. This finding aligns perfectly with the theoretical expectation based on the non-linear contact mechanics of the hyperbolic gear pair. Using the secant stiffness in a dynamic model would therefore underestimate the true mesh stiffness, potentially leading to inaccurate predictions of system natural frequencies and dynamic response.
4. Influence of Torque Magnitude on Hyperbolic Gear Mesh Characteristics
A comprehensive study was conducted to investigate how the operating torque level influences the time-varying mesh parameters of the hyperbolic gear. Analyses were performed at gear torques of 1000, 2000, 3000, 4500, 6000, and 9000 N·m. The findings are synthesized below.
4.1 Effect on Contact Ratio (Load Sharing)
As torque increases, the teeth deflect more, causing the contact zone to expand and facilitating earlier engagement and later disengagement of adjacent tooth pairs. This increases the contact ratio. The hyperbolic gear transitions from having predominantly 1-2 tooth pairs in contact at lower torques (1000-3000 N·m) to having 2-3 tooth pairs in contact at higher torques (4500-9000 N·m). Higher contact ratio generally leads to smoother load transmission and lower dynamic excitation.
4.2 Effect on Equivalent Mesh Point and Line of Action
Increased load sharing with higher torque stabilizes the mesh. The amplitude of variation in the coordinates of the equivalent mesh point $(x_m, y_m, z_m)$ decreases as torque rises. Similarly, the fluctuation in the direction cosines $(n_x, n_y, n_z)$ of the equivalent line of action diminishes. This indicates a more uniform and stable load distribution across the hyperbolic gear teeth under heavy loads, which is beneficial for reducing vibration.
4.3 Effect on Transmission Error and Mesh Stiffness
The relationship between torque and transmission error/stiffness highlights the system’s non-linearity.
Transmission Error: The magnitude of the loaded translational transmission error $e_L$ increases with torque due to greater elastic deflection of the teeth and supporting structures. However, the increased contact ratio at high load can sometimes modify the waveform.
Mesh Stiffness: Both the average secant stiffness $k_m^n$ and the average tangent stiffness $k_m^t$ increase with applied torque. This is a direct consequence of the non-linear Hertzian contact and the increasing number of load-bearing tooth pairs. Crucially, the tangent stiffness is always markedly higher than the secant stiffness at all torque levels.
A key observation is related to the fluctuation of the tangent stiffness over a mesh cycle. At lower torques (1000-3000 N·m) where the contact ratio is below 2, the stiffness varies sharply as load transfers abruptly between 1 and 2 tooth pairs. At higher torques (4500-9000 N·m) with a contact ratio above 2, the stiffness curve becomes much smoother because at least two tooth pairs share the load at all times, minimizing the sudden changes associated with single-tooth double-pair transitions. This has profound implications for the dynamic response of the hyperbolic gear system.
| Parameter | Trend with Increasing Torque | Primary Reason |
|---|---|---|
| Contact Ratio | Increases | Greater tooth deflection enlarges contact zones. |
| Equivalent Mesh Point Variation | Amplitude Decreases | Improved load sharing stabilizes the effective contact location. |
| Line of Action Variation | Amplitude Decreases | More stable and distributed contact forces. |
| Loaded Transmission Error ($e_L$) | Magnitude Increases | Larger elastic deformations under higher load. |
| Average Mesh Stiffness ($k_m^t$, $k_m^n$) | Increases (rate decreases) | Non-linear contact stiffness and higher contact ratio. |
| Stiffness Fluctuation ($k_m^t$) | Decreases significantly above a threshold torque | Transition from 1-2 to 2-3 tooth pair contact minimizes load transfer shocks. |
5. Conclusion
This paper has presented a robust and detailed finite element-based methodology for the accurate determination of time-varying equivalent mesh parameters in hyperbolic gears. By performing loaded tooth contact analysis (LTCA) within a commercial FEA environment, we have successfully calculated the瞬变啮合特性, including the trajectory of the equivalent mesh point, the direction of the equivalent line of action, the loaded translational transmission error, and—most importantly—the true time-varying tangent mesh stiffness.
The study demonstrates that the traditional secant stiffness formulation underestimates the actual mesh stiffness of hyperbolic gears, and the proposed tangent stiffness calculation method provides a more accurate representation for dynamic analysis. Furthermore, a systematic investigation into the effect of torque magnitude reveals that increasing load enhances the contact ratio, stabilizes the effective mesh location and force direction, increases both transmission error and average mesh stiffness, and, above a certain threshold, significantly smooths the variation in mesh stiffness over a cycle due to sustained multi-pair contact.
The accurate time-varying parameters extracted through this finite element methodology form a vital foundation for building high-fidelity dynamic models of hyperbolic gear systems. These models can be used to predict noise, vibration, and harshness (NVH) performance more reliably and to optimize gear design and manufacturing parameters for improved dynamic behavior. The insights gained into the non-linear load-dependence of hyperbolic gear mesh characteristics are crucial for engineers working on the design and analysis of advanced automotive drivetrains and other power transmission systems utilizing these complex gear types.