
In the realm of heavy-duty machinery, such as marine propulsion systems, aerospace engines, and industrial turbines, the demand for reliable, high-capacity power transmission is paramount. Among various gear types, the herringbone gear stands out due to its exceptional load-bearing capacity, high contact ratio, and reduced noise generation. These attributes make herringbone gears ideal for applications where operational reliability and smooth power transmission are critical. However, the dynamic behavior of herringbone gear systems, particularly in complex configurations like multi-parallel shaft power split transmissions, remains a challenging area of study. Internal excitations, stemming from time-varying mesh stiffness, manufacturing errors, and backlash, can induce vibrations, noise, and uneven load distribution, ultimately affecting system longevity and performance. In this article, I delve into the dynamic analysis of a multi-parallel shaft herringbone gear power split transmission system under internal excitations, employing a time-varying nonlinear dynamic model to quantify vibration responses and provide insights for optimization.
The herringbone gear, characterized by its V-shaped tooth arrangement with opposite helical angles on each half, offers significant advantages over straight or single-helical gears. Its design inherently balances axial forces, minimizes thrust loads on bearings, and enhances meshing smoothness. For multi-parallel shaft configurations, where power is divided across multiple paths to improve torque capacity and redundancy, understanding the dynamic interactions between herringbone gears is crucial. I focus on a system comprising five parallel herringbone gears arranged to split input power into two output streams. This setup is common in high-power transmission systems, but its dynamic characteristics under internal excitations are not fully explored. My goal is to establish a robust dynamic model and analyze key response parameters, such as dynamic transmission error, meshing forces, gear center trajectories, and bearing loads, to identify potential issues like load imbalance between the left and right halves of the herringbone gears.
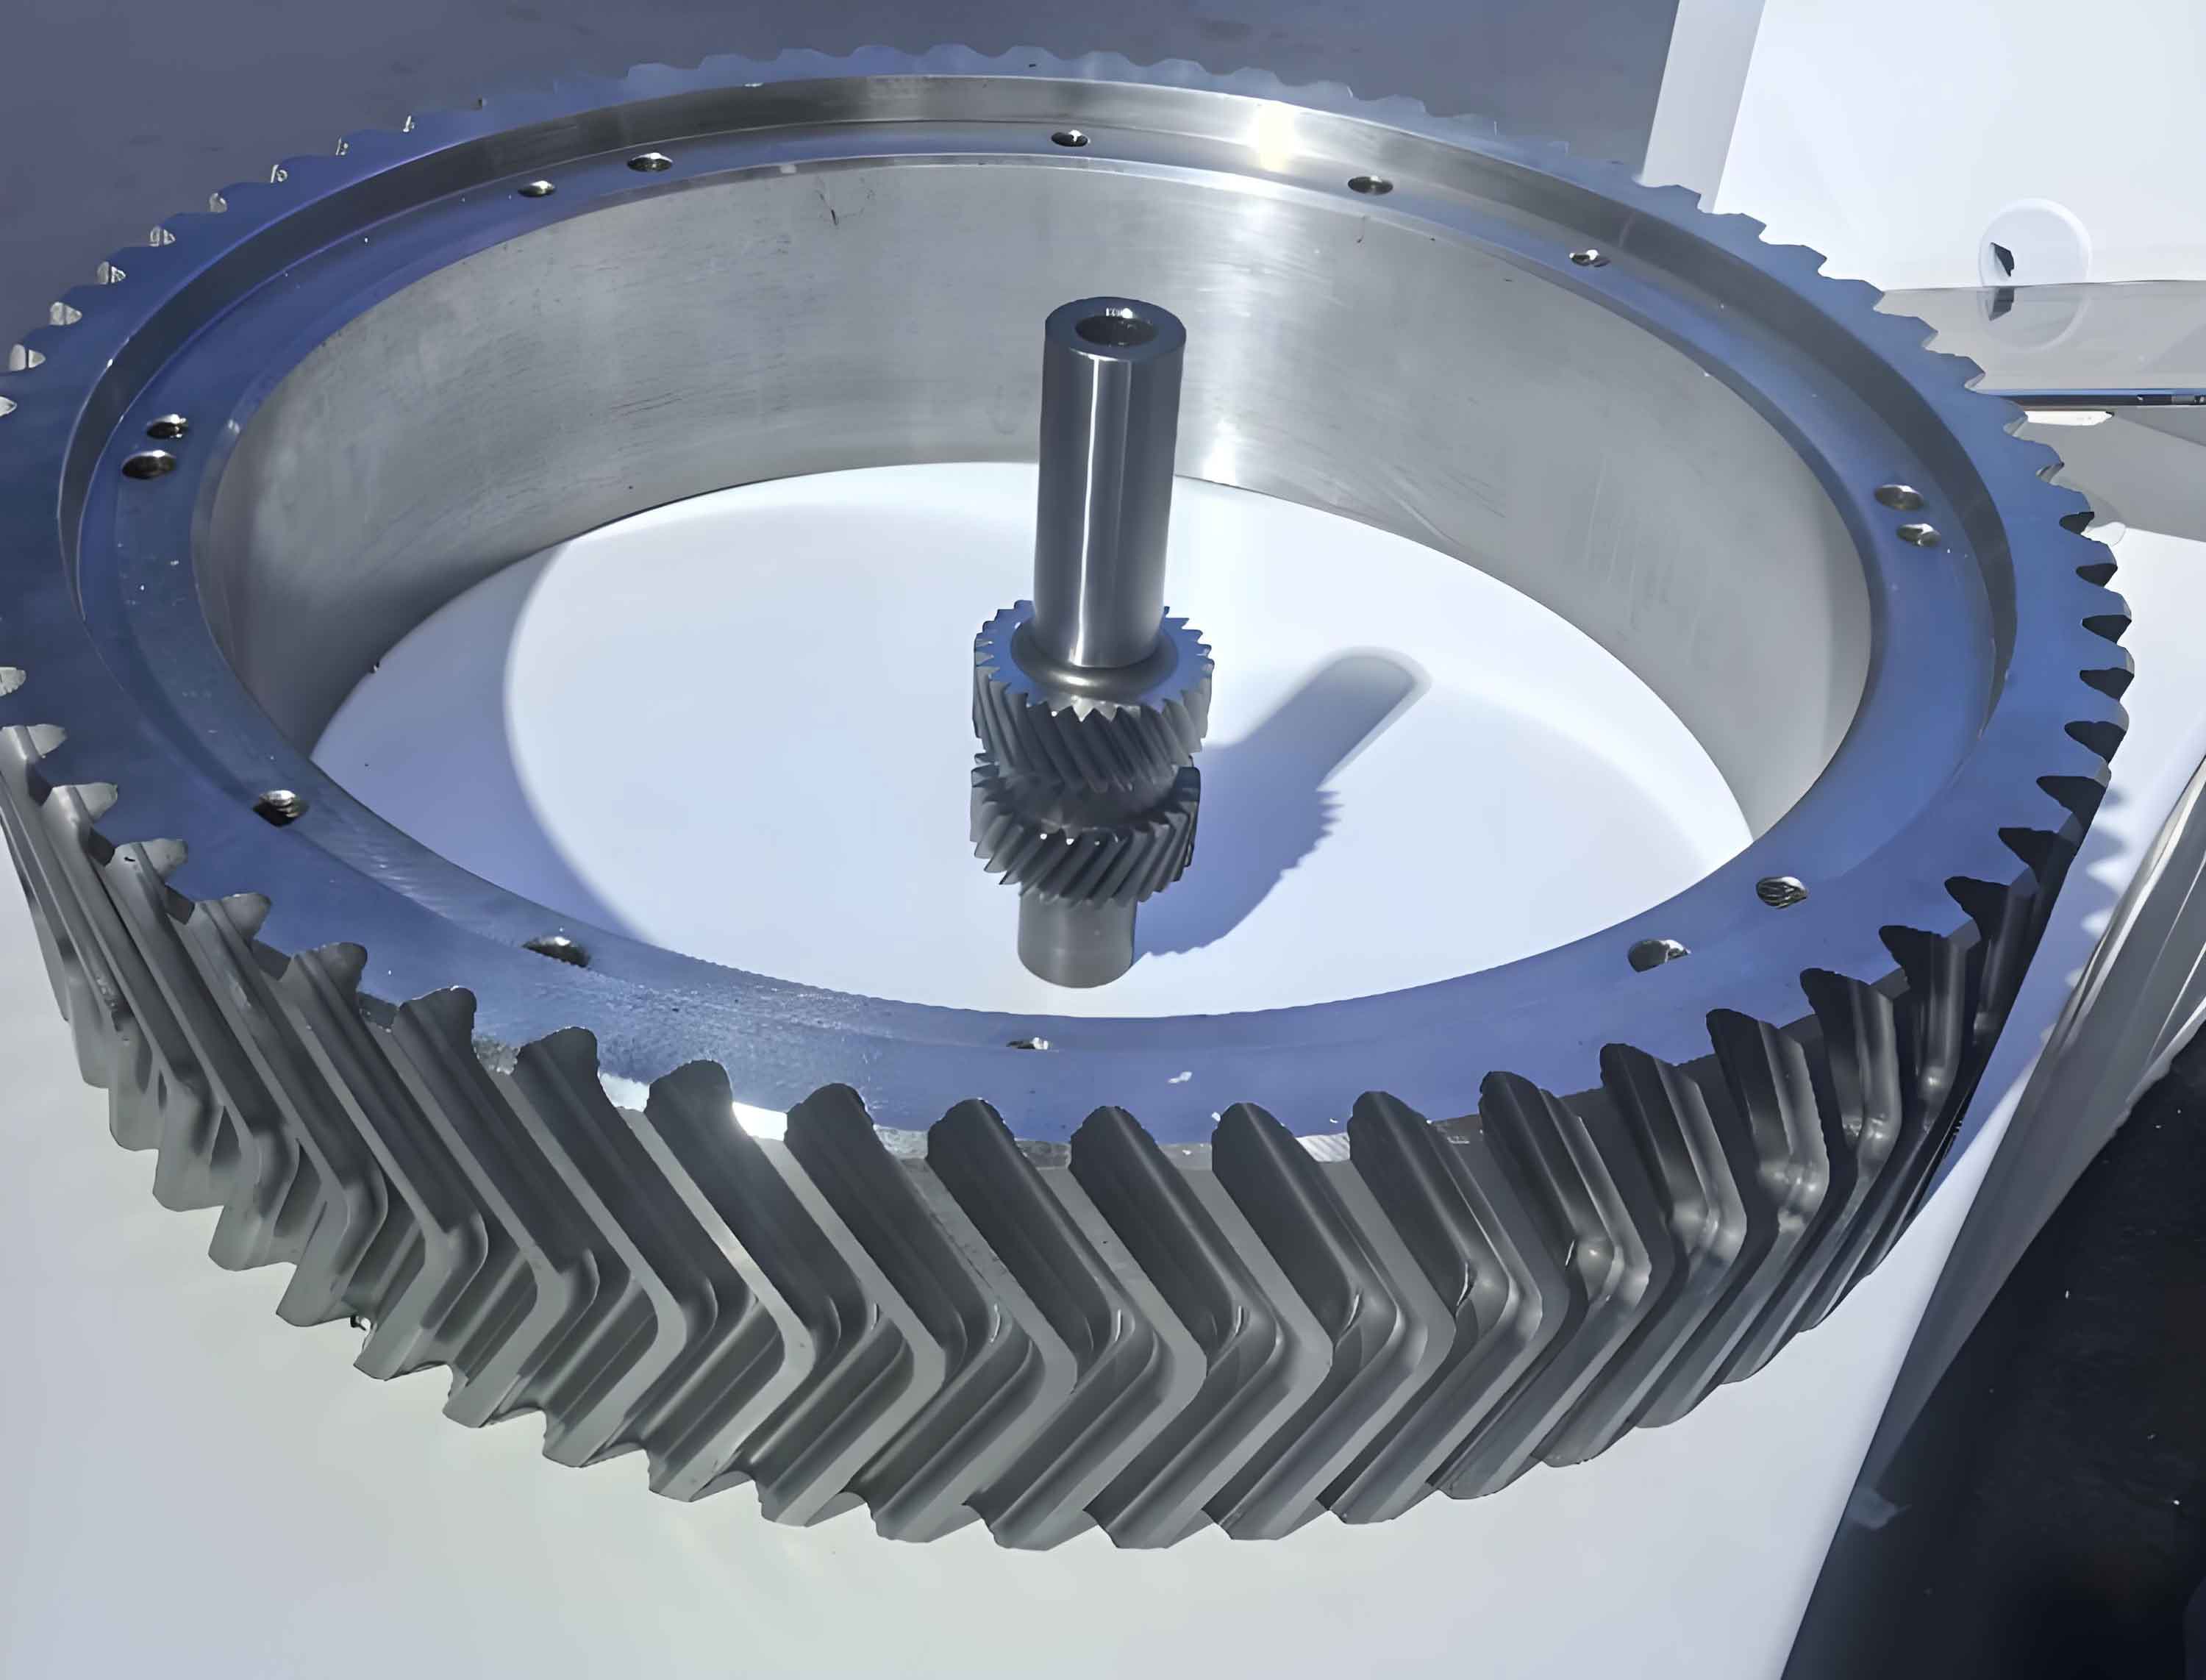
To set the stage, let me outline the structural principles of the herringbone gear power split transmission system. The system consists of five herringbone gears labeled G1 through G5, arranged in a parallel layout. The input power is applied to gear G3, which then distributes it to gears G2 and G4, ultimately transmitting it to output gears G1 and G5. This configuration effectively splits the power into two paths, enhancing system reliability and load distribution. The herringbone gears are designed with specific parameters to ensure efficient operation. Below is a table summarizing the structural parameters of the herringbone gears in the system, which are essential for modeling and analysis.
| Gear Label | Number of Teeth | Module (mm) | Helix Angle (°) | Pressure Angle (°) | Backlash (mm) | Inner Diameter (mm) | Face Width (mm) | Groove Width (mm) |
|---|---|---|---|---|---|---|---|---|
| G1, G5 | 105 | 7 | 29.958 | 20 | 0.47 | 190 | 120 | 80 |
| G2, G4 | 197 | 7 | 29.958 | 20 | 0.47 | 150 | 120 | 80 |
| G3 | 32 | 7 | 29.958 | 20 | 0.47 | 100 | 120 | 80 |
The herringbone gear design splits each gear into left and right halves with opposite helix directions, connected by a flexible shaft represented by the groove width. This split allows for independent dynamic behavior analysis of each half, which is vital for identifying load imbalances. The mesh frequency, a key parameter for internal excitation analysis, is calculated based on the input speed and gear teeth. For this system, with an input speed of 3,000 rpm and gear G3 having 32 teeth, the mesh frequency $$f_m$$ is derived as:
$$f_m = \frac{Z \cdot n}{60}$$
where $$Z$$ is the number of teeth of the driving gear, and $$n$$ is the rotational speed in revolutions per minute. Substituting the values, $$f_m = \frac{32 \times 3000}{60} = 1600 \, \text{Hz}$$. This mesh frequency serves as the fundamental excitation frequency for dynamic analysis. Additionally, the static normal meshing force $$F_n$$ between gear pairs is computed using the transmitted torque $$T$$, pitch diameter $$d$$, pressure angle $$\alpha_n$$, and helix angle $$\beta$$:
$$F_n = \frac{2T}{d \cos(\arctan(\tan \alpha_n / \cos \beta))}$$
For the input herringbone gear pair G3-G4 or G3-G2, with a torque of 3,183 N·m, the static normal force is approximately 6,677 N. These static values provide a baseline for comparing dynamic responses.
Moving to the modeling approach, I developed a time-varying nonlinear dynamic model for the herringbone gear power split transmission system. This model integrates the lumped parameter method, multi-body dynamics, and finite element analysis to capture the complex interactions. Each herringbone gear is decomposed into two helical gear halves with opposite helix directions, connected by a flexible shaft element that accounts for axial compliance. The gear teeth are modeled using lumped parameters, where the meshing action is represented by time-varying spring elements with stiffness equal to the instantaneous mesh stiffness. The gear bodies are treated as rigid components attached to shafts, and bearings are simplified as massless spring-damper elements to support radial and axial motions.
The time-varying mesh stiffness is a critical internal excitation source in herringbone gear dynamics. I calculated it based on the ISO 6336-6 standard, considering bending, shear, compression, fillet foundation, and contact deformations across different meshing positions. For a herringbone gear pair, the mesh stiffness varies cyclically due to the alternating single- and double-tooth contact regions. The stiffness function $$k_m(t)$$ for each gear pair is derived as a periodic function with the mesh frequency. Below is a table summarizing the peak-to-peak variations in time-varying mesh stiffness for different herringbone gear pairs in the system, which highlights the dynamic nature of the meshing process.
| Gear Pair | Average Stiffness (N/m) | Stiffness Fluctuation Range (N/m) | Primary Frequency Component (Hz) |
|---|---|---|---|
| G1-G2 | 8.5 × 10^8 | 1.2 × 10^8 | 1600 |
| G2-G3 | 9.1 × 10^8 | 1.5 × 10^8 | 1600 |
| G3-G4 | 9.1 × 10^8 | 1.5 × 10^8 | 1600 |
| G4-G5 | 8.5 × 10^8 | 1.2 × 10^8 | 1600 |
The nonlinearities in the system arise primarily from gear backlash, which I incorporated as a piecewise linear function. The dynamic equations of motion for each gear half include degrees of freedom for translational and rotational motions. For a herringbone gear half $$i$$, the equations can be expressed as:
$$m_i \ddot{x}_i + c_{xi} \dot{x}_i + k_{xi} x_i = F_{mx,i}$$
$$m_i \ddot{y}_i + c_{yi} \dot{y}_i + k_{yi} y_i = F_{my,i}$$
$$I_i \ddot{\theta}_i + c_{\theta i} \dot{\theta}_i + k_{\theta i} \theta_i = T_i – r_i F_{mt,i}$$
where $$m_i$$ and $$I_i$$ are the mass and moment of inertia, $$c$$ and $$k$$ are damping and stiffness coefficients, $$F_{mx,i}$$, $$F_{my,i}$$, and $$F_{mt,i}$$ are meshing forces in translational and tangential directions, $$T_i$$ is the external torque, and $$r_i$$ is the base circle radius. The meshing force between gear halves $$i$$ and $$j$$ is modeled as:
$$F_m = k_m(t) \cdot \delta + c_m \cdot \dot{\delta}$$
where $$\delta$$ is the relative displacement between meshing teeth, incorporating backlash nonlinearity. I solved these equations numerically using a time-step integration method to simulate the dynamic response under internal excitations, with parameters set for a typical operating condition: input speed of 3,000 rpm and input torque of 3,183 N·m.
Now, let me present the dynamic characteristics analyzed from the model, starting with dynamic transmission error (DTE). DTE is a key indicator of transmission smoothness, defined as the difference in rotational displacement between meshing gears relative to their base circles. For a herringbone gear pair, DTE is computed separately for the left and right halves to assess imbalances. The formula for DTE between gear $$i$$ and $$j$$ is:
$$\text{DTE} = r_i \theta_i – r_j \theta_j$$
where $$\theta_i$$ and $$\theta_j$$ are the torsional vibrations. I calculated DTE for all herringbone gear pairs in the system, and the results show periodic fluctuations with the mesh frequency and its sidebands. The table below summarizes the DTE fluctuations for each gear pair, highlighting the differences between left and right halves.
| Gear Pair | Half | DTE Fluctuation Amplitude (μm) | Total DTE Range (μm) | Dominant Frequency (Hz) |
|---|---|---|---|---|
| G1-G2 | Left | 0.32 | 6.49 | 1600, 16 |
| Right | 0.33 | 1600, 16 | ||
| G2-G3 | Left | 0.94 | 6.49 | 1600, 16 |
| Right | 0.92 | 1600, 16 | ||
| G3-G4 | Left | 0.47 | 6.49 | 1600, 16 |
| Right | 1.60 | 1600, 16 | ||
| G4-G5 | Left | 0.95 | 6.49 | 1600, 16 |
| Right | 0.96 | 1600, 16 |
The data reveals that the highest DTE fluctuation occurs in the right half of the G3-G4 herringbone gear pair, at 1.60 μm, indicating significant vibrational excitation. Additionally, sidebands at approximately 16 Hz (calculated as $$f_m / Z_1$$, where $$Z_1 = 105$$ for gear G1) are present across all pairs, which can contribute to noise and wear. This underscores the importance of considering both halves of herringbone gears in dynamic analysis, as imbalances can lead to localized stress concentrations.
Next, I examined the dynamic meshing forces in the herringbone gear system. These forces reflect the actual loads experienced by gear teeth during operation and are influenced by time-varying stiffness and backlash. I computed the meshing forces for all gear pairs, differentiating between left and right halves. Due to symmetry, pairs G1-G2 and G4-G5 exhibit similar force profiles, as do pairs G2-G3 and G3-G4. However, a notable load imbalance is observed between the left and right halves of each herringbone gear, with the left half (closer to the input side) generally experiencing higher forces. The table below details the meshing force fluctuations for each gear pair.
| Gear Pair | Half | Meshing Force Fluctuation Amplitude (N) | Average Meshing Force (N) | Peak Force (N) |
|---|---|---|---|---|
| G1-G2 | Left | 478 | 7,298 | 7,776 |
| Right | 458 | 7,756 | ||
| G2-G3 | Left | 1,371 | 7,298 | 8,669 |
| Right | 1,377 | 8,675 | ||
| G3-G4 | Left | 1,403 | 7,298 | 8,701 |
| Right | 1,296 | 8,594 | ||
| G4-G5 | Left | 455 | 7,298 | 7,753 |
| Right | 460 | 7,758 |
The largest fluctuations occur in gear pairs involving G3, with amplitudes around 1,400 N, suggesting that the input herringbone gear is subjected to the most severe dynamic loads. This imbalance between halves can lead to uneven wear and reduced fatigue life, emphasizing the need for design modifications such as tooth profile modifications or optimized backlash settings. The dynamic meshing force $$F_{m,dyn}$$ can be related to the static force $$F_n$$ and dynamic factor $$K_v$$ as:
$$F_{m,dyn} = K_v \cdot F_n$$
where $$K_v$$ is influenced by system dynamics and internal excitations. For this herringbone gear system, $$K_v$$ values range from 1.05 to 1.18, indicating significant dynamic amplification.
Another critical aspect is the center motion trajectory of each herringbone gear half, which reflects the vibrational patterns in the transverse plane. I plotted the trajectories for all gears, revealing distinct behaviors between left and right halves. Gear G1 and G5 show the largest deviations between halves, with the left half of G1 exhibiting a trajectory deviation of up to 0.8 μm, though the paths remain roughly circular. In contrast, gear G3 displays erratic, scattered trajectories within an approximate circle, signifying pronounced vibrations. This is quantified in the table below, which lists the maximum radial displacement for each gear half.
| Gear Label | Half | Maximum Radial Displacement (μm) | Trajectory Shape | Primary Frequency Components (Hz) |
|---|---|---|---|---|
| G1 | Left | 0.8 | Near-circular | 1600, 16 |
| Right | 0.6 | Near-circular | 1600, 16 | |
| G2 | Left | 0.5 | Elliptical | 1600, 16 |
| Right | 0.5 | Elliptical | 1600, 16 | |
| G3 | Left | 1.2 | Scattered | 1600, 16, 48 |
| Right | 1.1 | Scattered | 1600, 16, 48 | |
| G4 | Left | 0.5 | Elliptical | 1600, 16 |
| Right | 0.5 | Elliptical | 1600, 16 | |
| G5 | Left | 0.6 | Near-circular | 1600, 16 |
| Right | 0.8 | Near-circular | 1600, 16 |
The trajectories are influenced by meshing forces and bearing supports, and the scattered pattern for G3 correlates with its higher dynamic loads. This analysis highlights that even in symmetrically designed herringbone gear systems, dynamic effects can lead to asymmetric motions, potentially causing misalignment and increased noise.
Bearing forces are crucial for assessing system reliability, as they transmit loads from gears to the housing. I computed both radial and axial bearing forces for all herringbone gears. The radial forces show mean values that vary between left and right bearings, with gears G1 and G5 having higher forces on the right side, while G2, G3, and G4 exhibit balanced radial loads. However, dynamic fluctuations are present, particularly at the mesh frequency and its sidebands. For instance, gear G2’s radial force fluctuates with an amplitude of 50 N at 16 Hz. The table below summarizes the mean radial bearing forces for each gear.
| Gear Label | Bearing Location | Mean Radial Force in Y-direction (N) | Mean Radial Force in Z-direction (N) | Total Mean Radial Force (N) |
|---|---|---|---|---|
| G1 | Left | -2,020 | -10,625 | 10,825 |
| Right | -3,150 | -16,525 | 16,825 | |
| G2 | Left | 450 | -10,900 | 10,950 |
| Right | -450 | -11,100 | 11,150 | |
| G3 | Left | 0 | -700 | 700 |
| Right | 0 | -700 | 700 | |
| G4 | Left | -450 | -35,750 | 35,775 |
| Right | 450 | -35,550 | 35,575 | |
| G5 | Left | 2,020 | -750 | 2,170 |
| Right | 3,150 | -1,775 | 3,625 |
Axial bearing forces, though generally smaller than radial forces, are significant due to the helical nature of herringbone gears. The axial force $$F_a$$ for a gear half can be estimated from the tangential force $$F_t$$ and helix angle $$\beta$$:
$$F_a = F_t \cdot \tan \beta$$
In this system, the input gear G3 experiences the highest axial forces, with a difference of about 30 N between left and right bearings, aligning with the observed meshing force imbalance. The dynamic axial forces exhibit fluctuations at the mesh frequency, contributing to bearing wear and vibration. The overall bearing load analysis confirms that herringbone gear systems, while designed to cancel axial thrust, still experience residual dynamic forces that require careful consideration in bearing selection and housing design.
To synthesize the findings, I derived several key equations that encapsulate the dynamic behavior. The overall dynamic response can be characterized by a dimensionless parameter $$\Gamma$$, defined as the ratio of dynamic meshing force fluctuation to static meshing force:
$$\Gamma = \frac{\Delta F_{m,dyn}}{F_n}$$
For this herringbone gear system, $$\Gamma$$ ranges from 0.07 to 0.21, with the highest values for gears involving G3. Additionally, the vibration energy $$E_v$$ per meshing cycle can be approximated as:
$$E_v = \frac{1}{2} \sum_{i} m_i \dot{x}_i^2 + \frac{1}{2} I_i \dot{\theta}_i^2$$
where the summation is over all gear halves. This energy peaks at the mesh frequency and its harmonics, indicating regions of potential resonance that could be mitigated through damping enhancements or stiffness tuning.
In conclusion, my dynamic analysis of a multi-parallel shaft herringbone gear power split transmission system under internal excitations reveals critical insights into vibration and load distribution. The time-varying nonlinear model, integrating lumped parameters, multi-body dynamics, and finite element concepts, effectively captures the complex interactions within herringbone gears. Key findings include significant load imbalances between the left and right halves of herringbone gears, particularly for the input gear, leading to elevated dynamic transmission errors, meshing force fluctuations, and asymmetric center motions. These imbalances are primary sources of vibration and noise, with sideband frequencies exacerbating the effects. Bearing forces, both radial and axial, show dynamic variations that could impact system longevity. This study underscores the necessity of considering both halves of herringbone gears in design and analysis, as well as the value of dynamic modeling for optimizing performance. Future work could explore tooth profile modifications, backlash adjustments, or damping strategies to mitigate these issues, ultimately enhancing the reliability of herringbone gear systems in high-power applications. The methodologies and results presented here provide a foundation for further research and development in advanced gear dynamics.