
The reliable and quiet operation of heavy-duty gear reducers is paramount in industrial applications such as construction hoists. A primary source of vibration and noise in these systems is non-uniform load distribution across the tooth face of the gears, a phenomenon known as bias loading. This uneven loading often stems from a combination of elastic deflections under load, manufacturing inaccuracies, and assembly errors. For hard-faced helical gears, which exhibit minimal run-in wear, the elastic deformations are often insufficient to compensate for these initial imperfections, leading to concentrated edge stresses, reduced load capacity, and increased dynamic excitation.
The most effective countermeasure is strategic gear micro-geometry modification, or “tooth flank modification.” This involves deliberately and precisely removing minute amounts of material from the theoretical tooth surface to pre-compensate for the expected deformations and errors, thereby promoting uniform load distribution under operating conditions. This article presents a systematic methodology for optimizing the tooth surface modification of a helical gear pair from a construction hoist reducer. The approach integrates theoretical calculations to establish modification bounds with a full-factorial Design of Experiments (DoE) optimization within a specialized gear analysis platform. The goal is to minimize load concentration and improve the dynamic performance of the transmission system.
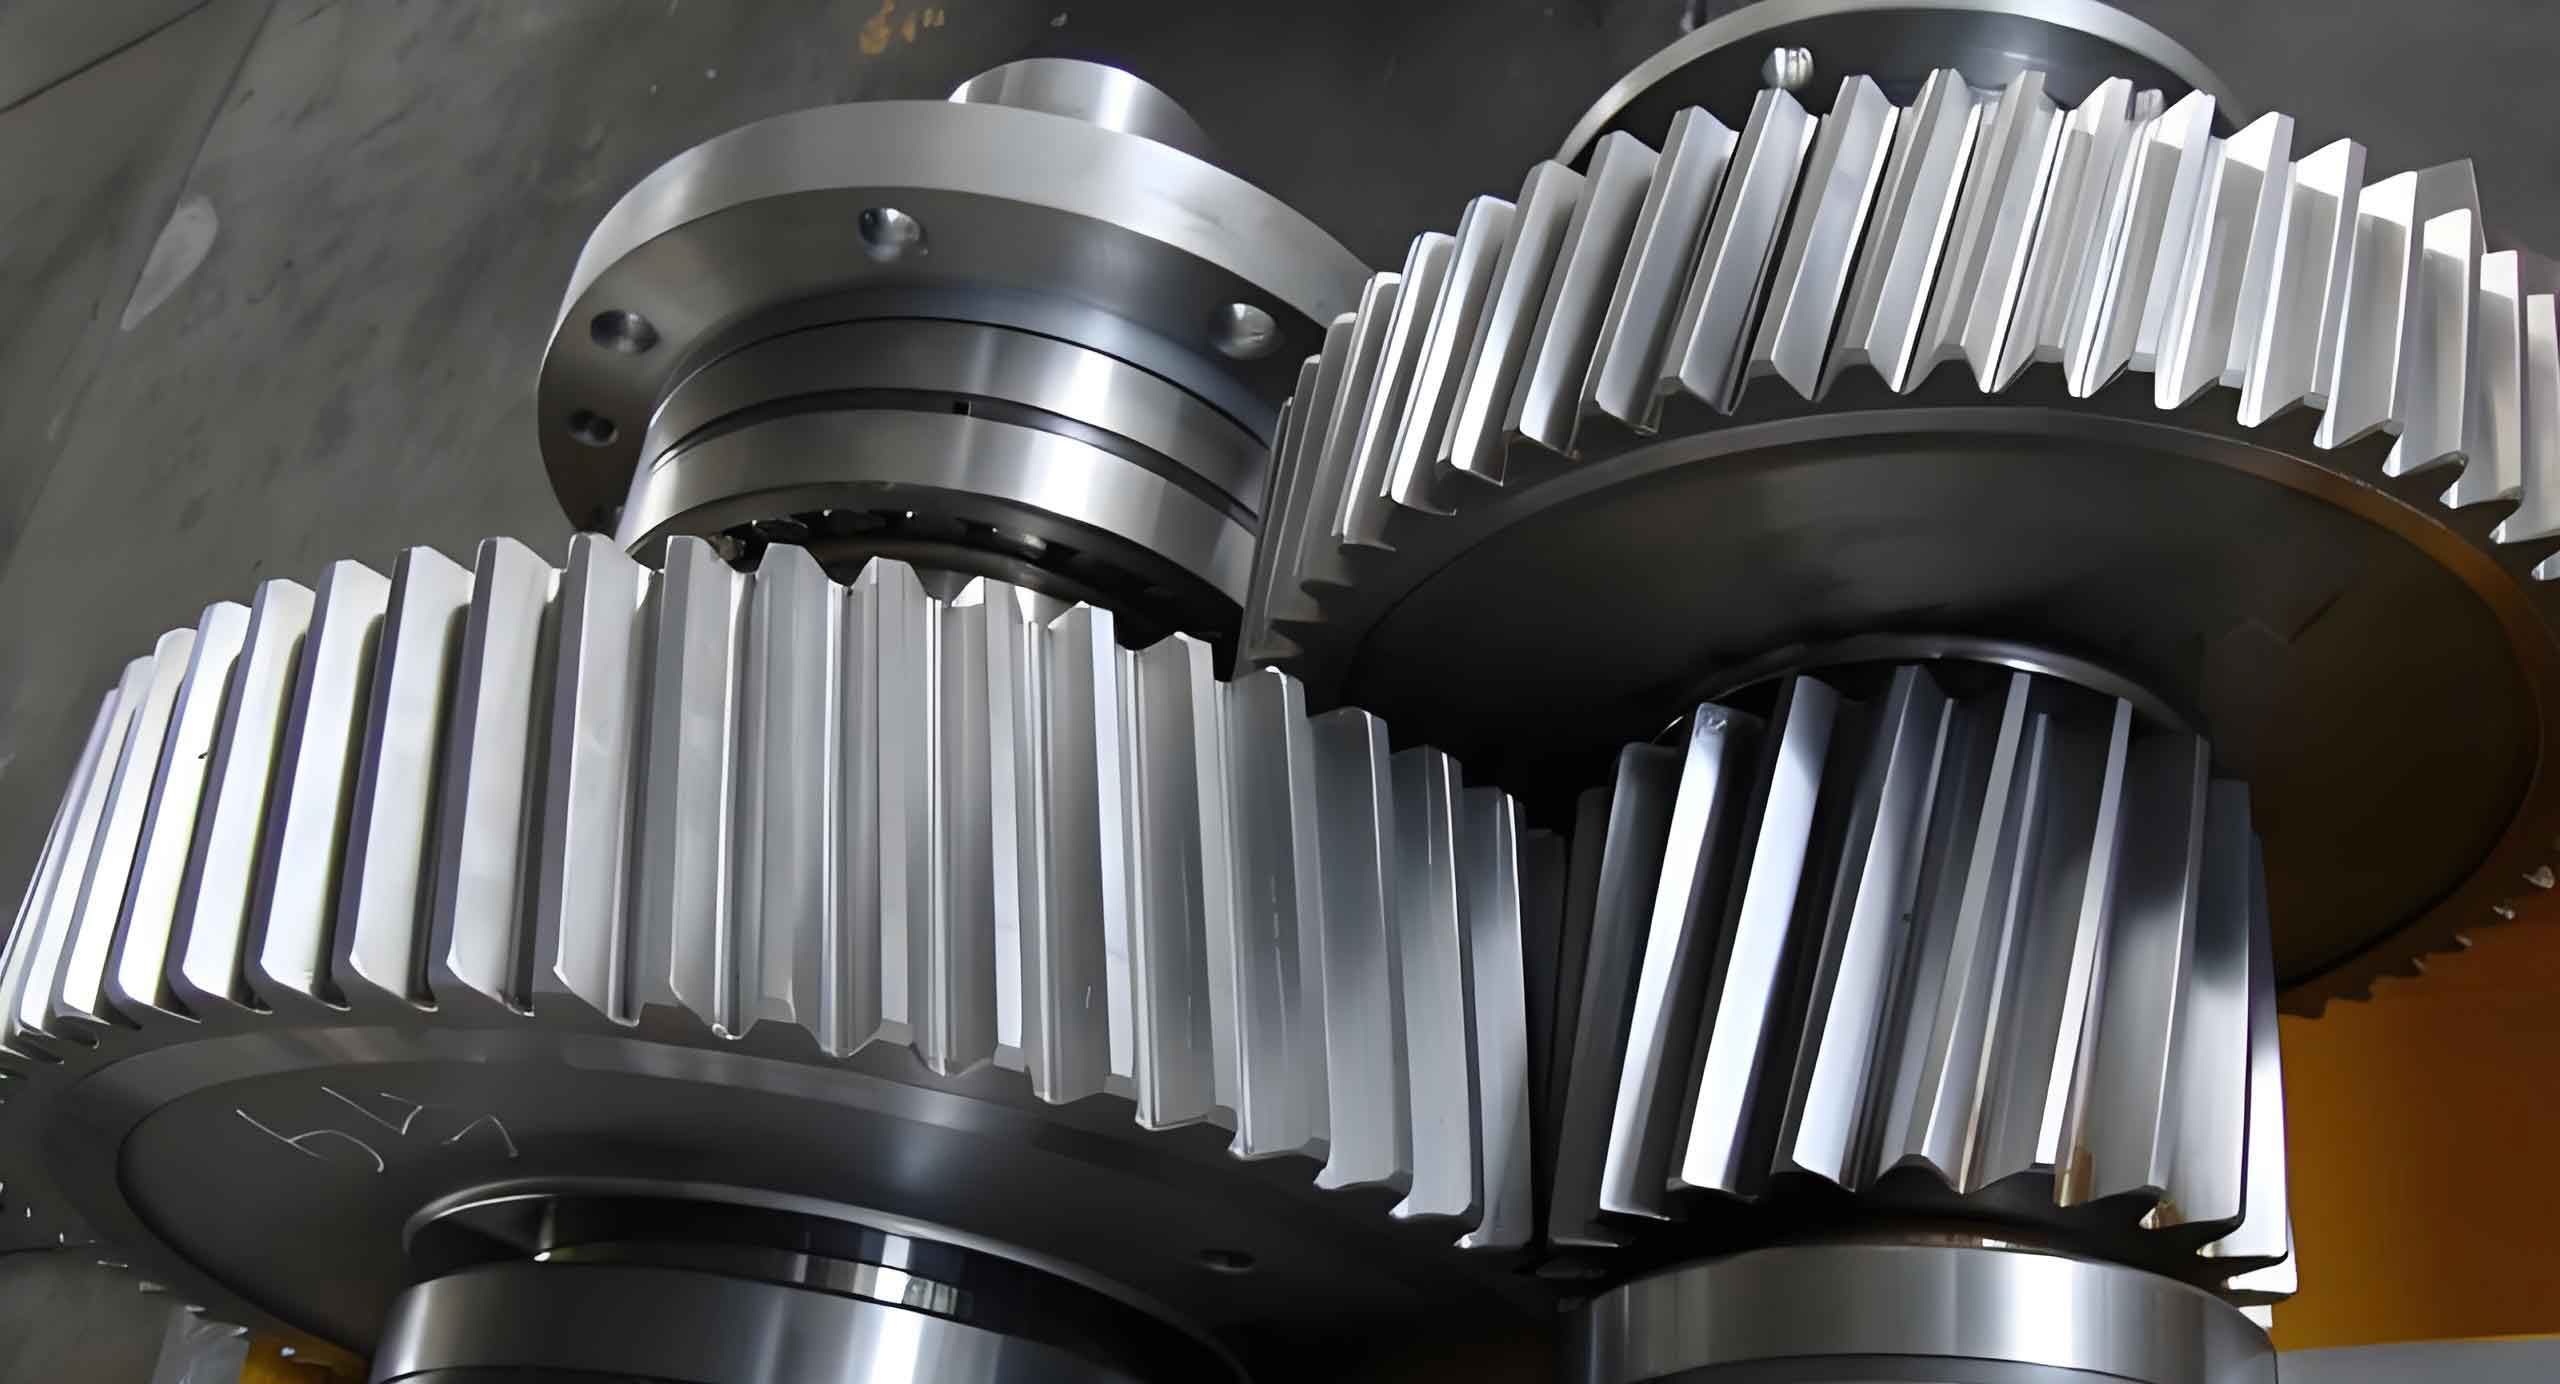
Helical gears are favored in such applications for their smoother, quieter operation compared to spur gears due to gradual tooth engagement. However, their inclined tooth profile also introduces complexities in load distribution along the face width. The following analysis focuses on the output stage helical gear pair of a three-stage reduction gearbox. The primary objective is to determine the optimal combination of lead crowning, lead slope (helix correction), and tip relief modifications.
Parametric Model and System Specifications
A detailed parametric model of the complete gear transmission system was constructed in a dedicated gear design and analysis software. This model accurately represents the three-dimensional geometry, shafting, bearings, and housing constraints. The focus helical gear pair operates at a significant torque level, transmitting power from a pinion to a large output gear. The key macro-geometric parameters for this critical helical gear pair are summarized in the table below.
| Macro-Geometric Parameter | Pinion | Gear |
|---|---|---|
| Number of Teeth, z | 22 | 73 |
| Normal Module, m_n (mm) | 2.5 | 2.5 |
| Normal Pressure Angle, α_n (°) | 20 | 20 |
| Profile Shift Coefficient, x | 0.29 | 0.17 |
| Helix Angle at Pitch Cylinder, β (°) | 16.523 | 16.523 |
| Face Width, b (mm) | 64 | 60 |
| Center Distance, a (mm) | 125 | 125 |
| Hand of Helix | Right | Left |
Theoretical Determination of Maximum Modification Limits
Before optimization, it is essential to establish reasonable bounds for each modification type based on theoretical calculations of the expected system deflections and permissible errors. This prevents the optimization from searching unrealistic regions and provides a physics-based starting point.
Lead Crowning Modification
Lead crowning, a barrel-shaped modification along the face width, compensates for misalignments that cause edge-loading. The total effective misalignment, $F_{\beta y}$, is a composite of errors from manufacturing/assembly ($f_{ma}$) and elastic deflections ($f_{sh}$). For hard-faced gears, the run-in effective misalignment can be estimated as:
$$ F_{\beta y} = 0.85(1.33 f_{sh} + f_{ma}) $$
where $f_{ma} = 0.5 F_{\beta 8}$, with $F_{\beta 8}$ being the allowable total helix deviation for an ISO Grade 8 gear. The deflection-induced error is proportional to load: $f_{sh} = (F_m / b) f_{sh0}$, with $f_{sh0}$ being the misalignment per unit load. The maximum recommended crowning amount, $C_a$, must compensate for half of this misalignment plus the contact deformation:
$$ C_a = 0.5 F_{\beta y} + \frac{F_m}{C_{\gamma} b} $$
Here, $F_m = F_t K_A K_V$ is the mean transverse tooth load considering application ($K_A$) and dynamic ($K_V$) factors. $C_{\gamma}$ represents the average mesh stiffness, derived from finite element analysis for this specific helical gear pair. Calculations based on the system parameters yield a theoretical maximum crowning amount of approximately 20.8 µm. The lower bound is logically set to 0 µm, as the errors may ideally cancel out.
Lead Slope (Helix Correction) Modification
Lead slope modification compensates for systematic helix angle errors caused by shaft bending and torsional wind-up under load. The pinion shaft, being more flexible than the large gear, is the primary contributor. The combined bending and torsional deformation along the pinion’s face width must be calculated.
The bending deflection, $\sigma_b$, at a distance along the face width can be approximated by:
$$ \sigma_b = \frac{2}{E \pi} \left( \frac{\omega}{b d} \right) \left( \frac{L}{4} – \frac{7b}{12} \right) $$
The torsional deflection, $\sigma_t$, is given by:
$$ \sigma_t = \frac{4}{G \pi} \left( \frac{\omega}{b d^2} \right) $$
where $\omega$ is the load per unit face width, $E$ is Young’s modulus, $G$ is the shear modulus, $d$ is the pinion pitch diameter, and $L$ is the shaft span. The vector sum of these deformations along the face width produces a deformation curve. The lead slope modification profile is essentially the mirror image of this curve, with the maximum modification value equal to the maximum calculated deflection at one end of the pinion face. For this helical gear set, analysis yielded a maximum deflection of 47 µm at the driven end and a minimum of 20 µm at the other, establishing the range for lead slope optimization.
Profile (Tip Relief) Modification
Tip relief modifies the tooth profile near the tip to mitigate transmission error (TE) spikes caused by mesh stiffness variations and base pitch errors at the start and end of single-tooth contact. The required relief amount, $\delta_a$, must compensate for elastic deflection under load and manufacturing inaccuracies.
The deflection under load is: $\delta_a = \omega_t / C_{\gamma}$, where $\omega_t$ is the unit load normal to the tooth flank. The contribution from manufacturing errors, $\Delta_m$, combines base pitch error ($f_{pb}$) and profile form error ($f_f$): $\Delta_m = f_{pb} + \frac{1}{3}f_f$. The theoretical maximum tip relief is the sum, assuming errors and deflections are additive:
$$ \delta_{max} = \delta_a + \Delta_m $$
Calculations for this helical gear pair indicated a maximum relief of approximately 28.8 µm. A parabolic relief curve starting at the highest point of single tooth contact (HPSTC) is typically applied. The lower bound is again 0 µm. To protect the root fillet of the driven gear, relief is applied only to the tips of both the pinion and gear of this helical gear pair.
| Modification Type | Theoretical Range (µm) | Purpose |
|---|---|---|
| Lead Crowning, $C_a$ | 0 – 20.8 | Compensate for misalignment & edge loading |
| Lead Slope, $CHB$ | 20 – 47 | Compensate for shaft bending/torsion |
| Tip Relief, $\delta_{max}$ | 0 – 28.8 | Mitigate mesh stiffness variation & pitch errors |
Full-Factorial Design Optimization Framework
With the theoretical ranges defined, a systematic optimization was conducted to find the best combination of modifications. A full-factorial Design of Experiments (DoE) was employed, which evaluates every possible combination of the selected factor levels. This method is exhaustive and allows for the accurate estimation of all main effects and interaction effects between the modification parameters.
Optimization Variables: The three modification amounts applied to the pinion’s left flank: Lead Crowning, Lead Slope, and Tip Relief.
Factor Levels: Each continuous variable was discretized into 15 equally spaced levels across its theoretical range (from Table 2).
Total Simulations: $15^3 = 3,375$ unique gear micro-geometry configurations.
Optimization Objectives: The goal was to minimize load concentration. This was quantified using two ISO-standardized load distribution factors calculated under the worst-case (reverse drive) operating condition:
1. Face Load Factor for Contact Stress, $K_{H\beta}$: Characterizes uneven load distribution along the face width affecting contact pressure.
2. Face Load Factor for Bending Stress, $K_{F\beta}$: Characterizes uneven load distribution along the face width affecting root bending stress.
The target was to bring these factors as close as possible to the ideal value of 1.0, with a practical target range of $1.10 < K_{H\beta}, K_{F\beta} < 1.20$.
Process: An automated process within the gear analysis software generated all 3,375 modified helical gear geometries, performed quasi-static tooth contact analysis for each, and extracted the resulting $K_{H\beta}$ and $K_{F\beta}$ values.
Optimization Results and Analysis
The optimization routine ranked all 3,375 design points based on a weighted score of the two objective factors. The top 10 performing candidate solutions are presented below. Notably, all achieve nearly identical and excellent objective values, indicating a robust optimal region.
| Rank | Lead Slope (µm) | Lead Crowning (µm) | Tip Relief (µm) | $K_{H\beta}$ | $K_{F\beta}$ |
|---|---|---|---|---|---|
| 1 | 36.43 | 6.07 | 5.36 | 1.100 | 1.089 |
| 2 | 32.14 | 11.43 | 3.57 | 1.100 | 1.089 |
| 3 | 41.79 | 10.36 | 11.79 | 1.100 | 1.089 |
| 4 | 31.07 | 8.21 | 22.00 | 1.100 | 1.089 |
| 5 | 31.07 | 9.29 | 6.43 | 1.100 | 1.089 |
| 6 | 31.07 | 11.43 | 3.26 | 1.100 | 1.089 |
| 7 | 37.50 | 11.43 | 6.43 | 1.101 | 1.089 |
| 8 | 38.57 | 11.43 | 7.50 | 1.101 | 1.089 |
| 9 | 40.71 | 11.43 | 11.79 | 1.101 | 1.089 |
| 10 | 41.79 | 10.36 | 10.71 | 1.101 | 1.090 |
From these top candidates, a final optimal set was selected by applying a practical “nearest-integer” rule to the averages from the top-performing cluster, favoring moderate values for manufacturability.
| Modification Type | Optimal Value (µm) |
|---|---|
| Lead Crowning | 12 |
| Lead Slope | 37 |
| Tip Relief | 3 |
The resulting combined lead modification (crowning + slope) curve and the profile relief curve were generated. The lead modification shows a maximum of 49 µm at one end of the pinion face, effectively mirroring the predicted shaft deflection curve. The optimal tip relief of 3 µm is significantly lower than the theoretical maximum of 28.8 µm, suggesting that in the optimized mesh condition, the elastic deflections largely compensate for the base pitch and profile errors, requiring only minimal profile modification for this helical gear pair.
Performance Evaluation: Before vs. After Optimization
The performance of the helical gear pair with the optimal modifications was compared against the unmodified baseline design across several key metrics.
Static Load Distribution
Root Stress: The unmodified gear exhibited concentrated root bending stress over approximately one-third of the face width, with a peak principal stress of 362.1 MPa. The optimized helical gear showed a perfectly uniform distribution of root stress across the entire face width, with the peak stress reduced by 44% to 204.3 MPa.
Contact Pattern & Unit Load: The unmodified gear suffered from severe bias loading, with contact concentrated at one end. The maximum unit line load reached 522 N/mm at initial contact. After optimization, the contact pattern was centered and spread evenly across the tooth flank. The maximum unit line load was drastically reduced by 58.2% to 218 N/mm, located near the center of the face width.
Transmission Error and Dynamic Response
Transmission Error (TE) is a primary source of gear vibration excitation. The quasi-static TE was evaluated over one mesh cycle.
Transmission Error Reduction: The peak-to-peak TE of the unmodified helical gear pair was 1.43 µm. The optimally modified pair achieved a TE of only 0.35 µm, representing a reduction of 75.5%. This signifies a much smoother transfer of motion and drastically lower vibration excitation.
System Vibration: To assess the full dynamic impact, the optimized TE function was used as an excitation input in a dynamic model of the gearbox housing. The acceleration response on the housing surface was simulated over the operating speed range (0-382 rpm). While differences were minor at lower speeds, a significant improvement was observed at the maximum operating speed. The housing surface acceleration was reduced from 0.045 m/s² for the unmodified design to 0.024 m/s² for the modified design, a reduction of 46.7%.
Conclusion
This study demonstrates a highly effective, two-stage methodology for optimizing the tooth surface modification of heavily loaded helical gears. By first using theoretical engineering calculations to establish physically meaningful bounds for lead crowning, lead slope, and tip relief, and subsequently employing a full-factorial Design of Experiments within a advanced simulation environment, an optimal modification scheme was efficiently identified. The optimization successfully minimized the key load distribution factors $K_{H\beta}$ and $K_{F\beta}$.
The results confirm that the optimally modified helical gear pair achieves vastly superior performance. The load distribution across the tooth face and root became essentially uniform, eliminating damaging edge stresses and reducing the maximum contact pressure by more than half. Furthermore, the primary dynamic excitation, transmission error, was reduced by over 75%, leading to a simulated reduction in housing vibration of approximately 47% at full load and speed. This comprehensive approach to helical gear micro-geometry optimization provides a reliable pathway for enhancing the load capacity, reliability, and acoustic performance of critical gear drives in heavy industrial machinery.