
In the realm of industrial robotics, the performance of rotary vector reducers is paramount for ensuring precision in positioning and smooth motion trajectories. As a key component in robotic joints, the rotary vector reducer directly influences dynamic behavior, including torsional vibrations that can lead to chatter and reduced accuracy. This article delves into the methodologies and findings from my extensive research on torsional vibration testing and diagnostic techniques for rotary vector reducers. By simulating real-world load conditions and employing advanced signal analysis, I aim to establish a framework for dynamic performance evaluation and defect diagnosis in rotary vector reducers. The study not only highlights the importance of torsional vibration monitoring but also provides practical insights for quality control in manufacturing processes. Throughout this work, the term “rotary vector reducer” is emphasized to underscore its centrality in robotic systems, and various analytical tools such as tables and formulas are utilized to summarize key concepts.
The rotary vector reducer, often abbreviated as RV reducer, is a precision gear mechanism that combines a primary planetary gear stage with a secondary cycloidal gear stage. This design offers high reduction ratios, compactness, and excellent torque capacity, making it ideal for industrial robots. However, like any mechanical system, rotary vector reducers are susceptible to vibrations due to manufacturing tolerances, assembly errors, or wear. Torsional vibration, in particular, refers to oscillatory twisting motions along the rotational axis, which can exacerbate noise, fatigue, and positioning errors. My research focuses on developing a robust testing protocol to measure these vibrations under simulated operational conditions, thereby enabling proactive diagnosis and improvement of rotary vector reducer quality. The ultimate goal is to enhance the reliability and performance of robotic systems by ensuring that each rotary vector reducer meets stringent dynamic standards.
To begin, I will outline the torsional vibration testing technology employed in this study. The experimental setup was designed to replicate the inertial loads experienced by a rotary vector reducer in an industrial robot joint. A schematic representation of the rotary vector reducer assembly is provided below, which illustrates the integration of key components. This visualization aids in understanding the physical arrangement during testing.
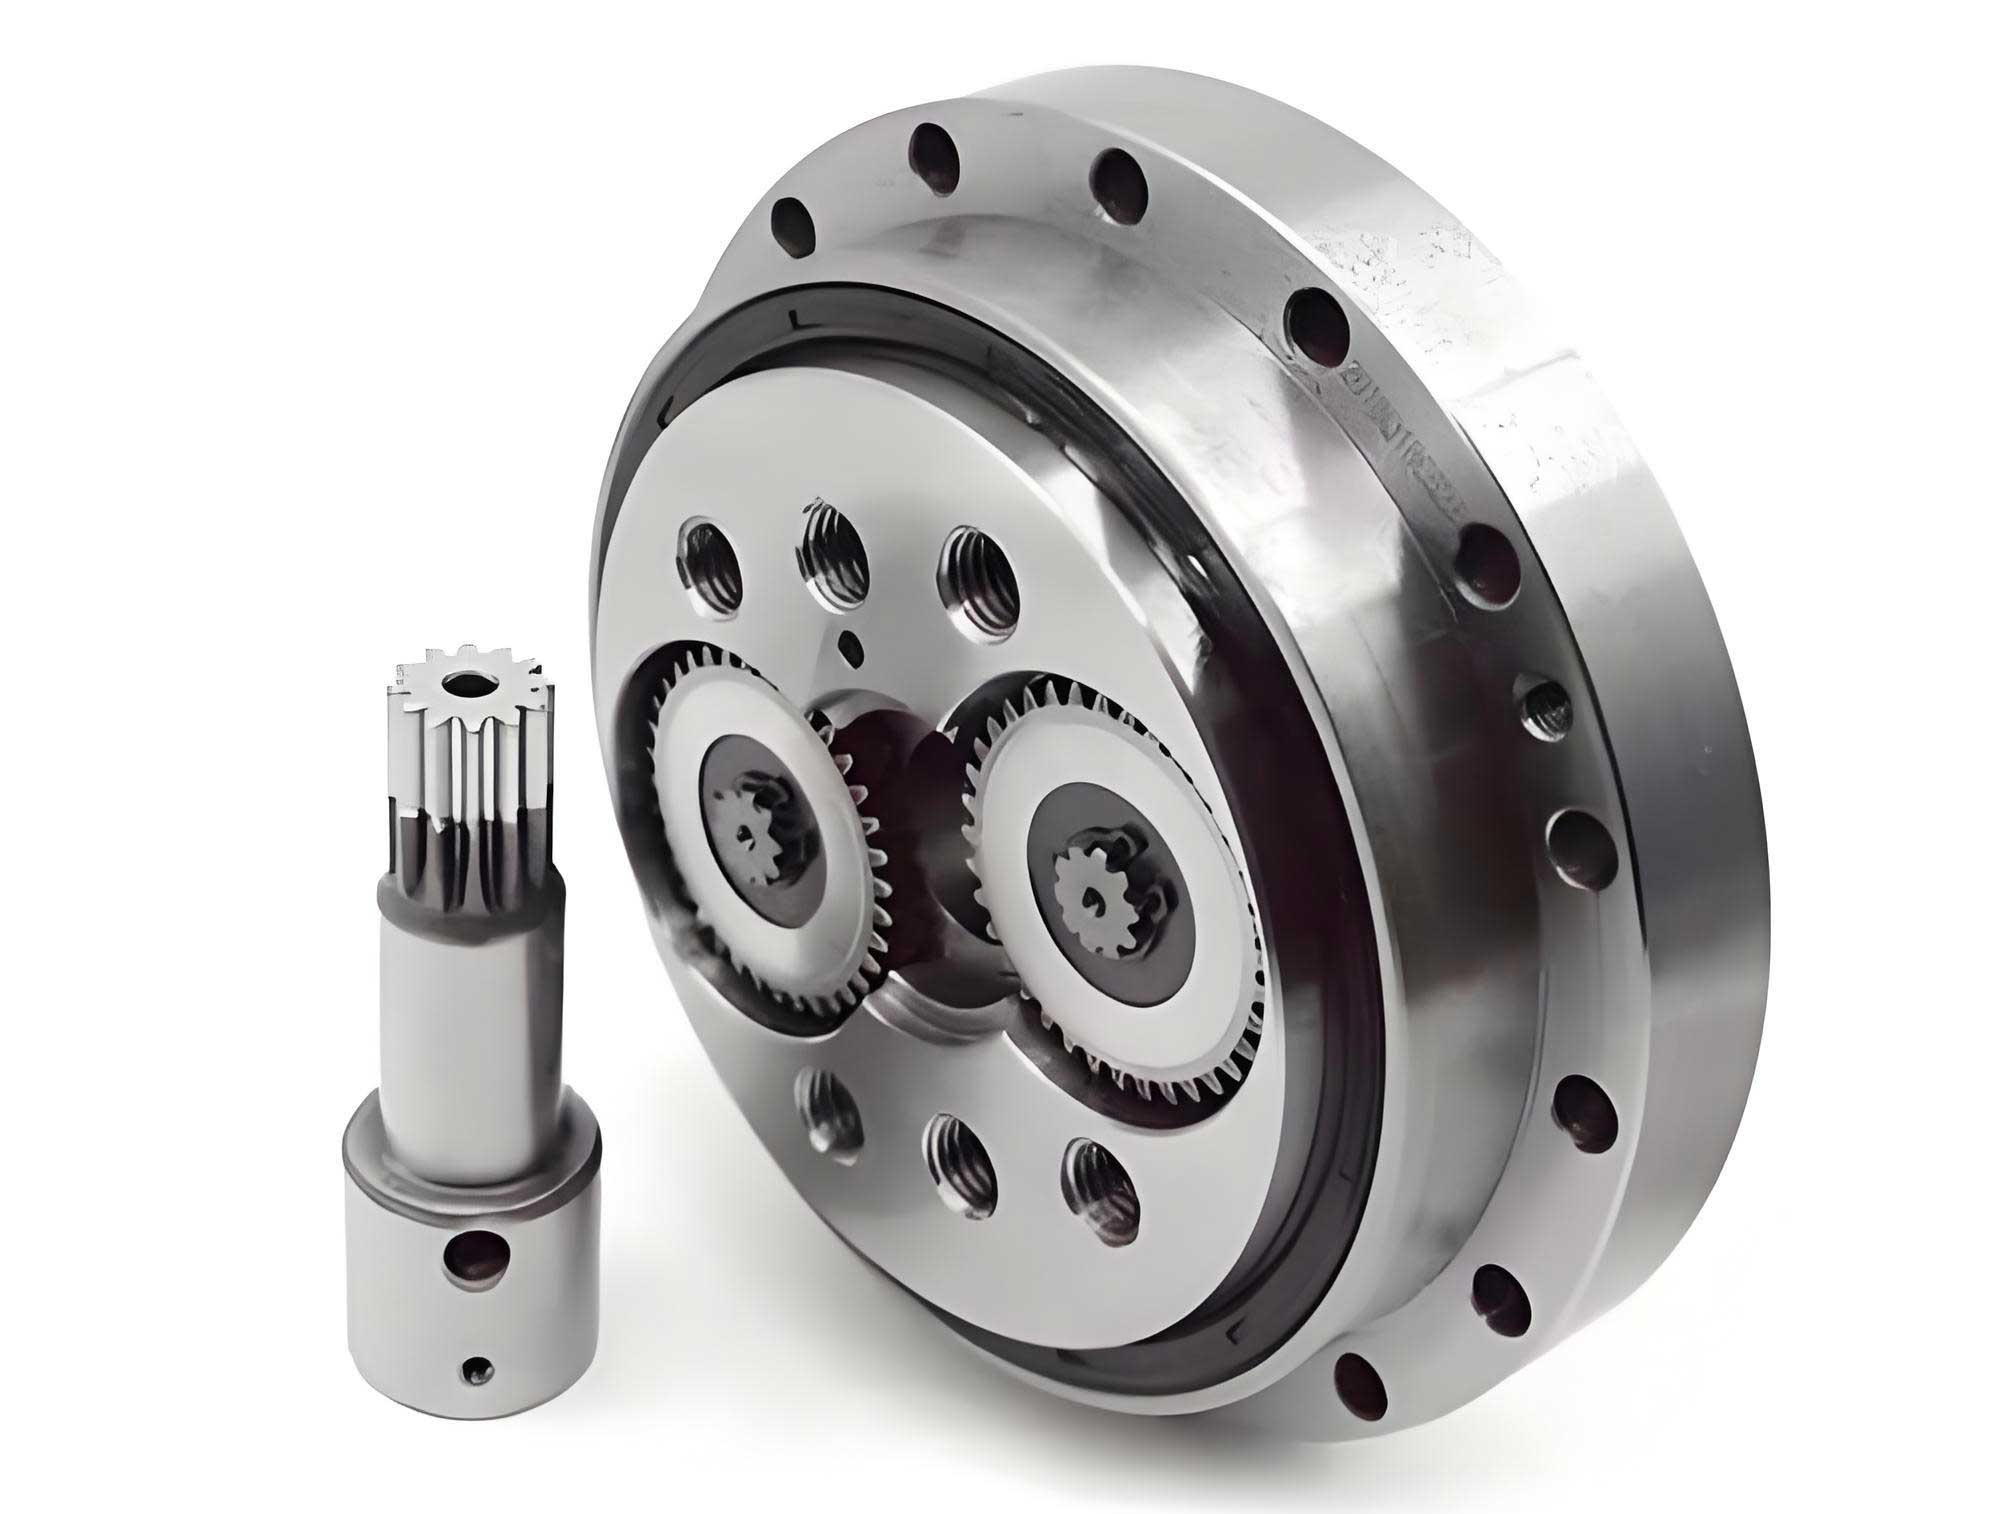
The testing apparatus comprised a rotary vector reducer model 40E, a supporting base, a servo motor for driving the input shaft, and a rotational inertia load to simulate the robotic arm’s mass. The inertia load had a moment of inertia of 56.65 kg·m², attached to the output shaft to mimic typical operational dynamics. Torsional vibrations were measured using a wireless acceleration sensor (model MTE-T8) placed tangentially on the housing of the rotary vector reducer, at a distance of 550 mm from the rotational axis. This setup allowed for the direct acquisition of circumferential acceleration, which is proportional to torsional vibration when considering the radius. The sensor had a sampling frequency of 800 Hz and an acceleration resolution of 0.002 g, ensuring high-fidelity data capture. The servo motor was programmed to drive the rotary vector reducer at speeds ranging from 300 r/min to 2000 r/min, in increments of 100 r/min, while torsional vibration time histories were recorded at each step. This comprehensive speed sweep enabled the characterization of the rotary vector reducer’s dynamic behavior across its operational range.
The underlying principle of this testing approach is based on the dynamics of torsional systems. When the rotary vector reducer is coupled with an inertial load, the entire assembly forms a torsional vibration system comprising elastic elements (gears and shafts) and masses (load inertia). The equation of motion for such a system can be expressed using a simplified model. For a single-degree-of-freedom torsional system, the natural frequency $$ f_n $$ is given by:
$$ f_n = \frac{1}{2\pi} \sqrt{\frac{k}{J}} $$
where $$ k $$ is the torsional stiffness of the rotary vector reducer and $$ J $$ is the equivalent moment of inertia. In practice, the rotary vector reducer is a multi-degree-of-freedom system, but this formula provides a foundational understanding. During operation, excitations from gear meshing and imbalances induce torsional vibrations, whose amplitudes vary with speed. By measuring these vibrations, I can assess the dynamic performance of the rotary vector reducer and identify anomalies indicative of manufacturing defects.
To organize the testing parameters and results, I have compiled the following table summarizing key aspects of the experimental setup for the rotary vector reducer:
| Component | Specification | Purpose |
|---|---|---|
| Rotary Vector Reducer | Model 40E, reduction ratio 121 | Test specimen for torsional vibration analysis |
| Servo Motor | Speed range: 300-2000 r/min | Drives the input shaft of the rotary vector reducer |
| Inertia Load | Moment of inertia: 56.65 kg·m² | Simulates robotic arm inertia on the rotary vector reducer |
| Acceleration Sensor | MTE-T8, 800 Hz sampling, 0.002 g resolution | Measures circumferential vibration on the rotary vector reducer |
| Measurement Point | 550 mm from rotational axis | Converts circumferential acceleration to torsional vibration |
Moving on to the results, the torsional vibration acceleration time histories were recorded for each speed. As an example, at a drive motor speed of 1600 r/min, the time-domain signal exhibited a distinctive beat pattern, as shown in the data analysis. This beat phenomenon is characteristic of rotary vector reducers due to their eccentric shaft design. Specifically, the model 40E rotary vector reducer incorporates two eccentric shafts, leading to two beats per revolution of the output shaft. The raw acceleration signal can be processed to extract features such as root mean square (RMS) values, which serve as metrics for torsional vibration performance. The RMS acceleration $$ a_{\text{rms}} $$ is calculated from the time history $$ a(t) $$ over a time period $$ T $$:
$$ a_{\text{rms}} = \sqrt{\frac{1}{T} \int_0^T a(t)^2 dt} $$
Similarly, the torsional vibration displacement can be estimated by integrating the acceleration signal twice. However, direct integration often amplifies low-frequency noise, so I employed a high-pass Butterworth filter to preprocess the data. Alternatively, wavelet-based integration techniques can be used for more accurate displacement estimation. The relationship between vibration acceleration and displacement is governed by the frequency content; for a sinusoidal vibration, the displacement amplitude $$ d $$ relates to acceleration amplitude $$ a $$ and frequency $$ f $$ as:
$$ d = \frac{a}{(2\pi f)^2} $$
Using these methods, I derived the torsional vibration performance curves for the rotary vector reducer, plotting RMS acceleration and displacement against motor speed. The curves revealed a peak vibration at around 1300 r/min, where both acceleration and displacement reached maximum values. This resonant peak indicates a critical speed where the excitation frequencies align with the natural frequencies of the torsional system. According to quality standards from manufacturers like Teijin Seiki, a rotary vector reducer in normal condition should exhibit vibration acceleration below 0.1 G. The tested rotary vector reducer showed values exceeding this threshold at certain speeds, prompting further diagnostic analysis.
To facilitate defect diagnosis, it is essential to understand the characteristic frequencies of the rotary vector reducer. These frequencies are determined by the gear geometry and rotational speeds. For the rotary vector reducer model 40E, with an input speed of 1200 r/min, the characteristic frequencies were calculated based on the transmission principles. The rotary vector reducer consists of a first-stage planetary gear set and a second-stage cycloidal gear set, forming a closed differential gear train. The key parameters include: number of teeth on input gear $$ z_1 $$, planets $$ z_2 $$, cycloidal gear $$ z_4 $$, and pin teeth $$ z_5 $$. The reduction ratio $$ R $$ is given by:
$$ R = \frac{n_1}{n_o} = 1 + \frac{z_2 z_5}{z_1 (z_5 – z_4)} $$
where $$ n_1 $$ is input speed and $$ n_o $$ is output speed. For the 40E rotary vector reducer, $$ R = 121 $$. The characteristic frequencies are derived from the kinematics of the system. When the pin housing is fixed, the rotational speeds of various components interrelate. Specifically, the planet gear’s rotation speed $$ n_2 $$ equals the cycloidal gear’s revolution speed $$ n_4 $$, and the planet carrier’s speed $$ n_3 $$ equals the cycloidal gear’s rotation speed $$ n_o $$. The formulas for characteristic frequencies are summarized in the table below, which is crucial for diagnostic purposes in rotary vector reducer analysis.
| Characteristic Frequency | Calculation Formula | Value at 1200 r/min Input |
|---|---|---|
| Drive shaft frequency | $$ f_1 = \frac{n_o R}{60} $$ | 19.98 Hz |
| Planet gear meshing frequency | $$ f_{\text{gear}} = \frac{n_o z_2 (z_5 – 1)}{60} $$ | 232.07 Hz |
| Cycloidal gear rotation frequency | $$ f_o = \frac{n_o}{60} $$ | 0.1653 Hz |
| Pin housing frequency | $$ f_3 = \frac{2n_o (z_5 – 1)}{60 z_5} $$ | 0.322 Hz |
| Planet gear rotation frequency | $$ f_2 = \frac{n_o (z_5 – 1)}{60} $$ | 6.446 Hz |
| Cycloidal gear meshing frequency | $$ f_{\text{cyc}} = \frac{n_o (z_5 – 1)}{60} $$ | 6.446 Hz |
| Pin tooth meshing frequency | $$ f_{\text{pin}} = \frac{2n_o (z_5 – 1)}{60} $$ | 12.892 Hz |
These characteristic frequencies serve as fingerprints for the rotary vector reducer. During torsional vibration analysis, spectral peaks at or near these frequencies can indicate specific defects. For instance, excess vibration at the pin tooth meshing frequency may point to issues with pin diameter tolerance, while anomalies at planet gear frequencies could suggest gear profile errors. In my research, I applied fast Fourier transform (FFT) and short-time Fourier transform (STFT) to the torsional vibration signals to decompose them into frequency components. This allowed for the identification of dominant frequencies and their harmonics, facilitating targeted diagnosis.
One notable case involved a rotary vector reducer exhibiting a prominent peak in the vibration performance curve at 1500 r/min. The vibration acceleration RMS value exceeded 0.1 G, indicating subpar performance. Spectral analysis of the signal at this speed revealed dominant low-frequency components around 16.3 Hz, which closely matches the pin tooth meshing frequency $$ f_{\text{pin}} $$ calculated for that speed. Given the geometry of the rotary vector reducer, this vibration characteristic is associated with the interaction between the cycloidal gear and pin teeth. Upon physical inspection, the pin teeth were found to have diameters outside the specified tolerances. This manufacturing defect altered the cycloidal gear’s rotational path, introducing periodic excitations that amplified torsional vibrations. After replacing the pin tooth set in the rotary vector reducer, the vibration test was repeated. The new performance curve showed a reduction in acceleration amplitude by approximately one-third, demonstrating significant improvement in the dynamic behavior of the rotary vector reducer. This case underscores the importance of precision manufacturing in rotary vector reducers and the efficacy of torsional vibration testing for quality assurance.
Another diagnostic example pertained to a different rotary vector reducer that displayed sharp peaks in the vibration curve at 800 r/min and 1200 r/min. Spectral analysis of the signal at 1200 r/min indicated high-frequency content between 300 Hz and 350 Hz. This frequency band corresponds to the operational modal frequencies of the torsional system, which are excited by impact-like forces. To trace the source, I performed envelope analysis on the band-pass filtered signal. The envelope spectrum exhibited a peak at 6.4 Hz, aligning with the planet gear rotation frequency $$ f_2 $$. This suggested that the planet gears had profile errors, causing periodic impacts during meshing. These impacts excited the system’s natural modes, leading to elevated high-frequency vibrations. Replacing the planet gears in the rotary vector reducer resulted in the disappearance of the sharp peaks in the vibration curve and a substantial reduction in high-frequency spectral components. Thus, torsional vibration analysis, combined with envelope techniques, enabled precise diagnosis of gear defects in the rotary vector reducer.
Beyond these cases, my research explored broader aspects of torsional vibration in rotary vector reducers. For instance, the influence of assembly preload on vibration characteristics was investigated. Preload in bearings and gears can affect stiffness and damping, thereby altering torsional natural frequencies. A simplified model for the torsional stiffness $$ k $$ of a rotary vector reducer can be expressed as a series combination of stiffnesses from gears, shafts, and bearings. If $$ k_i $$ represents the stiffness of individual components, the equivalent stiffness $$ k_{\text{eq}} $$ is:
$$ \frac{1}{k_{\text{eq}}} = \sum \frac{1}{k_i} $$
Variations in preload during assembly can change these stiffness values, shifting resonance speeds. This highlights the need for controlled assembly processes in rotary vector reducer manufacturing. Additionally, environmental factors such as temperature can influence material properties and clearances, potentially affecting vibration levels. Future studies could incorporate thermal testing to assess the robustness of rotary vector reducers under varying conditions.
To further quantify the diagnostic process, I developed a statistical approach for assessing rotary vector reducer quality based on torsional vibration data. Multiple rotary vector reducers were tested, and their vibration RMS values were compiled into a database. Using statistical process control (SPC) methods, control limits were established for acceptable vibration levels. For example, the upper control limit (UCL) for acceleration RMS can be set as:
$$ \text{UCL} = \bar{x} + 3\sigma $$
where $$ \bar{x} $$ is the mean and $$ \sigma $$ is the standard deviation of vibration measurements from a sample of qualified rotary vector reducers. Any rotary vector reducer exceeding the UCL would be flagged for further inspection. This method provides a scalable solution for mass production quality control of rotary vector reducers.
In terms of signal processing advancements, I explored the use of wavelet transforms for torsional vibration analysis in rotary vector reducers. Unlike FFT, wavelets offer time-frequency localization, which is beneficial for non-stationary signals common in varying speed conditions. The continuous wavelet transform (CWT) of a vibration signal $$ a(t) $$ is defined as:
$$ \text{CWT}(a)(\tau, s) = \frac{1}{\sqrt{|s|}} \int_{-\infty}^{\infty} a(t) \psi^*\left(\frac{t-\tau}{s}\right) dt $$
where $$ \psi $$ is the mother wavelet, $$ \tau $$ is translation, and $$ s $$ is scale. By applying CWT to torsional vibration data from rotary vector reducers, I could identify transient events such as gear tooth impacts or bearing faults more effectively. This enhances the diagnostic capability for rotary vector reducers undergoing dynamic testing.
Moreover, the integration of machine learning algorithms holds promise for automated defect diagnosis in rotary vector reducers. By training classifiers on features extracted from torsional vibration signals (e.g., spectral kurtosis, entropy), patterns associated with specific faults can be learned. For instance, a support vector machine (SVM) could distinguish between healthy and defective rotary vector reducers based on vibration data. This represents a forward-looking application of my research, aiming to streamline quality assurance processes for rotary vector reducer producers.
Throughout this investigation, the recurring theme is the critical role of torsional vibration testing in ensuring the reliability of rotary vector reducers. Each test not only evaluates performance but also serves as a diagnostic tool for rooting out manufacturing imperfections. The rotary vector reducer, as a complex mechanical system, demands meticulous attention to detail in both design and production. My findings affirm that torsional vibration metrics are sensitive indicators of quality, and their analysis can lead to tangible improvements in rotary vector reducer dynamics.
In conclusion, this comprehensive study on torsional vibration testing and diagnosis for rotary vector reducers has demonstrated the value of dynamic performance evaluation under simulated load conditions. By employing inertial loading, high-resolution sensors, and advanced signal processing, I established a methodology for characterizing torsional vibrations in rotary vector reducers. The use of characteristic frequency tables and formulas enabled precise defect diagnosis, as illustrated in cases involving pin tooth and planet gear anomalies. The insights gained contribute to the broader goal of enhancing the quality and reliability of rotary vector reducers in industrial robotics. As the demand for precision robotics grows, so does the importance of rigorous testing protocols for components like the rotary vector reducer. Future work may expand on these techniques to include real-time monitoring and predictive maintenance, further solidifying the rotary vector reducer’s place as a cornerstone of robotic motion control.