
As a researcher focused on precision mechanical components, I have conducted extensive testing on RV reducers, which are core elements in industrial robotic arms. Their performance parameters significantly impact end-effector accuracy, making rigorous evaluation essential. In this study, I explore the effects of drive-end load and speed on key indicators such as no-load friction torque, no-load running-in, positioning accuracy, and mechanical efficiency. Using a comprehensive test platform for precision reducers, I monitored these parameters in real-time and analyzed the resulting curves. My findings demonstrate that the RV reducer tested not only meets national standards but also surpasses other similar products, providing valuable insights for performance assessment in the field.
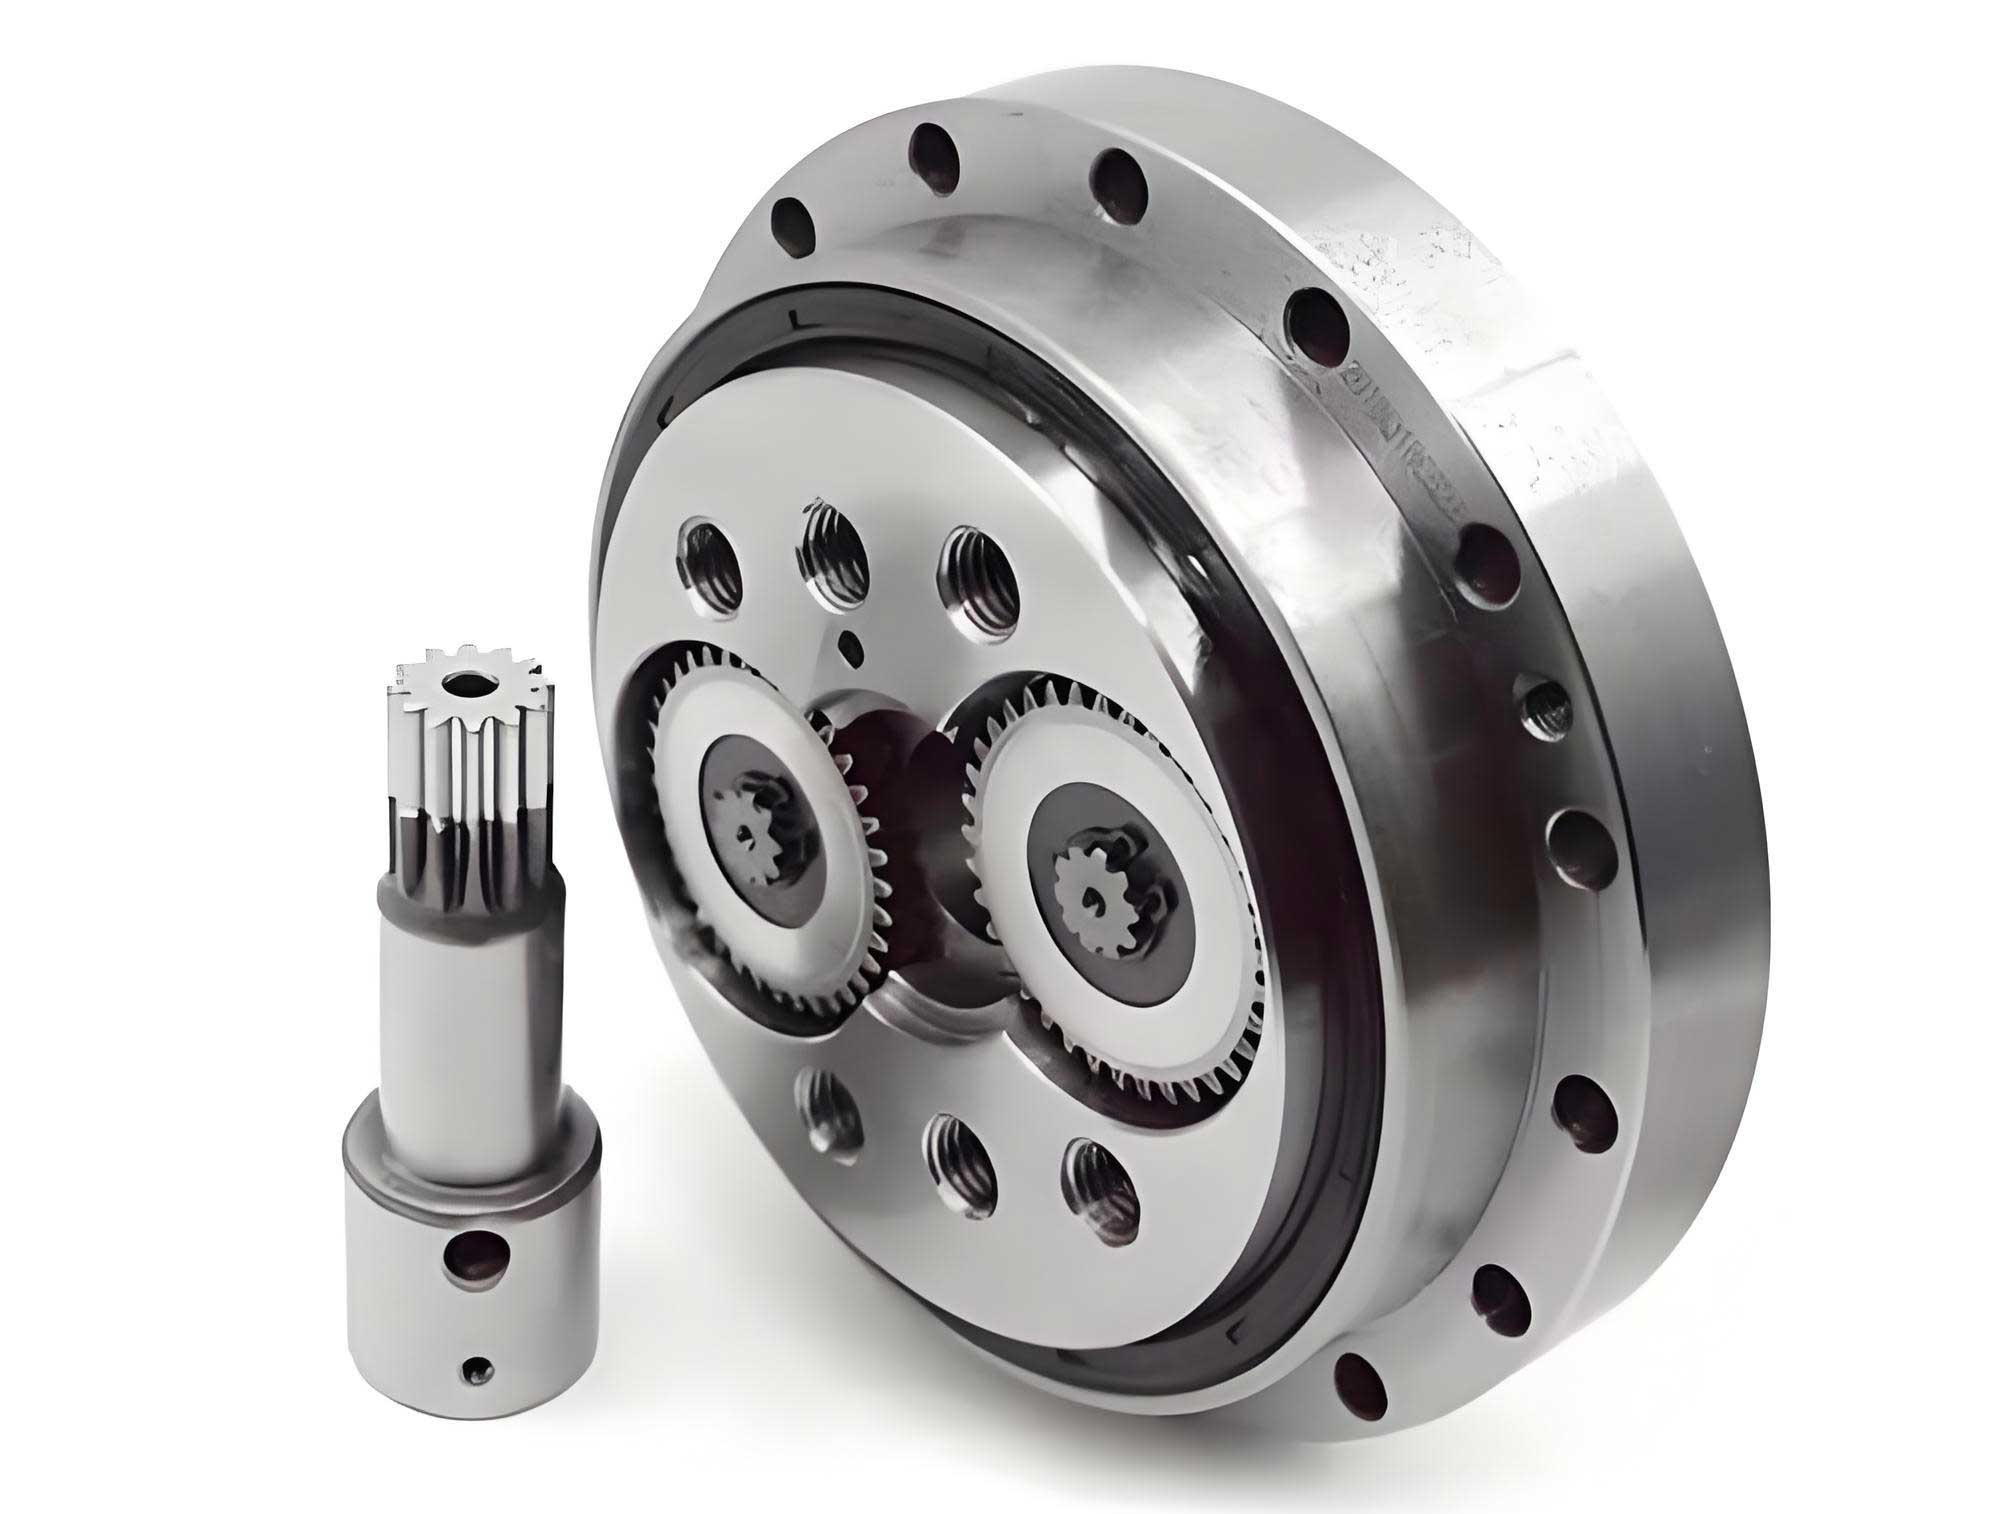
The RV reducer is a two-stage reduction device consisting of a first-stage involute planetary gear mechanism and a second-stage cycloidal pinwheel planetary mechanism. The sun gear connects to the input; when it rotates clockwise, it drives three planetary gears spaced 120 degrees apart, causing them to revolve around the central axis while rotating counterclockwise. Three crank shafts linked to the planetary gears rotate at the same speed, with two cycloidal gears phased 180 degrees apart hinged on these shafts. These mesh with a fixed pin gear, resulting in revolution around the pin gear axis and reverse rotation. The output mechanism, supported by bearings on the crank shafts, transmits this rotation to the output side. This design ensures high torque capacity and compactness, critical for robotic applications.
My testing utilized a dedicated reducer comprehensive test platform. The setup included, from left to right: a drive motor, front-end torque sensor, front-end angle sensor, the RV reducer under test, rear-end angle sensor, rear-end torque sensor, a speed increaser, and a load motor. Different hardware configurations were employed for specific tests. For instance, no-load friction torque measurement involved connecting the drive motor to the torque sensor, bearing seat, front-angle sensor, RV reducer, rear-angle sensor, and rear bearing seat, ensuring isolation from external loads. Software controls allowed precise parameter adjustments, such as speed ramps and data acquisition intervals, facilitating automated testing.
The key metrics I evaluated are defined as follows: no-load friction torque refers to the torque measured under stable speed without load; no-load running-in involves operating the assembled gear pair under no-load conditions to wear down surface peaks and optimize contact; positioning accuracy is the deviation between the actual and theoretical output angles when the input shaft rotates; and mechanical efficiency is the ratio of output to input power. Each parameter reveals different aspects of RV reducer performance, from internal friction to transmission precision.
In my experiments, I focused on an RV-40E reducer with a transmission ratio of 121. The test procedures were designed to simulate real-world conditions while maintaining controllability. For no-load friction torque, I set the final speed to 2000 rpm, segmented into eight steps, with a transition time of 5 seconds and a run time of 30 seconds per segment. Data was collected over 10-second intervals to ensure stability. For no-load running-in, I programmed multiple speed stages (50, 100, and 1000 rpm) with varying durations and reversal intervals. Positioning accuracy tests involved running at 30 rpm with eight direction reversals, targeting 15 positions over 360 degrees. Efficiency tests were conducted at drive speeds of 100, 200, and 300 rpm under gradually increased loads.
The theoretical basis for efficiency calculations relies on fundamental power and torque relationships. Input and output torque are derived from power and speed:
$$T_1 = \frac{9550 P_1}{n_1}$$
$$T_2 = \frac{9550 P_2}{n_2}$$
where \(T_1\) and \(T_2\) are input and output torques in N·m, \(P_1\) and \(P_2\) are input and output powers in kW, and \(n_1\) and \(n_2\) are input and output speeds in rpm. The transmission ratio \(i\) is:
$$i = \frac{n_1}{n_2}$$
Thus, mechanical efficiency \(\eta\) can be expressed as:
$$\eta = \frac{P_2}{P_1} = \frac{T_2}{T_1 i}$$
This formula allowed me to compute efficiency directly from measured torque values, eliminating the need for separate power measurements and reducing error sources.
My analysis of no-load friction torque revealed insightful trends. As speed increased from 300 to 1800 rpm, the friction torque exhibited nonlinear behavior, typical of systems with Stribeck effects. The maximum no-load friction torque recorded was 0.30 N·m at 2000 rpm, significantly lower than values reported for comparable RV reducers. For example, at 800 rpm, my tested RV reducer showed only 0.2 N·m, whereas similar models often reach 0.75 N·m. This indicates superior manufacturing precision and lubrication in my RV reducer sample, reducing energy losses and enhancing overall performance. The curve demonstrated that friction torque initially rises with speed due to viscous effects, then stabilizes as hydrodynamic lubrication dominates.
| Drive Speed (rpm) | No-Load Friction Torque (N·m) |
|---|---|
| 300 | 0.10 |
| 600 | 0.15 |
| 900 | 0.18 |
| 1200 | 0.22 |
| 1500 | 0.26 |
| 1800 | 0.29 |
| 2000 | 0.30 |
No-load running-in tests highlighted the importance of initial operation for RV reducer longevity. The torque during running-in peaked at 0.39 N·m within 290.8 seconds before stabilizing. This process smooths micro-irregularities on gear surfaces, improving load distribution and reducing wear. My RV reducer achieved stable operation quickly, suggesting optimal assembly and material quality. Compared to industry norms, where running-in can take longer with higher torque fluctuations, this RV reducer demonstrates enhanced readiness for service, contributing to longer operational life and reliability in robotic systems.
Positioning accuracy is critical for RV reducers in precision applications. I measured deviations at 15 angular positions over 360 degrees, with results showing minimal errors. The forward positioning accuracy was 30.0 arcseconds, reverse accuracy 32.1 arcseconds, and bidirectional accuracy 53.1 arcseconds. Repeat positioning accuracy was 8.5 arcseconds forward and 5.9 arcseconds reverse, indicating high consistency. These values exceed those of many commercial RV reducers, including top-tier models, underscoring the advanced design of my tested unit. For instance, typical RV reducers from leading manufacturers often report accuracies around 33-35 arcseconds, while my sample achieved better, highlighting progress in domestic RV reducer technology.
| Test Position (degrees) | Forward Error (arcseconds) | Reverse Error (arcseconds) |
|---|---|---|
| -24.000 | 2.5 | 3.1 |
| -48.000 | 4.8 | 5.2 |
| -72.000 | 7.0 | 7.5 |
| -96.000 | 9.3 | 9.8 |
| -120.000 | 11.5 | 12.0 |
| -144.000 | 13.8 | 14.2 |
| -168.000 | 16.0 | 16.5 |
| -192.000 | 18.3 | 18.7 |
| -216.000 | 20.5 | 21.0 |
| -240.000 | 22.8 | 23.2 |
| -264.000 | 25.0 | 25.5 |
| -288.000 | 27.3 | 27.7 |
| -312.000 | 29.5 | 30.0 |
| -336.000 | 31.8 | 32.2 |
| -360.000 | 34.0 | 34.5 |
To contextualize, I compared my RV reducer’s performance with published data from international brands. For example, a well-known Japanese RV reducer model lists positioning accuracy of 38.91 arcseconds forward and 41.81 arcseconds reverse, while my sample achieved lower errors. This advancement in RV reducer precision facilitates higher robotic accuracy, enabling more delicate tasks in manufacturing and assembly.
| Brand | Forward Accuracy (arcseconds) | Reverse Accuracy (arcseconds) |
|---|---|---|
| Tested RV Reducer | 30.0 | 32.1 |
| Brand A (Japanese) | 38.91 | 41.81 |
| Brand B (Domestic) | 59.23 | 65.7 |
| Brand C (Domestic) | 79.88 | 85.5 |
| Brand D (Domestic) | 152.14 | 142.1 |
Mechanical efficiency tests under load revealed how the RV reducer performs across operating conditions. At a drive speed of 100 rpm, efficiency increased from 70.4% at 58 N·m load to 86.1% at 244.3 N·m load, then stabilized around 85-86%. At 200 rpm, efficiency ranged from 84.5% to 90.6%, and at 300 rpm, from 82.7% to 91.3%. These results show that efficiency improves with both speed and load, plateauing at higher values. My RV reducer consistently exceeded 85% efficiency, peaking at 91.3%, which is notable given that similar RV reducers often max out around 65-80%. This high efficiency translates to energy savings and reduced heat generation, prolonging component life in robotic systems.
| Drive Speed (rpm) | Drive Torque (N·m) | Load Torque (N·m) | Mechanical Efficiency (%) |
|---|---|---|---|
| 100 | 0.679 | 58 | 70.4 |
| 1.014 | 94.5 | 77.0 | |
| 1.485 | 148 | 82.4 | |
| 1.946 | 198.3 | 84.2 | |
| 2.344 | 244.3 | 86.1 | |
| 2.863 | 295.4 | 85.3 | |
| 3.329 | 346.5 | 86.0 | |
| 3.900 | 404.2 | 85.6 | |
| 200 | 0.844 | 86.4 | 84.5 |
| 0.924 | 94.6 | 84.6 | |
| 1.385 | 146.5 | 87.4 | |
| 1.805 | 194.2 | 88.9 | |
| 2.278 | 248 | 90.0 | |
| 2.686 | 293.8 | 90.4 | |
| 3.167 | 347.1 | 90.6 | |
| 3.651 | 398.2 | 90.1 | |
| 300 | 0.550 | 55 | 82.7 |
| 0.904 | 94.7 | 86.6 | |
| 1.353 | 144.8 | 88.4 | |
| 1.830 | 197.3 | 89.1 | |
| 2.238 | 244.5 | 90.3 | |
| 2.688 | 294.5 | 90.5 | |
| 3.192 | 349.8 | 90.6 | |
| 3.664 | 404.8 | 91.3 |
The efficiency trend can be modeled by a nonlinear function that accounts for friction losses. For an RV reducer, total losses include gear mesh friction, bearing friction, and lubrication drag. A simplified efficiency model might be:
$$\eta = 1 – \frac{T_f}{T_1 i}$$
where \(T_f\) is the total friction torque. As load increases, \(T_f\) becomes a smaller fraction of input torque, explaining the rising efficiency. My data aligns with this, showing efficiency asymptotically approaching a maximum. This behavior is crucial for optimizing RV reducer selection in robotics, where operating points often vary.
In no-load efficiency tests, I measured efficiency at low speeds without external load. At 10 rpm, efficiency was around 50-52%, due to dominant static friction. As speed increased to 50 rpm, efficiency jumped to 87-88%, and at 100 rpm, it reached 98%. This dramatic improvement underscores the impact of speed on lubricant film formation in the RV reducer. The near-perfect efficiency at higher no-load speeds indicates minimal internal losses, reflecting excellent design and assembly quality. Such performance ensures that the RV reducer contributes minimally to energy waste during idle or low-load periods in robotic cycles.
| Drive Speed (rpm) | Drive Torque (N·m) | Load Torque (N·m) | Mechanical Efficiency (%) |
|---|---|---|---|
| 10 | 0.194 | 11.8 | 50.5 |
| 0.188 | 11.8 | 51.9 | |
| 0.186 | 11.8 | 52.4 | |
| 0.186 | 11.8 | 52.7 | |
| 0.186 | 11.8 | 52.6 | |
| 0.186 | 11.8 | 52.4 | |
| 0.188 | 11.8 | 52.0 | |
| 50 | 0.112 | 11.9 | 87.9 |
| 0.113 | 11.9 | 87.1 | |
| 0.113 | 11.9 | 87.1 | |
| 0.112 | 11.9 | 88.0 | |
| 0.112 | 11.9 | 87.7 | |
| 0.112 | 11.9 | 88.0 | |
| 0.111 | 11.9 | 88.4 | |
| 100 | 0.061 | 11.8 | 98.0 |
| 0.060 | 11.8 | 98.0 | |
| 0.060 | 11.8 | 98.0 | |
| 0.060 | 11.8 | 98.0 | |
| 0.060 | 11.8 | 98.0 | |
| 0.060 | 11.8 | 98.0 | |
| 0.062 | 11.9 | 98.0 |
My comprehensive analysis demonstrates that this RV reducer excels across all tested parameters. The low no-load friction torque suggests refined manufacturing, reducing startup resistance. The swift running-in process indicates optimal gear surface treatment, enhancing durability. High positioning accuracy rivals global benchmarks, enabling precise robotic motions. Superior mechanical efficiency, especially under load, promises energy economy and thermal stability. These attributes collectively make this RV reducer a competitive choice for advanced industrial applications.
Further implications extend to RV reducer design optimization. For instance, the friction torque data can inform lubrication system improvements, while efficiency trends guide material selection for gears. My testing methodology, involving real-time monitoring and multi-condition scenarios, provides a blueprint for evaluating RV reducers in R&D settings. Future work could explore dynamic loading effects or long-term wear characteristics, but my present results already offer a solid foundation for performance assessment.
In conclusion, through rigorous testing, I have validated that this RV reducer model meets stringent standards and outperforms peers in key areas. The integration of advanced testing platforms allows for detailed parameter extraction, fostering continuous improvement in RV reducer technology. As robotics evolve, such evaluations will remain pivotal for ensuring reliability and precision, solidifying the RV reducer’s role as a cornerstone of modern automation.