
The pursuit of higher power density and efficiency in modern drivetrains, particularly within the aerospace and new energy vehicle sectors, has led to a significant increase in the operational speeds of gear transmissions. Among various gear types, helical gears are extensively favored for applications such as electric vehicle reducers due to their superior characteristics of smooth operation, high load-bearing capacity, and reduced noise emission. However, the transition to high-speed regimes introduces formidable challenges for effective lubrication. The substantial centrifugal forces inherent in high-speed rotation prevent lubricants from adequately adhering to the gear tooth surfaces when using conventional oil bath lubrication. Consequently, pressure-fed oil jet lubrication has become the predominant method for ensuring reliable lubrication and thermal management in high-speed gear systems. This technique involves the directed injection of oil onto the meshing zone, but its performance is governed by a complex interplay of parameters including injection velocity, angle, nozzle positioning, and oil quantity. Optimizing these parameters is crucial for achieving sufficient oil film formation while minimizing parasitic losses. Therefore, a comprehensive analysis of the lubrication characteristics and the associated windage power loss under oil jet conditions is essential for enhancing gear efficiency and durability. This work focuses on the computational and experimental investigation of oil jet lubrication for helical gears, employing advanced numerical simulation techniques coupled with image recognition for validation.
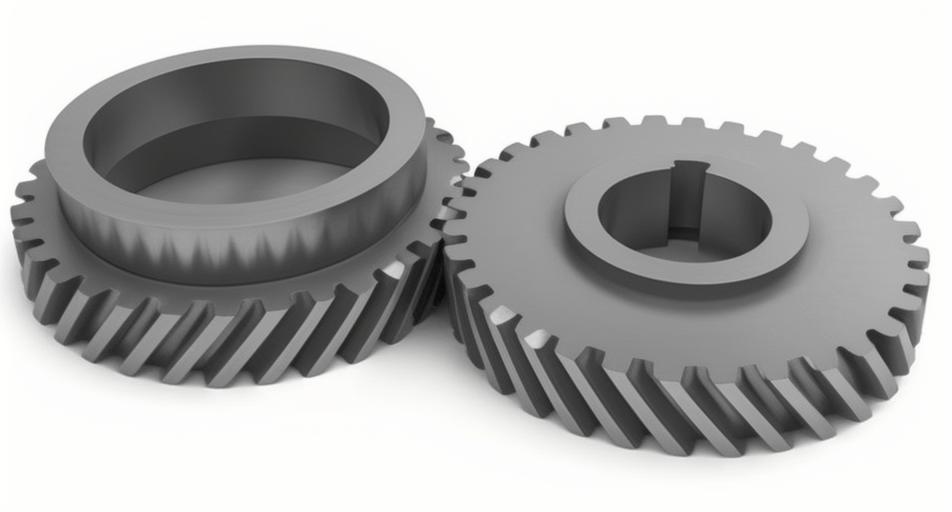
Our investigation employs a multi-faceted methodology combining Computational Fluid Dynamics (CFD) simulation and experimental validation. The core of the numerical analysis is based on the Volume of Fluid (VOF) multiphase model, which is adept at tracking the interface between immiscible fluids—in this case, air and oil. We established a three-dimensional transient CFD model of a pair of meshing helical gears enclosed within a simplified housing. The dynamic motion of the gear teeth is resolved using a dynamic mesh technique, allowing for the simulation of the complex, time-varying flow field generated by the rotating gears and the interacting oil jet.
The governing equations for the multiphase flow are as follows. The volume conservation constraint for the two phases (air and oil) is given by:
$$ r_{\text{air}} + r_{\text{oil}} = 1 $$
where $r_{\alpha}$ represents the volume fraction of phase $\alpha$ within a computational cell. The continuity equation for the mixture is:
$$ \frac{\partial \rho}{\partial t} + \nabla \cdot (\rho \vec{U}) = 0 $$
Here, $\rho$ is the mixture density, $t$ is time, and $\vec{U}$ is the velocity vector. The momentum conservation equation is:
$$ \frac{\partial (\rho \vec{U})}{\partial t} + \nabla \cdot (\rho \vec{U} \vec{U}) = -\nabla p + \nabla \cdot \bar{\tau} + \vec{S}_M $$
where $p$ is pressure, $\bar{\tau}$ is the stress tensor, and $\vec{S}_M$ represents external body forces. The Realizable $k$-$\epsilon$ turbulence model was selected to close the system of equations, modeling the turbulent viscosity $\mu_t$ as:
$$ \mu_t = \rho C_{\mu} \frac{k^2}{\epsilon} $$
The turbulent kinetic energy $k$ and its dissipation rate $\epsilon$ are solved via their respective transport equations:
$$ \frac{\partial}{\partial t}(\rho k) + \frac{\partial}{\partial x_j}(\rho U_j k) = \frac{\partial}{\partial x_j}\left[\left(\mu + \frac{\mu_t}{\sigma_k}\right) \frac{\partial k}{\partial x_j}\right] + G_k + G_b – \rho \epsilon – Y_M + S_k $$
$$ \frac{\partial}{\partial t}(\rho \epsilon) + \frac{\partial}{\partial x_j}(\rho U_j \epsilon) = \frac{\partial}{\partial x_j}\left[\left(\mu + \frac{\mu_t}{\sigma_{\epsilon}}\right) \frac{\partial \epsilon}{\partial x_j}\right] + \rho C_1 S \epsilon – \rho C_2 \frac{\epsilon^2}{k + \sqrt{\nu \epsilon}} + C_{1\epsilon}\frac{\epsilon}{k}C_{3\epsilon}G_b + S_{\epsilon} $$
where $G_k$ represents generation of turbulence kinetic energy due to mean velocity gradients, and other terms have their standard meanings.
The geometrical parameters of the studied helical gears are summarized in Table 1. The simulation domain included the gear pair, a compact housing, a defined oil inlet (nozzle), and an oil outlet. A tetrahedral mesh was generated, and a mesh independence study was conducted to ensure solution accuracy.
| Parameter | Pinion | Gear |
|---|---|---|
| Number of Teeth, $z$ | 11 | 19 |
| Normal Module, $m_n$ (mm) | 1 | |
| Normal Pressure Angle, $\alpha_n$ (°) | 20 | |
| Helix Angle, $\beta$ (°) | 20 | |
| Face Width (mm) | 5 | 5 |
A critical aspect of validating the CFD model is the quantitative comparison of oil coverage on the gear teeth. Direct measurement of the oil volume fraction on tooth surfaces in an experiment is challenging. To address this, we developed and applied an image recognition technique. A high-speed camera captured the oil jet lubrication process on a physical test rig using a pair of plastic helical gears. The captured video frames were processed to isolate the gear teeth and classify pixels as either “oil-covered” or “not oil-covered” based on color and intensity thresholds. The average oil volume fraction for individual tooth flanks was then calculated as the ratio of oil-covered pixels to the total tooth flank pixel area. This same metric was extracted from the CFD simulation results by post-processing the oil volume fraction field on the gear tooth surfaces. The comparison for several teeth under a specific operating condition (pinion speed: 18,000 rpm, injection velocity: 45 m/s) is presented in Table 2, demonstrating good agreement and validating the accuracy of the simulation model.
| Tooth ID | Simulation | Experiment (Image Recognition) | Relative Error (%) |
|---|---|---|---|
| 1 | 0.54 | 0.52 | 3.85 |
| 2 | 0.68 | 0.66 | 3.03 |
| 3 | 0.75 | 0.73 | 2.74 |
| 4 | 0.72 | 0.69 | 4.35 |
| 5 | 0.51 | 0.49 | 4.08 |
The validated CFD model enables a detailed examination of the transient flow field. The results for a representative case (pinion speed: 9,000 rpm, injection velocity: 10 m/s) reveal the complex interaction. The oil jet penetrates the gear mesh, with the highest oil volume fraction observed near the impingement zone and the meshing inlet. The rotation of the helical gears entrains air, creating a high-speed swirling flow around the teeth. A significant pressure build-up is observed in the gear mesh inlet region due to the squeezing of the oil-air mixture between the converging tooth surfaces, while a low-pressure or wake region forms at the mesh exit as the teeth separate. This pressure differential is a primary driver of the windage phenomenon.
Windage power loss, a critical component of no-load loss in high-speed gears, arises from the viscous drag of the churning air-oil mixture on the rotating gear surfaces. The windage torque $T_w$ acting on each gear is obtained by integrating the pressure and shear stress fields over the gear tooth and flank surfaces in the simulation. The total windage power loss $P_w$ for the gear pair is then calculated as:
$$ P_w = (T_{w1} + T_{w2}) \cdot \omega = (T_{w1} + T_{w2}) \cdot \frac{2\pi n}{60} $$
where $T_{w1}$ and $T_{w2}$ are the windage torques on the pinion and gear, respectively, $n$ is the rotational speed (rpm), and $\omega$ is the angular velocity (rad/s).
We systematically analyzed the influence of two key operational parameters—gear speed and oil injection velocity—on lubrication performance (quantified by oil film adhesion area) and windage power loss. A series of simulations were conducted with pinion speeds ranging from 9,000 to 21,000 rpm and injection velocities from 4 to 16 m/s. The results are synthesized in the tables below.
The oil film adhesion area on the driving pinion was found to be strongly influenced by both parameters. At a constant gear speed, increasing the injection velocity consistently expands the area wetted by oil, as the higher momentum of the jet improves its penetration against the opposing airflow created by the rotating helical gears. Conversely, at a constant injection velocity, increasing the gear speed significantly reduces the oil film area due to the intensified centrifugal and aerodynamic forces that strip oil from the tooth surfaces. This inverse relationship underscores the necessity of increasing injection pressure/velocity to maintain adequate lubrication at very high rotational speeds.
The analysis of windage power loss yielded insightful trends, as compiled in Table 3 and Table 4. The dominant factor affecting windage loss is unequivocally the gear rotational speed. The windage torque and power increase approximately quadratically with speed, reflecting the increased kinetic energy imparted to the surrounding fluid. The effect of injection velocity is more nuanced. At lower gear speeds (e.g., 9,000 rpm), increasing the oil injection velocity leads to a slight but noticeable increase in both total windage torque and power. This is attributed to the added mass and effective viscosity of the oil-air mixture interacting with the gears. However, as the gear speed escalates to 18,000 rpm and beyond, the influence of injection velocity on windage loss diminishes considerably. At these high speeds, the power required to churn the air itself becomes so dominant that the additional contribution from varying the oil jet velocity becomes relatively insignificant. This finding is crucial for system design, indicating that optimizing injection for lubrication at ultra-high speeds does not necessarily exacerbate windage losses.
| Injection Velocity (m/s) | 9,000 rpm (N·mm) | 12,000 rpm (N·mm) | 15,000 rpm (N·mm) | 18,000 rpm (N·mm) | 21,000 rpm (N·mm) |
|---|---|---|---|---|---|
| 4 | 66.97 | 102.19 | 142.32 | 194.72 | 251.14 |
| 7 | 70.92 | 104.67 | 145.92 | 193.77 | 247.68 |
| 10 | 73.72 | 105.76 | 146.41 | 193.87 | 246.97 |
| 13 | 75.19 | 107.90 | 148.09 | 194.75 | 246.97 |
| 16 | 76.37 | 109.28 | 149.59 | 195.75 | 247.81 |
| Injection Velocity (m/s) | 9,000 rpm (W) | 12,000 rpm (W) | 15,000 rpm (W) | 18,000 rpm (W) | 21,000 rpm (W) |
|---|---|---|---|---|---|
| 4 | 63.12 | 128.42 | 223.55 | 367.04 | 552.28 |
| 7 | 66.84 | 131.53 | 229.21 | 365.24 | 544.68 |
| 10 | 69.48 | 132.90 | 229.98 | 365.43 | 543.10 |
| 13 | 70.87 | 135.60 | 232.62 | 367.10 | 543.11 |
| 16 | 71.98 | 137.32 | 234.97 | 368.98 | 544.96 |
In conclusion, this integrated study employing CFD simulation validated by image recognition technology provides significant insights into oil jet lubrication for high-speed helical gears. The developed methodology allows for the quantitative comparison of oil coverage between simulation and experiment. The analysis confirms that oil jet lubrication can effectively supply lubricant to the meshing zone of high-speed helical gears, but its effectiveness is a strong function of operating conditions. The oil film adhesion area is antagonized by increasing gear speed but can be recovered by increasing the oil injection velocity. Regarding efficiency, windage power loss is overwhelmingly determined by the rotational speed of the helical gears. While higher injection velocities slightly increase windage loss at low speeds, this effect becomes negligible at the very high speeds where oil jet lubrication is most critical. These findings provide practical guidance for the design and optimization of lubrication systems for high-speed transmissions utilizing helical gears, enabling a balance between ensuring adequate lubrication and minimizing parasitic losses.