
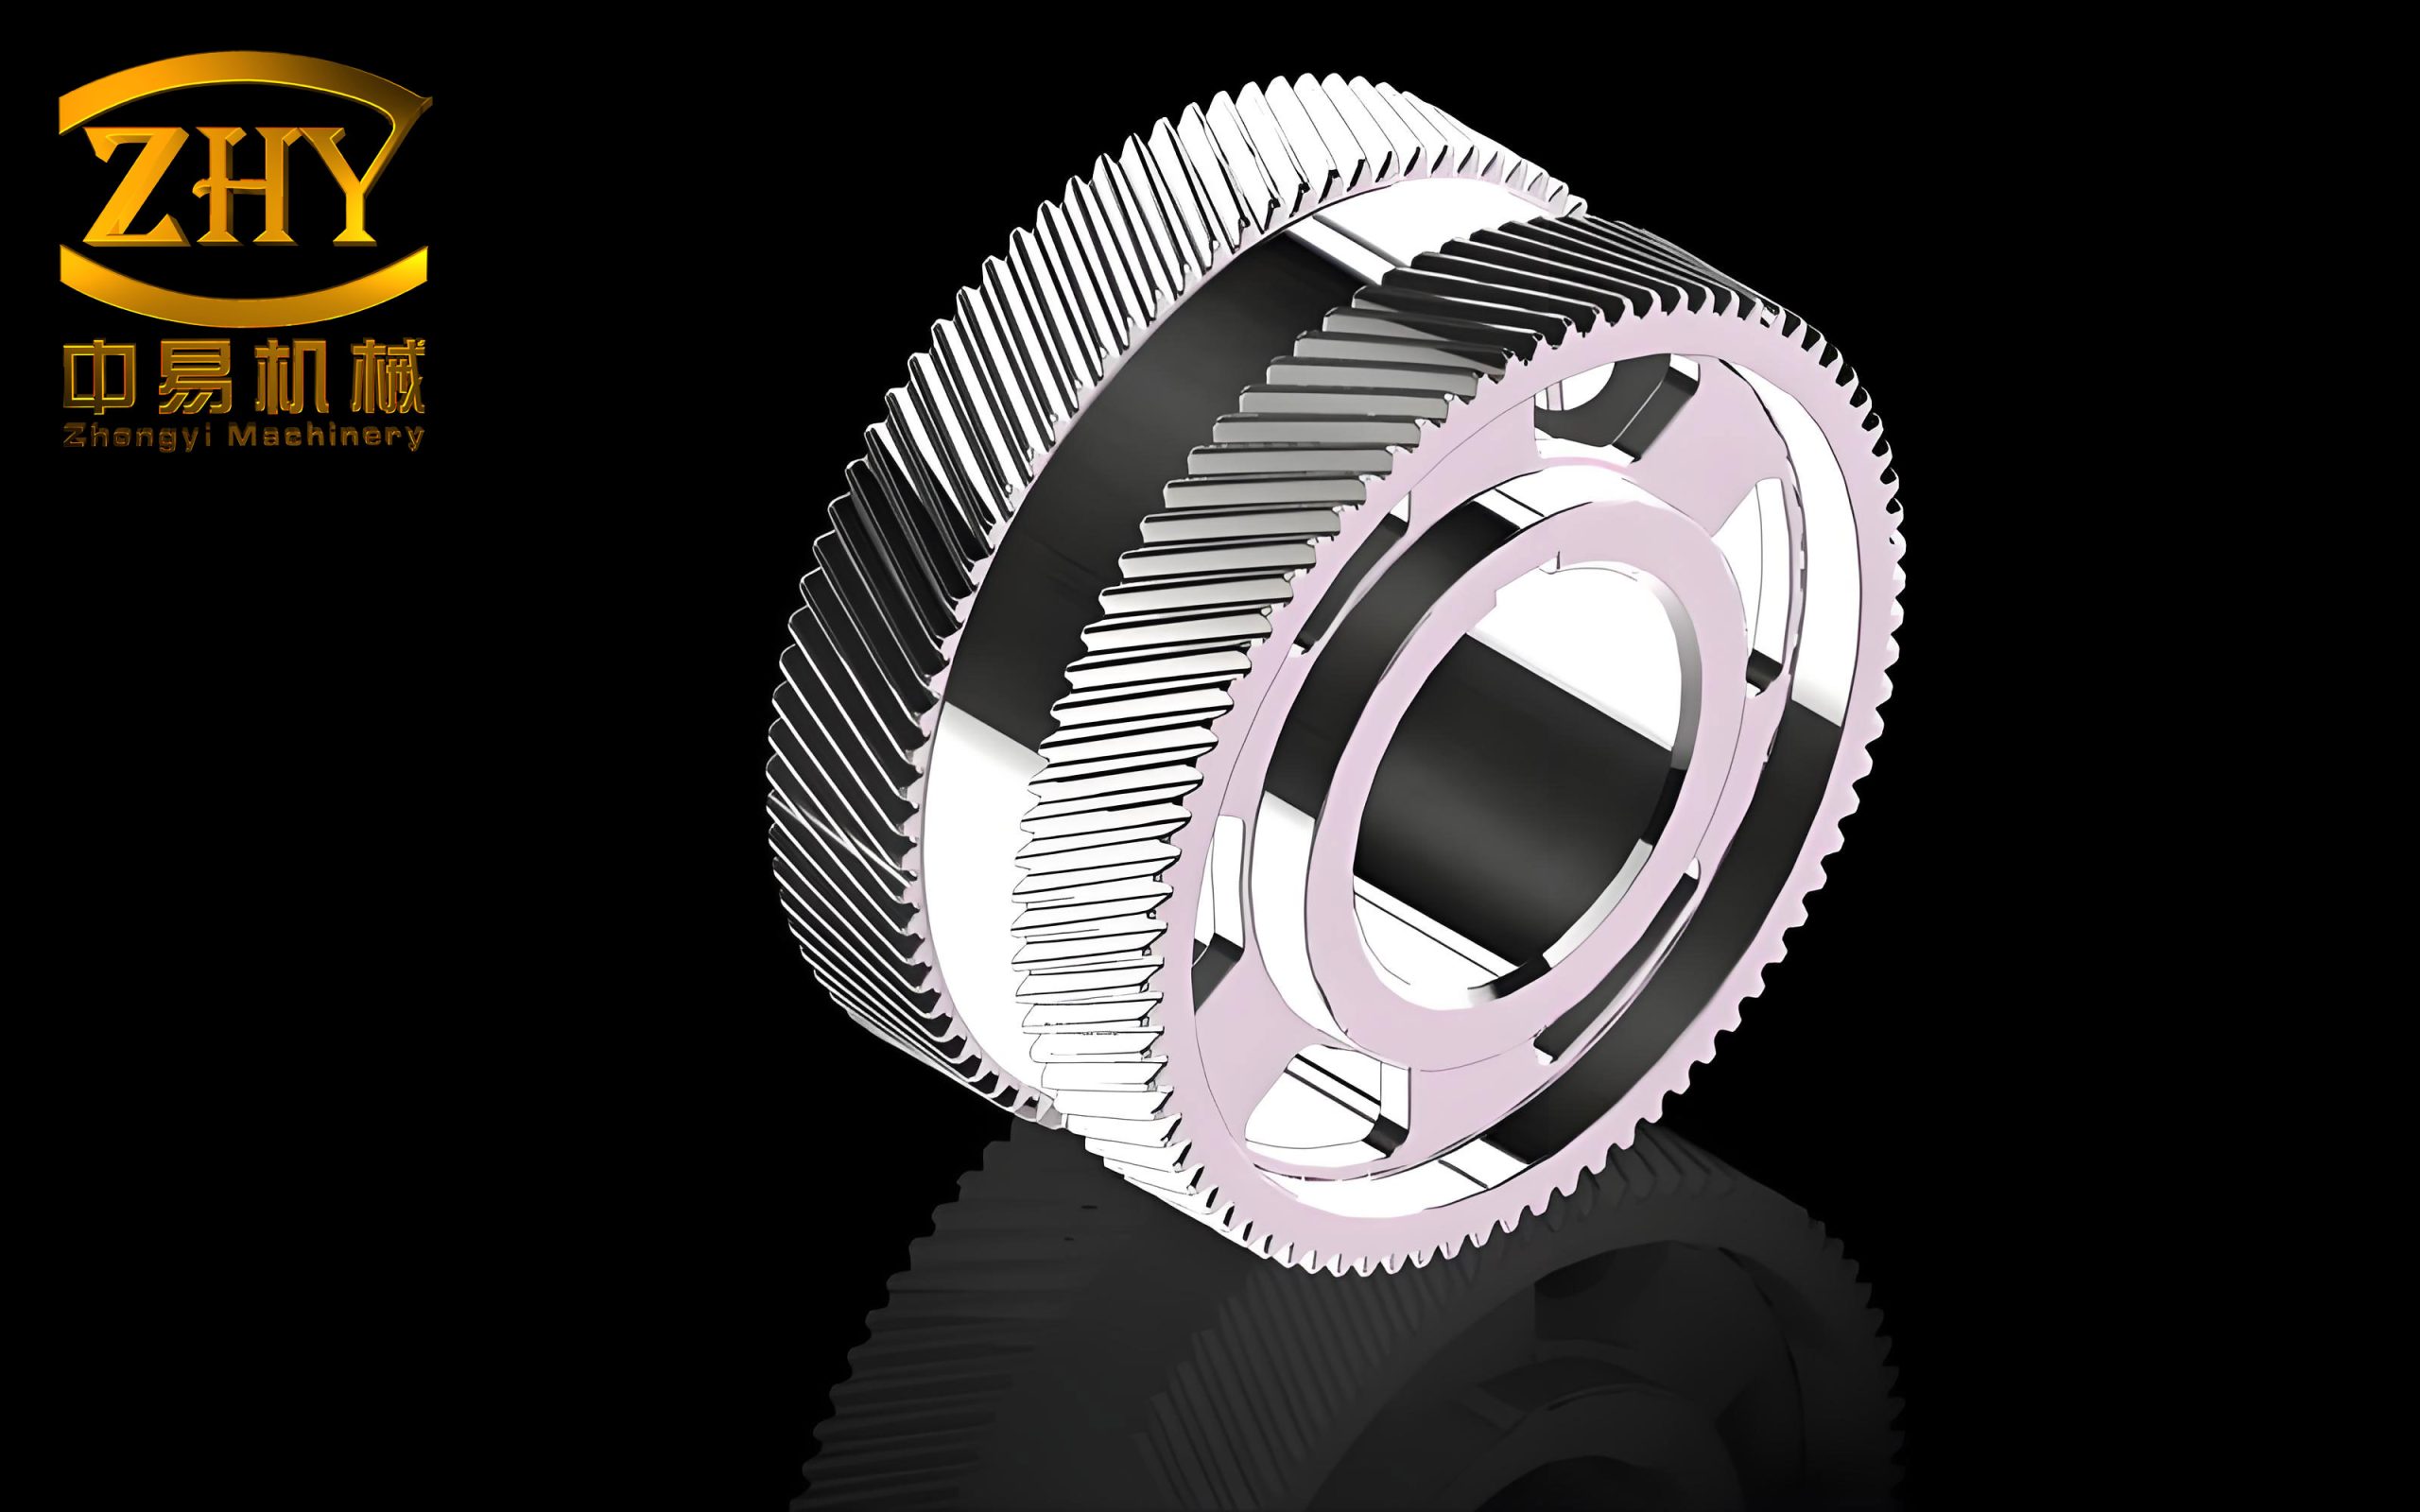
In modern industrial applications, gear systems are ubiquitous, serving as fundamental power transmission components across a vast spectrum of machinery. However, in high-speed and heavy-duty operating environments, the demands on gear material performance intensify significantly. The herringbone gear, owing to its inherently balanced axial thrust configuration and exceptional load-carrying capacity, coupled with superior transmission stability and efficiency, has become the preferred choice in aerospace, marine propulsion, and heavy machinery sectors. During high-speed heavy-load transmission, friction at the tooth surfaces generates substantial heat, elevating the thermal load experienced by gear teeth. Excessive temperatures compromise transmission efficiency, degrade lubricant performance, and induce tooth surface deformation, ultimately precipitating scuffing failure. This investigation centers on the herringbone gear transmission, integrating tooth contact analysis (TCA), load-bearing contact analysis (LTCA), thermal elastohydrodynamic lubrication (TEHL) theory, and the Blok flash temperature criterion to conduct comprehensive flash temperature calculations and scuffing assessments. The findings establish a robust theoretical foundation for subsequent herringbone gear system research and tooth profile modification design.
Fundamental Tooth Contact Analysis of Herringbone Gear
The herringbone gear used in this research consists of two mirrored helical gear halves with opposing helix angles, effectively canceling axial thrust. For the left and right tooth flanks, the basic gear parameters are summarized in Table 1.
| Parameter | Gear (Driven) | Pinion (Driving) |
|---|---|---|
| Helix direction | Left L / Right R | Left L / Right R |
| Number of teeth | 37 | 21 |
| Normal module (mm) | 20 | 20 |
| Normal pressure angle (°) | 20 | 20 |
| Helix angle (°) | 180 | 180 |
Within the reference coordinate systems \(S_r\), \(S_p\), and \(S_f\) respectively established for the pinion, gear, and rigid frame, the positional vector and unit normal vector of the tooth surfaces can be expressed as:
\[
\mathbf{r}_i(u_i, \theta_i) \in C^2, \quad
\mathbf{n}_i = \frac{\frac{\partial \mathbf{r}_i}{\partial u_i} \times \frac{\partial \mathbf{r}_i}{\partial \theta_i}}{\left| \frac{\partial \mathbf{r}_i}{\partial u_i} \times \frac{\partial \mathbf{r}_i}{\partial \theta_i} \right|}
\tag{1}
\]
where \(i = 1, 2\) denotes the pinion and gear, respectively. During continuous meshing, the positional vectors and unit normal vectors must coincide in the inertial frame:
\[
\mathbf{r}_{f1}(u_1, \theta_1, \phi_1) = \mathbf{r}_{f2}(u_2, \theta_2, \phi_2), \quad
\mathbf{n}_{f1}(u_1, \theta_1, \phi_1) = \mathbf{n}_{f2}(u_2, \theta_2, \phi_2)
\tag{2}
\]
The actual meshing line length \(B_1B_2\) on one side of the herringbone gear is determined by:
\[
B_1B_2 = \sqrt{r_{a1}^2 – r_{b1}^2} + \sqrt{r_{a2}^2 – r_{b2}^2} – a\sin\alpha_t
\tag{3}
\]
where \(r_{a1}\), \(r_{b1}\) and \(r_{a2}\), \(r_{b2}\) are the addendum circle radii and base circle radii of the pinion and gear, respectively; \(a\) is the center distance; and \(\alpha_t\) is the transverse pressure angle:
\[
\alpha_t = \arctan\left(\frac{\tan\alpha_n}{\cos\beta}\right)
\tag{4}
\]
For the herringbone gear, the total contact ratio comprises the transverse contact ratio \(\varepsilon_\alpha\) and the axial contact ratio \(\varepsilon_\beta\):
\[
\varepsilon_\alpha = \frac{B_1B_2}{P_b}, \quad
\varepsilon_\beta = \frac{m_n \sin\beta}{\pi}
\tag{5}
\]
\[
\varepsilon = \varepsilon_\alpha + \varepsilon_\beta
\tag{6}
\]
Substituting the gear parameters yields a base pitch \(P_b = 46.7\) mm and a total contact ratio \(\varepsilon = 2.88\), confirming that a minimum of two pairs of teeth are simultaneously engaged, with a maximum of three pairs. This high contact ratio significantly influences the contact line length variation during the meshing cycle.
For a single tooth, the contact line length evolution undergoes three distinct stages. When the contact point distance from the pinion center satisfies 158.1 mm \(\le R_C \le\) 177.8 mm, the contact line grows linearly:
\[
L_{T1} = \frac{L_x}{\sin\beta}
\tag{7}
\]
When 177.8 mm < \(R_C\) < 182.7 mm, the contact line length remains constant. Beyond this region, when 182.7 mm < \(R_C \le\) 220.6 mm, the contact line shortens according to:
\[
L_{T1} = \frac{\varepsilon_\beta P_b – L_x}{\sin\beta}
\tag{8}
\]
Figure 1 illustrates the single-tooth and total contact line length variations for the herringbone gear. The maximum total contact line length reaches 0.31 m, exhibiting periodic fluctuation that directly governs the load distribution and subsequent thermal behavior.
Load-Bearing Contact Analysis Based on Fine Mesh Discretization
When the left and right flanks of the herringbone gear contact at points \(M_L\) and \(M_R\), respectively, under external loads \(F_{ML}\) and \(F_{MR}\), the instantaneous contact points expand into elliptical contact regions due to elastic deformation. Based on Hertz contact theory, the semi-major and semi-minor axes of the contact ellipse are:
\[
a_{L/R} = k_{aL/R} \sqrt[3]{\frac{3F_{ML/R}}{E_c(A_{L/R} + B_{L/R})}}, \quad
b_{L/R} = k_{bL/R} \sqrt[3]{\frac{3F_{ML/R}}{E_c(A_{L/R} + B_{L/R})}}
\tag{9}
\]
where \(A_{L/R}\) and \(B_{L/R}\) are the contact ellipse equation coefficients, \(E_c\) is the equivalent elastic modulus, and the load balance condition requires:
\[
\sum_{k=1}^{s} F_{ML}^{k} + \sum_{k=1}^{s} F_{MR}^{k} = F_n
\tag{10}
\]
To accurately determine the localized contact pressure distribution, the elliptical contact region is discretized into \(m \times n\) small rectangular domains. Each rectangle has dimensions \(dx = 2a/m\) and \(dy = 2b/n\), enabling the displacement at any point to be expressed as:
\[
u_{L/R}(x, y) = \int_{S_{ij}} F_{ijL/R} \cdot Z_{L/R}(X_{ij}, Y_{ij}) \, ds
\tag{11}
\]
The relative sliding velocity between the pinion and gear tooth surfaces at the contact point is derived from the absolute tangential velocities:
\[
\mathbf{v}_{c} = \mathbf{v}_{tM1} – \mathbf{v}_{tM2}
\tag{12}
\]
where the tangential velocities are obtained by removing the normal component from the absolute velocities:
\[
\mathbf{v}_{tMi} = \mathbf{v}_{Mi} – (\mathbf{v}_{Mi} \cdot \mathbf{n}_{Mi}) \mathbf{n}_{Mi}, \quad i = 1, 2
\tag{13}
\]
The comprehensive curvature radius at the contact point follows from the principal curvatures of both mating surfaces:
\[
\rho_{red} = \frac{1}{\rho_1^{-1} + \rho_2^{-1}}
\tag{14}
\]
For the present system operating at 1000 r/min, the relative sliding velocity exhibits a parabolic profile along the contact path, reaching maximum values near the mesh entry and exit regions while approaching zero at the pitch point. Similarly, the comprehensive curvature radius increases progressively from mesh entry, achieving its maximum near the pitch point before declining.
For load-bearing contact analysis, the displacement compatibility condition for both left and right flanks is established as:
\[
\begin{cases}
u_{ijL}^{k} + u’_{ijL}^{k} + w_{ijL}^{k} = u_{L}^{k}(x, y) + d_{ijL}^{k} \\
u_{ijR}^{k} + u’_{ijR}^{k} + w_{ijR}^{k} = u_{R}^{k}(x, y) + d_{ijR}^{k}
\end{cases}
\tag{15}
\]
The flexibility coefficients incorporate both bending and shear compliance, yielding the matrix formulation:
\[
[\lambda]^{\phi_1}[F]^{\phi_1} + [w]^{\phi_1} = [u]^{\phi_1} + [d]^{\phi_1}
\tag{16}
\]
A critical concern in herringbone gear operation is the lateral load distribution between the left and right flanks. When support deformations induce shaft misalignment, the left and right flanks experience unequal loads, generating an axial force differential:
\[
\Delta F_z = \sum_{k=1}^{s} \sum_{i,j=1}^{m,n} F_{ijL}^{k} \cos\alpha_j – \sum_{k=1}^{s} \sum_{i,j=1}^{m,n} F_{ijR}^{k} \cos\alpha_j
\tag{17}
\]
To mitigate the resulting edge loading, an axial floating installation is adopted for the pinion. Introducing the axial float displacement \(\varepsilon\), the initial clearance is modified:
\[
w’^{k}_{ijL/R} = w^{k}_{ijL/R} + \varepsilon_n
\tag{18}
\]
The convergence criterion for acceptable load distribution is:
\[
\Delta = \frac{\Delta F_z}{F_n} \le 0.01\%
\tag{19}
\]
The load distribution coefficient at any contact position is defined as:
\[
L_{M}^{k} = \frac{\sum_{i,j=1}^{m,n} F_{ijL/R}^{k}}{F_n}
\tag{20}
\]
Figure 2 presents the load distribution coefficients for the left and right flanks under different horizontal shaft angle errors \(\Delta\theta\). When \(\Delta\theta = 0\), both flanks share equal loads. However, as the error increases, the left flank load coefficient rises while the right flank decreases, leading to pronounced edge loading. The axial floating installation effectively restores load symmetry, maintaining nearly identical load coefficients across both flanks. This balanced loading is essential for accurate flash temperature prediction and prevents premature scuffing failure.
| Shaft angle error Δθ (°) | Left flank load coefficient (mesh entry) | Right flank load coefficient (mesh entry) |
|---|---|---|
| 0 | 0.36 | 0.36 |
| 0.00094 | 0.38 | 0.34 |
| 0.00188 | 0.41 | 0.31 |
| 0.00376 | 0.44 | 0.28 |
Thermal Elastohydrodynamic Lubrication Characteristics
Lubrication plays a pivotal role in herringbone gear performance. At high speeds and heavy loads, the lubricating oil film separates the mating tooth surfaces, preventing direct metallic contact. However, the combined effects of viscous shear and compression generate significant internal energy within the oil film, raising its temperature. When the oil film ruptures, metal-to-metal contact initiates a cascade of thermal damage culminating in scuffing.
Governing Equations of TEHL
Based on the instantaneous elliptical contact model and treating the lubricant as a newtonian fluid with negligible inertia forces, the Reynolds equation governing the pressure distribution is:
\[
\frac{\partial}{\partial x}\left(\frac{\rho h^3}{12\eta} \frac{\partial p}{\partial x}\right) + \frac{\partial}{\partial y}\left(\frac{\rho h^3}{12\eta} \frac{\partial p}{\partial y}\right) = u_e \frac{\partial(\rho h)}{\partial x} + \frac{\partial(\rho h)}{\partial t}
\tag{21}
\]
The lubricant density follows the Dowson-Higginson relation:
\[
\rho = \rho_0 \left(1 + \frac{0.6 \times 10^{-9} p}{1 + 1.7 \times 10^{-9} p}\right) – 0.00065(T – T_0)
\tag{22}
\]
Similarly, the Roelands viscosity-temperature-pressure relationship is employed:
\[
\eta = \eta_0 \exp\left\{(\ln\eta_0 + 9.67)\left[\left(1 + \frac{p}{p_0}\right)^{Z_0} – 1\right] – S_0(T – T_0)\right\}
\tag{23}
\]
The film thickness equation accounts for the initial geometry and elastic deformation:
\[
h(x, y, t) = h_0(t) + h_g(x, y) + V_e(x, y, t)
\tag{24}
\]
The elastic deformation term is evaluated over the contact domain:
\[
V_e = \frac{2}{\pi E’} \iint_{\Omega} \frac{p(\xi, \zeta)}{\sqrt{(x-\xi)^2 + (y-\zeta)^2}} d\xi d\zeta
\tag{25}
\]
For complete formulation, the load balance equation ensures equilibrium:
\[
w = \iint_{\Omega} p(x, y) \, dxdy
\tag{26}
\]
The energy equation for the oil film includes convective and conductive heat transfer terms:
\[
\rho_f c_f \left(u \frac{\partial T}{\partial x} + v \frac{\partial T}{\partial y}\right) + \rho_f \frac{\partial T}{\partial z}\left(u_s – u_e\right) = k_f \frac{\partial^2 T}{\partial z^2} + \frac{T}{\rho_f} \frac{\partial \rho_f}{\partial T}\left(u \frac{\partial p}{\partial x}\right) + \eta\left(\frac{\partial u}{\partial z}\right)^2
\tag{27}
\]
For the solid gear bodies, the heat conduction equation applies:
\[
\rho_1 c_1 \left(u_{1e} \frac{\partial T}{\partial x} + u_{1s} \frac{\partial T}{\partial y}\right) = k_1 \frac{\partial^2 T}{\partial z^2}, \quad
\rho_2 c_2 \left(u_{2e} \frac{\partial T}{\partial x} + u_{2s} \frac{\partial T}{\partial y}\right) = k_2 \frac{\partial^2 T}{\partial z^2}
\tag{28}
\]
At the solid-liquid interfaces, the heat flux continuity condition must be satisfied:
\[
k_1 \left.\frac{\partial T}{\partial z}\right|_{z=0} = k_f \left.\frac{\partial T}{\partial z}\right|_{z=0}, \quad
k_2 \left.\frac{\partial T}{\partial z}\right|_{z=h} = k_f \left.\frac{\partial T}{\partial z}\right|_{z=h}
\tag{29}
\]
All governing equations are nondimensionalized to avoid truncation errors caused by the disparate orders of magnitude between pressure and film thickness. The dimensionless parameters include \(X = x/b\), \(Y = y/b\), \(P = p/p_H\), \(H = hR/b^2\), and \(T = T/T_0\).
Profiles of dimensionless oil film pressure and thickness for selected positions — the mesh entry point A, pitch point B, and mesh exit point C — are shown in Figure 3. The pressure distribution exhibits the characteristic Hertzian elliptical profile with a pronounced secondary pressure peak near the outlet region. The film thickness profile demonstrates rapid reduction in the entry zone, maintaining an approximately constant value throughout the Hertzian contact region, with a characteristic necking phenomenon at the outlet. Among the three positions, the mesh entry point A experiences the highest pressure and consequently the thinnest oil film.
| Position | Pressure peak (GPa) | Central film thickness (μm) | Center temperature rise (°C) |
|---|---|---|---|
| Mesh entry point A | 1.35 | 0.62 | 48.2 |
| Pitch point B | 1.02 | 0.85 | 5.6 |
| Mesh exit point C | 1.18 | 0.74 | 38.4 |
The temperature field analysis reveals that the oil film center temperature substantially exceeds the interface temperatures of both gear flanks throughout the Hertzian contact zone. In the entry region, temperatures remain essentially constant. Upon entering the high-pressure zone, temperatures surge abruptly, with the oil film temperature consistently above both solid surface temperatures. The pitch point exhibits minimal temperature rise due to the near-zero relative sliding velocity, although slight elevation occurs from oil compression. Downstream of the secondary pressure peak, all temperatures rapidly decay. The asymmetric temperature distribution underscores the importance of considering thermal effects in herringbone gear scuffing analysis.
Influence of Operating Conditions on TEHL
Employing the single-variable method, the effects of torque and rotational speed on the lubrication characteristics were systematically investigated. Table 3 summarizes the results at the critical mesh entry point A under varying torques while maintaining a constant speed of 1000 r/min.
| Torque (N·m) | Maximum film pressure (GPa) | Central film thickness (μm) | Center temperature rise (°C) |
|---|---|---|---|
| 500 | 0.82 | 0.79 | 22.5 |
| 1000 | 1.03 | 0.68 | 34.8 |
| 2000 | 1.28 | 0.55 | 52.3 |
Under constant speed, increasing torque produces higher film pressure, which in turn reduces film thickness and elevates oil film temperature. This coupling effect reflects the intensified friction and heat generation at elevated loads.
| Speed (r/min) | Maximum film pressure (GPa) | Central film thickness (μm) | Center temperature rise (°C) |
|---|---|---|---|
| 1500 | 1.02 | 0.70 | 31.2 |
| 2000 | 1.03 | 0.67 | 40.6 |
| 3000 | 1.03 | 0.62 | 56.8 |
When torque remains constant, the central film pressure remains nearly unaffected by speed variations. However, the secondary pressure peak shifts toward the entry region with increasing speed, causing a slight reduction in film thickness at the micron scale. The oil film center temperature, however, rises substantially with rotational speed, demonstrating that high-speed operation is a primary contributor to the thermal loading that may trigger scuffing.
Contact Flash Temperature Analysis of Herringbone Gear
Flash temperature, defined as the transient temperature rise at the contacting surfaces during meshing, is a critical parameter governing the anti-scuffing capacity of gear transmission systems. Under steady-state operating conditions, the tooth bulk temperature \(T_M\) remains relatively constant, while the instantaneous surface temperature fluctuates as the contact location traverses the tooth flank. This fluctuating component — the flash temperature \(T_f\) — is calculated using the Blok flash temperature theory adapted to the load-bearing contact analysis framework.
Blok Flash Temperature Formulation
Discretizing the elliptical contact region into individual rectangular elements, the Blok flash temperature formula at the center of each element \((i, j)\) is expressed as:
\[
T_{fij}^{k} = \frac{1.11 \mu_{mij}^{k} w_{ij}^{k} V_{ij}^{k} \left(V_{t1ij}^{k} – V_{t2ij}^{k}\right)}{\left(B_1 V_{t1ij}^{k}\right)^{0.5} + \left(B_2 V_{t2ij}^{k}\right)^{0.5}} \cdot \frac{1}{\sqrt{b^k}}
\tag{30}
\]
where \(\mu_{mij}^{k}\) is the mean local friction coefficient, \(w_{ij}^{k}\) is the load density at the discrete point, \(V_{t1ij}^{k}\) and \(V_{t2ij}^{k}\) are the tangential velocities of the pinion and gear surfaces, \(b^k\) is the contact semi-width, and \(B_1\), \(B_2\) are the thermal contact coefficients taken as 13.6 N/(mm·S⁰·⁵·K) for surface-hardened gears.
The friction coefficient is evaluated from:
\[
\mu_{mij}^{k} = 0.12 \left(w_{ij}^{k} R_a \cos\alpha_n / \eta_a V_{ij}^{k} R_a\right)^{0.25}
\tag{31}
\]
where \(R_a\) is the surface roughness and \(\eta_a\) is the oil dynamic viscosity at bulk temperature.
Applying the axial floating installation to ensure balanced load distribution between the left and right flanks, the flash temperature distribution for the herringbone gear under 1000 r/min and 5000 N·m is obtained. The flash temperature profile across the contact path exhibits a characteristic V-shape with inflection: the flash temperature peaks at mesh entry, reaches its minimum value near the pitch point, and then increases again toward mesh exit. The highest flash temperature occurs at the mesh entry, reaching approximately \(102^\circ\text{C}\), where the combined effects of high contact stress, small comprehensive curvature radius, and substantial relative sliding velocity converge. The flash temperature at the pitch point is approximately \(0.6^\circ\text{C}\), deviating slightly from zero due to the elastic deformation-induced relative displacement.
Validation of the Computational Method
To validate the proposed methodology, the flash temperature results obtained from the load-bearing contact analysis were benchmarked against three independent approaches: Romax simulation results, thermal elastohydrodynamic lubrication calculations, and traditional ISO standard methods. Table 5 presents the comparison at characteristic meshing positions.
| Position | Blok-LTCA (°C) | Romax (°C) | TEHL (°C) | ISO (°C) |
|---|---|---|---|---|
| Mesh entry | 102 | 96 | 108 | 98 |
| Pitch point | 0.6 | 0 | 0 | 0 |
| Mesh exit | 45 | 43 | 48 | 42 |
At the mesh entry, the maximum deviation between the Blok-LTCA method and the other three approaches is only \(6^\circ\text{C}\) (approximately 5.5%), well within acceptable engineering tolerance. At mesh exit, the deviations reduce to \(2\text{–}3^\circ\text{C}\). Notably, the herringbone gear flash temperature at the pitch point remains non-zero in the Blok-LTCA calculation, consistent with the thermal elastohydrodynamic approach, since elastic deformation and the resulting relative motion occur even at the theoretical pitch point. This consistency across multiple methodologies confirms the accuracy and reliability of the load-bearing contact analysis-based Blok flash temperature calculation.
Parametric Influence on Flash Temperature
Systematic parametric studies were conducted to identify the key operational and geometric factors affecting herringbone gear flash temperature.
First, when torque varies (\(T_1 = 3000\), \(T_2 = 5000\), \(T_3 = 10000\) N·m) at constant speed (1000 r/min), the maximum flash temperature escalates from \(70^\circ\text{C}\) to \(102^\circ\text{C}\) and further to \(171^\circ\text{C}\). This dramatic increase is attributed to the elevated load density and friction coefficient at higher torques, which intensify heat generation at the tooth surfaces. The torque parameter exerts a dominant influence on flash temperature due to its direct scaling of contact pressure.
| Torque (N·m) | Maximum flash temperature (°C) | Flash temperature at mesh exit (°C) |
|---|---|---|
| 3000 | 70 | 30 |
| 5000 | 102 | 45 |
| 10000 | 171 | 78 |
Second, when speed varies (\(n = 1000\), \(2000\), \(3000\) r/min) at constant torque (5000 N·m), the maximum flash temperature increases from \(102^\circ\text{C}\) to \(118^\circ\text{C}\) and \(131^\circ\text{C}\), respectively. While speed affects flash temperature significantly, its influence is comparatively weaker than torque within the examined range.
| Speed (r/min) | Maximum flash temperature (°C) |
|---|---|
| 1000 | 102 |
| 2000 | 118 |
| 3000 | 131 |
Third, the influence of surface roughness was examined for \(R_a = 0.3\), \(0.5\), and \(0.8\) μm under identical operating conditions. The flash temperature exhibits a monotonic increase with surface roughness, as rougher surfaces produce higher friction coefficients and consequently more frictional heat. The sensitivity is most pronounced at mesh entry, where the flash temperature changes most rapidly. This finding highlights the importance of surface finishing in mitigating thermal risks.
Scuffing Assessment under High-Speed Heavy-Duty Conditions
The scuffing propensity of the herringbone gear transmission is evaluated using the maximum contact temperature criterion:
\[
T_{f\max} = T_M + T_{f\max} \le T_S
\tag{32}
\]
The critical scuffing temperature is determined from the Castro relation:
\[
T_S = 26.2 \ln(\nu_{40})
\tag{33}
\]
where \(\nu_{40}\) is the kinematic viscosity of the lubricant at \(40^\circ\text{C}\) in cSt. For the selected FVA345 M320 (ISO VG 320) lubricant, \(\nu_{40} = 327 \text{ mm}^2/\text{s}\), yielding \(T_S = 152^\circ\text{C}\).
With a bulk temperature of \(60^\circ\text{C}\), three operating conditions were assessed:
| Condition | Speed (r/min) | Torque (N·m) | Maximum contact temperature (°C) | Scuffing risk |
|---|---|---|---|---|
| Condition I | 1000 | 3000 | 130 | No scuffing |
| Condition II | 1000 | 5000 | 162 | Scuffing risk |
| Condition III | 2000 | 5000 | 178 | Scuffing risk |
For the nominal operating condition (1000 r/min, 5000 N·m), the maximum contact temperature of \(162^\circ\text{C}\) exceeds the critical scuffing temperature of \(152^\circ\text{C}\), indicating that scuffing failure is likely at the highly stressed mesh entry region. The scuffing-prone zone is concentrated at the initial meshing contact, where the combination of small comprehensive curvature radius, elevated contact pressure, and high relative sliding velocity produces the maximum flash temperature. This observation provides critical insight for subsequent tooth profile modification strategies to reduce flash temperature and enhance scuffing resistance.
Conclusions
This comprehensive investigation into the contact flash temperature of herringbone gear transmission systems has yielded the following principal findings:
(1) The herringbone gear configuration exhibits a total contact ratio of 2.88, confirming simultaneous engagement of at least two tooth pairs with occasional three-pair meshing. The total contact line length varies periodically with a maximum value of 0.31 m, directly influencing load sharing and thermal behavior along the contact path.
(2) The load-bearing contact analysis, incorporating the axial floating installation for the pinion, effectively balances the load distribution between left and right flanks of the herringbone gear, mitigating edge loading. Without floating installation, increasing shaft misalignment progressively concentrates load toward one flank, with load coefficients deviating by up to 30% at \(\Delta\theta = 0.00376^\circ\). The axial floating approach restores load symmetry, ensuring that the left and right tooth flanks experience nearly identical loading — an essential prerequisite for reliable flash temperature prediction.
(3) Thermal elastohydrodynamic analysis reveals that the mesh entry position corresponds to maximum oil film pressure (1.35 GPa), minimum film thickness (0.62 μm), and highest film temperature (48.2°C rise) among the characteristic meshing positions. Increasing torque elevates film pressure and temperature while decreasing film thickness; increasing speed preserves the central pressure while modestly thinning the film and significantly raising the temperature. These results emphasize the coupled thermal-lubrication behavior inherent in high-speed heavy-duty herringbone gear operation.
(4) The Blok flash temperature method integrated with load-bearing contact analysis yields flash temperature distributions that closely match Romax simulations, thermal elastohydrodynamic calculations, and traditional ISO standards, with maximum deviation not exceeding 6%. The flash temperature peaks at mesh entry (approximately \(102^\circ\text{C}\) for the nominal condition at 1000 r/min, 5000 N·m), reaches near-zero at the pitch point (0.6°C), and rises again toward mesh exit. Torque exerts the dominant influence on flash temperature, followed by rotational speed and surface roughness.
(5) Scuffing assessment using the maximum contact temperature criterion indicates that the herringbone gear transmission operating at 1000 r/min and 5000 N·m is susceptible to scuffing failure, with the maximum contact temperature reaching \(162^\circ\text{C}\) against the critical scuffing temperature of \(152^\circ\text{C}\). The mesh entry region represents the most vulnerable zone, providing a clear target for tooth profile modification and lubrication optimization in future designs to enhance the load-carrying capacity and operational reliability of herringbone gear transmission systems.