
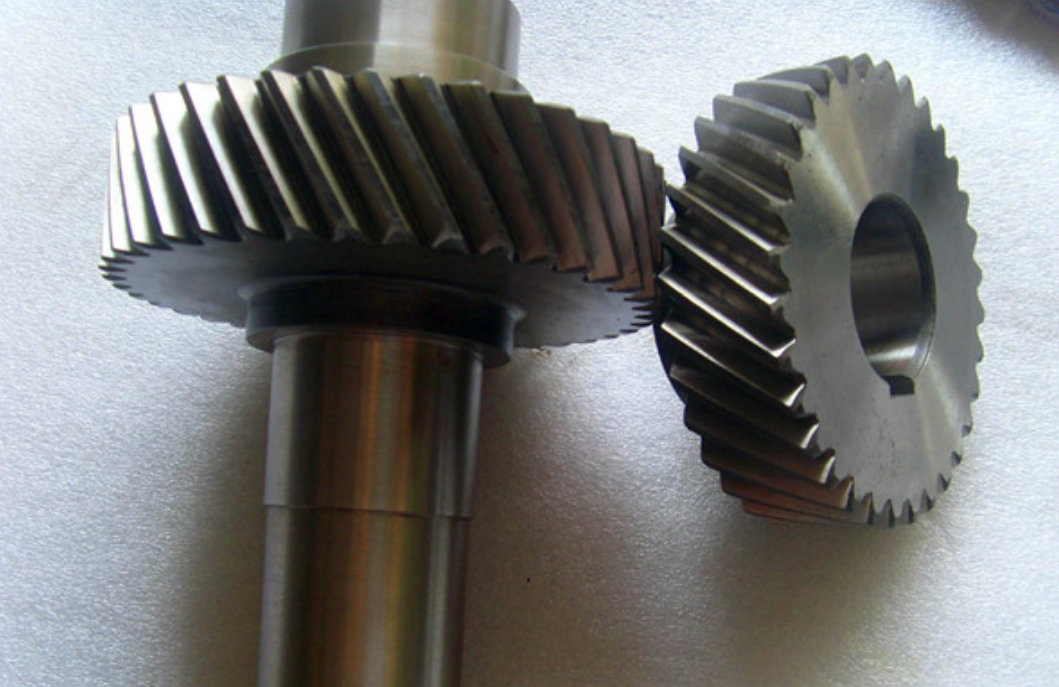
In the field of precision gear manufacturing, the internal power honing process using an internal honing wheel has emerged as a critical finishing technique to enhance gear quality, reduce noise, and lower production costs. This process essentially mimics the meshing action of an internal helical gear pair, where the honing wheel and the workpiece gear engage under controlled pressure. Understanding the contact stress distribution on the tooth surface of the workpiece gear during this simulated meshing is paramount for optimizing the honing process, controlling gear errors such as root undercutting and mid-profile concavity, and ultimately improving the performance and longevity of gears. In this study, we adopt a first-person perspective as researchers investigating this phenomenon. We propose to model the internal power honing process as an internal meshing helical gear transmission. Our primary objective is to theoretically and numerically analyze the distribution of contact stresses on the tooth flank of the external helical gear (representing the workpiece) when meshing with a large internal helical gear (representating the honing wheel). We will employ classical Hertzian contact theory to derive analytical expressions for stress, introduce a pressure ratio coefficient to map stress along the path of contact, and finally, validate and expand upon these findings using detailed three-dimensional finite element analysis (FEA). The keyword ‘helical gear’ is central to this investigation, as the helical tooth geometry fundamentally influences the contact conditions, load distribution, and stress patterns compared to spur gears.
The internal honing process for helical gear finishing offers significant advantages over traditional grinding, including better surface integrity and lower thermal damage. However, the complex interaction between the honing wheel’s abrasive surface and the workpiece gear tooth leads to non-uniform material removal, which is directly influenced by the contact pressure distribution. If the contact stress is excessively high in certain regions, such as the tooth root or near the pitch line, it can lead to over-honing, resulting in geometric errors like root relief (undercut) or a concave tooth profile. Therefore, a thorough mechanical analysis of the contact conditions is essential. While extensive research exists on stress analysis for external spur and helical gear pairs, studies focusing specifically on internal meshing configurations, especially in the context of simulating honing dynamics, are relatively scarce. This work aims to bridge that gap by providing a comprehensive analysis from first principles to advanced numerical simulation.
We begin our analysis by establishing the fundamental geometric and kinematic parameters of the internal helical gear pair. The model consists of a fixed internal ring gear (analogous to the honing wheel) with a relatively large number of teeth, denoted as \(z_2\), and an external helical gear (the workpiece) with a smaller number of teeth, \(z_1\). The basic parameters are defined in the following table. Note that all gears share common module and pressure angle values to isolate the effect of tooth count difference, \(\Delta z = z_2 – z_1\).
| Component | Normal Module, \(m_n\) (mm) | Normal Pressure Angle, \(\alpha_n\) (°) | Helix Angle, \(\beta\) (°) | Number of Teeth, \(z\) |
|---|---|---|---|---|
| Internal Helical Gear | 2.25 | 17.5 | 41.722 | 123 (\(z_2\)) |
| External Helical Gear (Case 1) | 2.25 | 17.5 | 33 | 13 (\(z_1\)) |
| External Helical Gear (Case 2) | 2.25 | 17.5 | 33 | 33 (\(z_1\)) |
| External Helical Gear (Case 3) | 2.25 | 17.5 | 33 | 73 (\(z_1\)) |
| External Helical Gear (Case 4) | 2.25 | 17.5 | 33 | 103 (\(z_1\)) |
The contact analysis for a helical gear pair is more complex than for spur gears due to the inclined tooth trace. The contact occurs along a line that moves across the tooth face. A key parameter governing the smoothness of load transfer and stress distribution is the transverse contact ratio, \(\epsilon_{\alpha}\). For an internal meshing helical gear pair, the transverse contact ratio is given by:
$$ \epsilon_{\alpha} = \frac{1}{2\pi} \left[ z_1 \left( \frac{\tan\alpha_{at1}}{\cos\beta_{b1}} – \frac{\tan\alpha_{t1}}{\cos\beta_{b1}} \right) – z_2 \left( \frac{\tan\alpha_{at2}}{\cos\beta_{b2}} – \frac{\tan\alpha_{t2}}{\cos\beta_{b2}} \right) \right] $$
where \(\alpha_{at1}, \alpha_{at2}\) are the transverse pressure angles at the addendum circles, \(\alpha_{t1}, \alpha_{t2}\) are the operating transverse pressure angles, and \(\beta_{b1}, \beta_{b2}\) are the base helix angles. For continuous transmission without interruption, \(\epsilon_{\alpha} \ge 1\). For our specific geometric parameters, we calculate the contact ratio for the four different external helical gear cases meshing with the fixed internal gear. The results are summarized below, showing a clear trend of increasing contact ratio with decreasing tooth count difference \(\Delta z\).
| External Gear Teeth, \(z_1\) | Tooth Difference, \(\Delta z\) | Transverse Contact Ratio, \(\epsilon_{\alpha}\) |
|---|---|---|
| 13 | 110 | 1.997 |
| 33 | 90 | 2.117 |
| 73 | 50 | 2.184 |
| 103 | 20 | 2.204 |
The foundation of our contact stress calculation is the classical Hertzian theory for elastic contact between two curved surfaces. The maximum contact pressure \(\sigma_H\) at any point is proportional to the square root of the load per unit length divided by the effective radius of curvature. For a helical gear pair, we first calculate the stress at the pitch point \(P\), a standard reference location. The formula is:
$$ \sigma_H = Z_E \sqrt{ \frac{P_{ca}}{\Sigma \rho} } $$
Here, \(Z_E\) is the elasticity factor (189.8 \(\sqrt{\text{MPa}}\) for steel-steel contact), \(P_{ca}\) is the calculated load per unit length of the contact line, and \(\Sigma \rho\) is the sum of the reciprocals of the principal curvatures at the contact point, often expressed as the comprehensive curvature \(1/\rho_{\Sigma}\). For a pair of helical gear teeth in contact, the load per unit length accounts for the fact that the total load is distributed over the instantaneous contact line. The average length of the contact line \(L\) for a helical gear is given by:
$$ L = \frac{b \epsilon_{\alpha}}{\cos \beta_b} $$
where \(b\) is the face width (27 mm in our study). The load per unit length is then \(P_{ca} = K’ F_n / L\), where \(F_n\) is the total normal load applied (1000 N) and \(K’\) is an application factor (1.7152). The comprehensive curvature at the pitch point for internal meshing is calculated from the radii of curvature \(\rho_1\) and \(\rho_2\) of the two tooth profiles at that point:
$$ \frac{1}{\rho_{\Sigma}} = \frac{1}{\rho_1} – \frac{1}{\rho_2} $$
$$ \rho_1 = \frac{m_n z_1 \sin \alpha_t}{2 \cos \beta \cos \beta_b}, \quad \rho_2 = \frac{m_n z_2 \sin \alpha_t}{2 \cos \beta \cos \beta_b} $$
Substituting all parameters, we compute the pitch point contact stress \(\sigma_H\) for the four cases. The results are presented in the following table, illustrating a significant decrease in pitch point stress as the tooth difference \(\Delta z\) decreases (i.e., as \(z_1\) increases). This is a direct consequence of the increased contact ratio and the change in geometric curvature.
| External Helical Gear Teeth, \(z_1\) | Load per Unit Length, \(P_{ca}\) (N/mm) | Pitch Point Contact Stress, \(\sigma_H\) (MPa) |
|---|---|---|
| 13 | 27.186 | 354.8 |
| 33 | 25.645 | 201.9 |
| 73 | 24.851 | 112.3 |
| 103 | 24.627 | 78.03 |
The stress at the pitch point is only one data point on the entire path of contact. To understand the complete stress distribution along the tooth profile from the root to the tip of the external helical gear, we introduce a pressure ratio coefficient \(\zeta\). This coefficient relates the contact stress \(\sigma_K\) at any arbitrary point \(K\) on the path of contact to the stress at the pitch point \(\sigma_H\). The fundamental Hertzian relationship states that stress is proportional to \(\sqrt{1/\rho_{\Sigma K}}\), where \(\rho_{\Sigma K}\) is the comprehensive curvature at point \(K\). Therefore, the ratio is:
$$ \zeta = \frac{\sigma_K}{\sigma_H} = \sqrt{ \frac{1/\rho_{\Sigma K}}{1/\rho_{\Sigma}} } = \sqrt{ \frac{\rho_{\Sigma}}{\rho_{\Sigma K}} } $$
Thus, \(\sigma_K = \zeta \cdot \sigma_H\). To find \(\zeta\), we need to calculate \(1/\rho_{\Sigma K}\) along the path of contact. Let \(l\) be the distance from the pitch point \(P\) to the point of interest \(K\) along the line of action. Following the established gear geometry, the radii of curvature for the external and internal helical gear at point \(K\) are:
$$ \rho_{1K} = \rho_1 + l, \quad \rho_{2K} = \rho_2 – l $$
The comprehensive curvature at \(K\) is then:
$$ \frac{1}{\rho_{\Sigma K}} = \frac{1}{\rho_{1K}} – \frac{1}{\rho_{2K}} = \frac{1}{\rho_1 + l} – \frac{1}{\rho_2 – l} $$
The range of \(l\) is determined by the start and end points of the path of contact. The total length of the path of contact \(g_{\alpha}\) can be derived from gear geometry. For a helical gear, this is related to the transverse contact ratio: \(g_{\alpha} = \epsilon_{\alpha} p_{bt}\), where \(p_{bt}\) is the transverse base pitch. The distance from the pitch point to the start of contact (root approach point for the external gear) is denoted \(l_1\), and to the end of contact (tip recess point) is \(l_2\). Their calculation involves the gear addendum radii and base circle radii.
We implemented this calculation algorithmically for our four gear pairs. The variation of the pressure ratio coefficient \(\zeta\) along the normalized path of contact (from the tooth root to the tip of the external helical gear) reveals crucial insights. The results are best understood by separating the cases based on the transverse contact ratio \(\epsilon_{\alpha}\).
For cases where \(\epsilon_{\alpha} \ge 2\) (i.e., \(z_1 = 33, 73, 103\)), the gear pair is always in a state of double-tooth contact throughout the mesh cycle. The plot of \(\zeta\) versus position shows a smoothly decreasing curve from the tooth root towards the tip. Specifically, the maximum value of \(\zeta\) (approximately 1.4) occurs at the tooth root region, meaning the stress there is about 1.4 times the pitch point stress. The minimum value (approximately 0.8) occurs at the tooth tip. Therefore, for these helical gear pairs with high contact ratio, the most critically stressed region is the fillet area near the root.
For the case where \(\epsilon_{\alpha} < 2\) (i.e., \(z_1 = 13\), with \(\epsilon_{\alpha}=1.997\)), there exists a region along the path of contact near the pitch point where only a single tooth pair carries the entire load. In this single-pair contact zone, the load per unit length \(P_{ca}\) effectively doubles compared to the double-pair zones. Our analysis incorporates this by adjusting the load factor in the single-pair region. The resulting plot of \(\zeta\) shows a distinct spike or discontinuity near the pitch point. The stress in the single-pair zone becomes significantly higher—approximately 2.8 times the nominal pitch point stress calculated under the assumption of double-pair load sharing. Consequently, for this helical gear pair with a large tooth difference and contact ratio just below 2, the most severe contact stresses appear in two locations: the highest peak is at the tooth root, and a secondary, sudden peak occurs in the region around the pitch line due to the single-pair contact condition.
To summarize the analytical stress distribution:
| Condition (\(\epsilon_{\alpha}\)) | Maximum Stress Location on External Helical Gear | Stress Characteristics | Implication for Honing |
|---|---|---|---|
| \(\epsilon_{\alpha} \ge 2\) (e.g., z1=33,73,103) | Tooth root (fillet region) | Stress highest at root, gradually decreases towards tip. No sudden spikes. | Risk of excessive material removal at root, potentially causing undercut. |
| \(1 \le \epsilon_{\alpha} < 2\) (e.g., z1=13) | 1. Tooth root 2. Pitch line region |
Root stress is highest. A sharp stress increase occurs around pitch line due to single-pair contact. | High risk of creating a concave tooth profile error (mid-profile dip) due to over-honing at pitch line. |
The theoretical analysis based on Hertzian contact provides valuable insights but relies on simplifications such as assuming perfectly smooth surfaces and a perfectly aligned line contact. To verify these findings and visualize the actual stress contours on a three-dimensional helical gear tooth model, we conducted a series of finite element analyses. We constructed precise 3D solid models of the internal meshing pairs for three representative cases: \(z_1 = 13, 33,\) and \(73\). The model for \(z_1=103\) was omitted due to potential geometric interference issues in a perfect involute model, which in practice would require profile modification on the internal gear (honing wheel). The models were created using CAD software, focusing on the accurate generation of involute helical tooth surfaces.
For computational efficiency, we did not model the entire gears. Instead, we imported the CAD models into ANSYS and strategically extracted a segment containing several teeth in full mesh and partial mesh. This segment was meshed with high-quality, fine hexahedral elements, particularly refined in the contact regions near the tooth surfaces. The material properties were assigned as those of steel: Young’s modulus \(E = 212\) GPa, Poisson’s ratio \(\nu = 0.289\), and density \(\rho = 7860\) kg/m³. The boundary conditions simulated the internal meshing: the internal gear segment was fully constrained in all degrees of freedom. A rotational torque was applied to the external helical gear segment about its axis, corresponding to the nominal normal load \(F_n\). The contact between the tooth flanks was defined as frictional surface-to-surface contact. We performed static structural analyses to obtain the von Mises stress distribution on the tooth surface of the external helical gear.
The FEA results provided vivid stress contour plots. For all three cases, the maximum stresses were consistently observed in the tooth root fillet region, corroborating the theoretical prediction that the root is a critical zone. However, the distribution along the face width was not uniform as assumed in the line-contact theory; the stress was more concentrated towards the central region of the face width. This highlights a practical aspect for honing: an axial reciprocating motion of the workpiece gear is necessary during honing to ensure uniform material removal across the entire tooth flank and to achieve good lead (tooth alignment) quality.
Comparing the magnitude of stresses among the cases, the FEA results aligned well with the theoretical trend. The gear pair with the largest tooth difference (\(z_1=13, \Delta z=110\)) exhibited the highest stress magnitudes, both at the root and in the region adjacent to the pitch line. The stress contour for this case clearly showed an elevated stress band near the pitch line, corresponding to the theoretical spike predicted by the pressure ratio analysis for \(\epsilon_{\alpha} < 2\). For the cases with \(z_1=33\) and \(73\), where \(\epsilon_{\alpha} > 2\), the stress distribution was more graded from root to tip without a pronounced secondary peak at the pitch line. The following table compares the theoretical pitch point and root stresses with the approximate maximum stresses from FEA for the analyzed cases. The values are in good agreement, validating our analytical approach.
| External Helical Gear Teeth, \(z_1\) | Theoretical \(\sigma_H\) at Pitch Point (MPa) | Theoretical Max \(\sigma_K\) at Root (via \(\zeta\), MPa) | FEA Approx. Max Stress at Root (MPa) | FEA Observation Near Pitch Line |
|---|---|---|---|---|
| 13 | 354.8 | ~495.6 | ~499.2 | Significant stress concentration |
| 33 | 201.9 | ~282.7 | ~281.5 | No distinct concentration |
| 73 | 112.3 | ~157.2 | ~157.0 | No distinct concentration |
The finite element analysis also revealed that the actual contact pattern for a helical gear pair is an elliptical patch that sweeps across the tooth face, rather than a perfect line. The stress within this patch is highest at its center. This localized high-pressure zone explains why honing, which is a abrasive process sensitive to pressure, can lead to localized over-removal if not managed properly. The combination of high root stress and potential pitch line stress concentration for low-contact-ratio pairs provides a direct mechanical explanation for two common honing errors: root undercutting and mid-profile concavity.
Based on our combined theoretical and numerical investigation into the contact mechanics of internal meshing helical gear pairs, we can draw several important conclusions with direct implications for the internal power honing process.
First, the tooth count difference \(\Delta z\) between the internal honing wheel and the external workpiece helical gear is a primary factor controlling the contact stress distribution. A large \(\Delta z\) results in a lower transverse contact ratio (\(\epsilon_{\alpha}\) often less than 2). In this regime, the most severe contact stresses occur at two locations: the absolute maximum is at the tooth root, and a secondary, sharp increase occurs in the region around the pitch line due to the single-pair contact condition. This pitch line stress spike is a key driver for the formation of a concave tooth profile error during honing, as the increased local pressure accelerates abrasive removal in that zone.
Second, when \(\Delta z\) is smaller, leading to a contact ratio of 2 or greater, the single-pair contact zone is eliminated. The stress distribution becomes smoother along the profile, with the tooth root remaining the zone of maximum stress, but without the dangerous spike near the pitch line. Therefore, to minimize the risk of inducing mid-profile concavity, the honing process should be designed with a gear pair configuration where the contact ratio is ideally greater than or equal to 2. This often means selecting a honing wheel with a tooth count that is not excessively larger than the workpiece gear.
Third, our 3D finite element analysis confirmed the theoretical stress trends and provided additional practical insight. The contact stress on a helical gear tooth is not uniformly distributed along the face width but tends to concentrate in the central region. This underscores the necessity of an axial reciprocating feed motion in the honing process to evenly distribute the honing action and achieve uniform tooth flank geometry and good lead profile accuracy.
In summary, by modeling the internal power honing process as an internal meshing of helical gears, we have established a clear link between gear mesh geometry (primarily tooth count difference and contact ratio), contact stress distribution, and potential honing errors. The analytical framework using Hertzian theory and the pressure ratio coefficient \(\zeta\) offers a quick way to estimate stress patterns. The more resource-intensive 3D FEA provides detailed validation and visualization. The overarching recommendation is to favor honing configurations with smaller tooth count differences to maintain a high contact ratio (\(\epsilon_{\alpha} \ge 2\)), thereby avoiding the single-pair contact stress concentration near the pitch line and better controlling the final gear tooth geometry. This study provides a foundational mechanical analysis to guide the optimization of process parameters in precision helical gear honing.