
A spiral bevel gear transmits motion between intersecting shafts through curved teeth that enter mesh gradually rather than all at once, which is why the pair runs smoothly, quietly and with low vibration in aircraft gearboxes, vehicle axles and industrial drives. The curved flank also makes the tooth compliant in the direction of the cutting force. During the finishing pass each slot is produced by a rotating cutter head while the blank is clamped and indexed, and the elastic-plus-plastic response of the thin, helical tooth to that interrupted load and to the heat generated with it remains in the finished surface as a geometric error. The error displaces the contact pattern, raises transmission error and shortens service life, so the cutting parameters that produce it are a direct lever on gear quality.
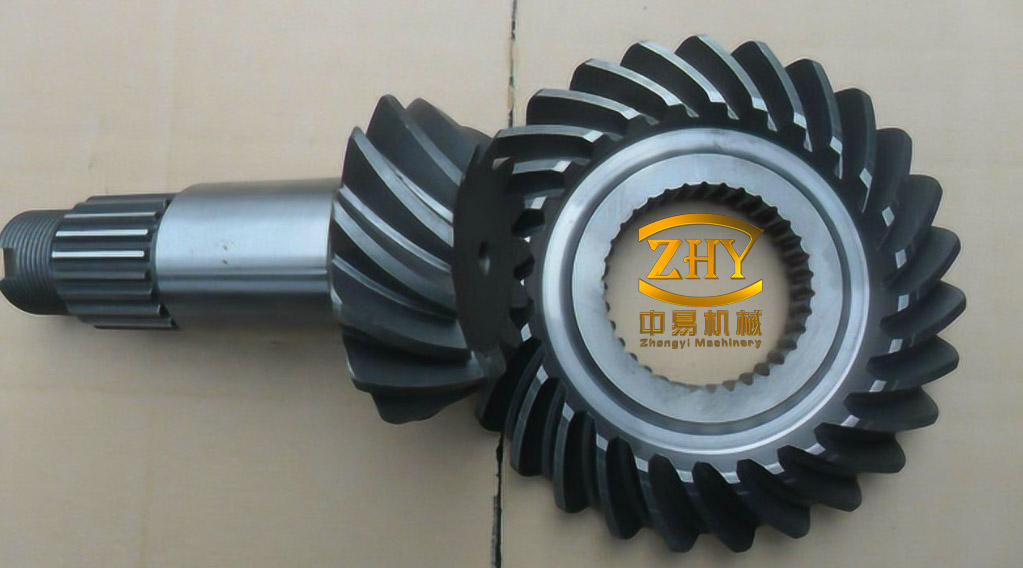
The practical question is quantitative rather than qualitative. Cutting speed, feed per revolution and depth of cut are set independently on the machine, but their influence on a curved, tapering tooth is not independent and is not monotonic a priori: higher speed raises strain rate and cutting temperature at the same time, so force and softening pull the flank in opposite directions. Establishing which parameter dominates, how large the effect is over the usable window, and whether a single best combination exists is what allows a shop to cut a 44-tooth blank once instead of iterating on scrap.
Where the forming method leaves room for deformation
Two families of processes produce spiral bevel teeth. Generating (rolling) methods imagine a crown gear in mesh with the workpiece and let the two roll together while the cutter removes material, giving high accuracy and low tool cost for small and medium batches of standard tooth forms. Forming methods use a cutter head whose blade profiles match the two flanks of the slot; the blank is held stationary, the head rotates, the worktable feeds the blank into the cut, and after each slot the head withdraws and the blank indexes by one pitch. There is no generating roll to control, material utilization is high, and complex tooth forms are reproduced directly from the blade profile, which suits volume production.
The same simplicity is what makes the forming route sensitive to deformation. Each of the 44 slots is cut in a single engagement of inner and outer blades, the load is applied over a short arc and removed abruptly, and the tooth being cut is supported only by the material beneath it. Because the process has no rolling motion whose kinematics could average out small errors, any force- or heat-induced displacement of the flank is transferred almost directly to the finished surface. Modeling the complete multi-slot cycle in a transient finite element code is prohibitively expensive, so the process is represented here by a single-slot three-dimensional cutting model: one tooth space, a rigid cutter with the appropriate blade geometry, and the workpiece material described by a rate- and temperature-sensitive constitutive law.
Single-tooth finite element model
The workpiece is AISI 4340 alloy steel, a nickel–chromium–molybdenum grade chosen for gears, shafts and high-strength fasteners because it combines high strength with through-hardening response and fatigue resistance. Its relevant properties, together with the Johnson–Cook constants used in the simulation, are listed in Table 1; the gear geometry is given in Table 2.
| Property | Value | Property | Value |
|---|---|---|---|
| Density | 7 830 kg/m³ | A | 792 MPa |
| Poisson ratio | 0.29 | B | 510 MPa |
| Thermal conductivity | 38 W/(m·K) | n | 0.26 |
| Tensile strength | 980 MPa | C | 0.014 |
| Yield strength | 792 MPa | m | 1.03 |
| Elastic modulus | 2 × 10⁵ MPa | — | — |
| Parameter | Value | Parameter | Value |
|---|---|---|---|
| Module | 3 mm | Face width | 20.2 mm |
| Number of teeth | 44 | Addendum coefficient | 0.85 |
| Pressure angle | 20° | Spiral angle | 35° |
Flow stress is described by the Johnson–Cook relation, which superposes strain hardening, strain-rate strengthening and thermal softening and is the standard choice when both the strain rates of a cutting operation and the temperatures of the shear zone must be carried in one expression:
$$\sigma=\left(A+B\varepsilon^{n}\right)\left(1+C\ln\frac{\dot{\varepsilon}}{\dot{\varepsilon}_{0}}\right)\left[1-\left(\frac{T-T_{0}}{T_{m}-T_{0}}\right)^{m}\right]$$
where A is the yield strength, B the strain-hardening modulus, n the hardening exponent, C the strain-rate sensitivity, m the thermal softening exponent, ε the equivalent plastic strain, and the dot-marked quantities the current and reference strain rates; T, T₀ and Tm are the current, ambient and melting temperatures.
Friction on the rake face is split into two regimes. Close to the edge the normal stress exceeds the shear yield strength of the workpiece and the chip adheres, so the local shear stress saturates at τs; further along the contact the chip slides and the shear stress falls with the normal stress σn. The modified Coulomb law represents both branches:
$$\tau_{c}=\begin{cases}\mu\sigma_{n}, & \mu\sigma_{n}<\tau_{s}\\ \tau_{s}, & \mu\sigma_{n}\ge\tau_{s}\end{cases}$$
with a friction coefficient μ of 0.2 and τs the shear yield stress of the workpiece material at the local temperature.
Chip separation and element deletion follow a ductile damage criterion of the Cockcroft–Latham type, in which a damage index integrates the largest tensile principal stress over the equivalent plastic strain and the element fails once the index reaches its critical value:
$$I=\int_{0}^{\bar{\varepsilon}_{f}}\sigma_{a}\,\mathrm{d}\bar{\varepsilon},\qquad \sigma_{a}=\begin{cases}\sigma_{1}, & \sigma_{1}\ge 0\\ 0, & \sigma_{1}<0\end{cases}$$
Here I is the accumulated damage, ε̄f the equivalent plastic strain at failure, ε̄ the equivalent strain and σ₁ the largest of the three principal stresses. Only tensile stress contributes, so compressive regions of the shear zone do not accumulate damage.
Deformation is read from the finished flank rather than from the whole tooth. In the central part of the tooth surface, where mesh actually occurs, five lines are distributed evenly from root to tip and nine across the face width, giving 45 sample points at their intersections. The total displacement at each point is recorded and the largest value of the set is taken as the deformation index of that cutting condition. The maximum is the appropriate scalar because contact pattern, transmission accuracy and fatigue life are all governed by the worst region of the flank, not by its average.
How each parameter moves the flank
Three single-factor sweeps were run with the levels of Table 3, each parameter varied while the other two were held at their mid-values.
| Level | Cutting speed v / (m/min) | Feed f / (mm/r) | Depth of cut ap / mm |
|---|---|---|---|
| 1 | 75 | 0.1 | 1.0 |
| 2 | 115 | 0.2 | 1.5 |
| 3 | 155 | 0.3 | 2.0 |
| 4 | 195 | 0.4 | 2.5 |
| 5 | 235 | 0.5 | 3.0 |
Speed produces a non-monotonic response: deformation rises from 75 m/min to a broad maximum in the middle of the range and then falls again toward 235 m/min. The rise is the expected consequence of more severe extrusion of material in the shear zone and of the greater quantity of heat generated per unit time, both of which soften the region ahead of the edge and allow larger plastic flow. Beyond the maximum, thermal softening overtakes strain-rate strengthening, the cutting force drops, and the chip forms and separates faster, so more of the generated heat leaves with the chip and less is conducted into the tooth; the flank therefore stiffens again in effective terms.
Feed is the opposite case: deformation increases steadily and steeply across 0.1 to 0.5 mm/r. A larger feed enlarges the uncut chip cross-section and therefore the cutting force, intensifies friction at both the rake and the flank contacts, and produces a thicker, more tightly curled chip whose stagnation on the rake face raises the plastic work dissipated in the tooth.
Depth of cut behaves like feed in direction but far more weakly: the trend is monotonic and shallow, because enlarging the depth of cut lengthens the engaged portion of the cutting edge at the same time as it enlarges the cut area, so the force per unit edge length changes little. Over the full range of the three sweeps the simulated deformation spans 15.67 µm to 36.67 µm, a factor of about 2.3, which is large enough that parameter selection rather than material or tooling variation controls the outcome.
Response surface built from a 25-run array
A three-factor, five-level orthogonal array of 25 runs was simulated with speed, feed and depth of cut as inputs and flank deformation D as the response. The main-effect plot shows feed as the dominant factor, speed second and depth of cut last, with the same trend shapes seen in the single-factor tests. A second-order response surface was then fitted to the 25 data points by least squares, and terms with a P value above 0.05 were removed:
$$D = 14.05 – 0.0278v – 18.6f + 12.55a_{p} + 100f^{2} + 0.1606vf – 0.038va_{p} – 17.66fa_{p}$$
with D in micrometres, v in m/min, f in mm/r and ap in mm. The fit explains 96.5% of the variance (adjusted 95.06%), and the residuals scatter around zero without visible curvature or periodicity, which supports the adequacy of the second-order form over the tested window. Analysis of variance confirms the model as a whole is significant, with an F ratio of 66.94 and a P value below 0.001 (Table 4).
| Source | DF | Sum of squares | Mean square | F | P |
|---|---|---|---|---|---|
| Regression | 7 | 819.759 | 117.108 | 66.94 | < 0.001 |
| Residual | 17 | 29.739 | 1.749 | — | — |
| Total | 24 | 849.497 | — | — | — |
The coefficients deserve reading as a set rather than one at a time. Evaluated at the upper corner of the design (v = 235 m/min, f = 0.5 mm/r, ap = 2.5 mm), the speed–feed interaction contributes +18.9 µm and the feed–depth interaction −22.1 µm, both comparable to or larger than the main effects at that point. Tuning one parameter while holding the others fixed is therefore unreliable: the sensitivity to feed itself changes with speed and depth, and a parameter set should be optimized jointly. Note also that the quadratic speed term did not survive the significance screen, so within this surface the speed dependence is monotonic even though the single-factor sweep showed an interior maximum.
Swarm optimization and the corner solution
Parameter selection was posed as a constrained minimization of the fitted surface,
$$\min D\left(v,f,a_{p}\right)$$
subject to the machine and process limits
$$\text{s.t.}\quad\begin{cases}75\ \text{m/min}<v<235\ 0.1\="" 1\="" <p="" \text{m="" \text{mm="" \text{mm}<a_{p}<3\="" \text{mm}\end{cases}$$="" min}\\="" r}<fParticle swarm optimization was used because it needs no gradient of the response and no crossover or mutation operators; the implementation ran 30 particles for 200 iterations with individual and global learning factors of 1, and a linearly decreasing inertia weight from 0.9 to 0.4,
$$\omega=\omega_{\max}-\frac{\left(\omega_{\max}-\omega_{\min}\right)t}{I_{\max}}$$
so that the swarm explores broadly early and converges narrowly late. The converged solution is v = 235 m/min, f = 0.1 mm/r and ap = 1.0 mm, with a predicted deformation of 12.29 µm.
| Case | v / (m/min) | f / (mm/r) | ap / mm | D / µm |
|---|---|---|---|---|
| Optimum | 235 | 0.1 | 1.0 | 12.29 |
| Comparison 1 | 195 | 0.1 | 1.0 | 14.97 |
| Comparison 2 | 235 | 0.2 | 1.0 | 15.93 |
| Comparison 3 | 235 | 0.1 | 1.5 | 12.97 |
Each comparison setting changes one parameter away from the optimum and predicts a larger deformation, confirming that the search converged to a minimum of the fitted surface rather than stopping at an arbitrary point. The result is also structural rather than accidental: at the optimum corner the partial derivatives of the fitted surface are negative in speed and positive in feed and depth, so the minimum lies on the boundary of the feasible box in all three directions. Two consequences follow. First, the optimum is set by the range that was tested, not by an interior physical balance, and extending the speed range upward or the feed range downward would move the answer. Second, the engineering value of the study lies as much in the sensitivity ranking as in the specific numbers, since the dominant lever is feed and the cheapest gain is obtained by reducing it.
Verification on a gear measuring machine
The optimum set was applied to an actual cutting trial, with each condition cut twice under identical settings to separate process variation from model error, and the finished flanks were inspected on a Gleason 650GMS gear measuring machine. That instrument treats the gear as a geometric body, collects coordinate data from the real flank and compares it with the theoretical surface to return the error parameters. Five tooth slots of the machined gear were measured.
| Slot | Simulated D / µm | Measured, run 1 / µm | Measured, run 2 / µm | Deviation / % |
|---|---|---|---|---|
| 1 | 12.29 | 13.20 | 13.10 | 6.2–6.9 |
| 2 | 12.29 | 11.20 | 10.94 | 9.7–12.3 |
| 3 | 12.29 | 13.90 | 13.40 | 8.3–11.6 |
| 4 | 12.29 | 13.30 | 13.50 | 7.6–9.0 |
| 5 | 12.29 | 11.30 | 13.40 | 8.3–8.8 |
Measured deformation falls between 10.94 µm and 13.90 µm against a simulated 12.29 µm. Deviations of individual readings range from about 6% to 12%, four of the five slots agree within 10%, and the overall level of agreement is of the order of 10% — consistent with a simulation that reproduces the governing physics without resolving every source of error. The repeatability of the measurements is itself informative: the two runs at the same setting differ by as little as 0.1 µm at slot 1 and as much as 2.1 µm at slot 5, so the scatter between nominally identical cuts is comparable to the residual model error and the agreement should be read as consistency rather than as high-precision prediction.
Reading the optimum as an engineering result
Three conclusions carry beyond this particular gear. Feed is the strongest influence on flank deformation across the tested window, with speed second and depth of cut a distant third, so a shop chasing dimensional stability on a form-milled spiral bevel gear should look at feed first. The response to speed is non-monotonic, which means the highest speed is not automatically the best for accuracy even though it is usually the best for productivity; the location of the minimum depends on how the thermal-softening and heat-removal effects balance for the specific material and blade geometry. And because the interactions in the fitted model are as large as the main effects, the search must be run over the parameter set jointly, which is exactly what a derivative-free optimizer such as particle swarm does well.
The boundaries of the result should be stated as plainly as the result. The simulation resolves one tooth slot with a rigid cutter, so the cumulative effect of the 44 successive cuts, the stiffness of the blank and fixture, and progressive tool wear are outside the model; wear in particular would raise the forces at the flank and shift the optimum toward lower feed over the life of a cutter head. The quadratic speed term was rejected during model fitting, so the surface cannot reproduce the local maximum observed in the speed sweep and should not be extrapolated beyond the tested box, where the optimizer is already pressing against three of its six limits. Finally, the optimum sits at the lowest feed tested, and feed is the parameter that most directly sets cycle time: 0.1 mm/r is a finishing condition, and any decision to adopt it trades machining time per slot against the roughly 3.7 µm of deformation saved relative to the 0.2 mm/r case at the same speed. For production planning, the appropriate use of these results is a validated sensitivity map and a deformation prediction within about 10%, not a single fixed parameter set that is optimal for every blank, tool and machine.
</v