
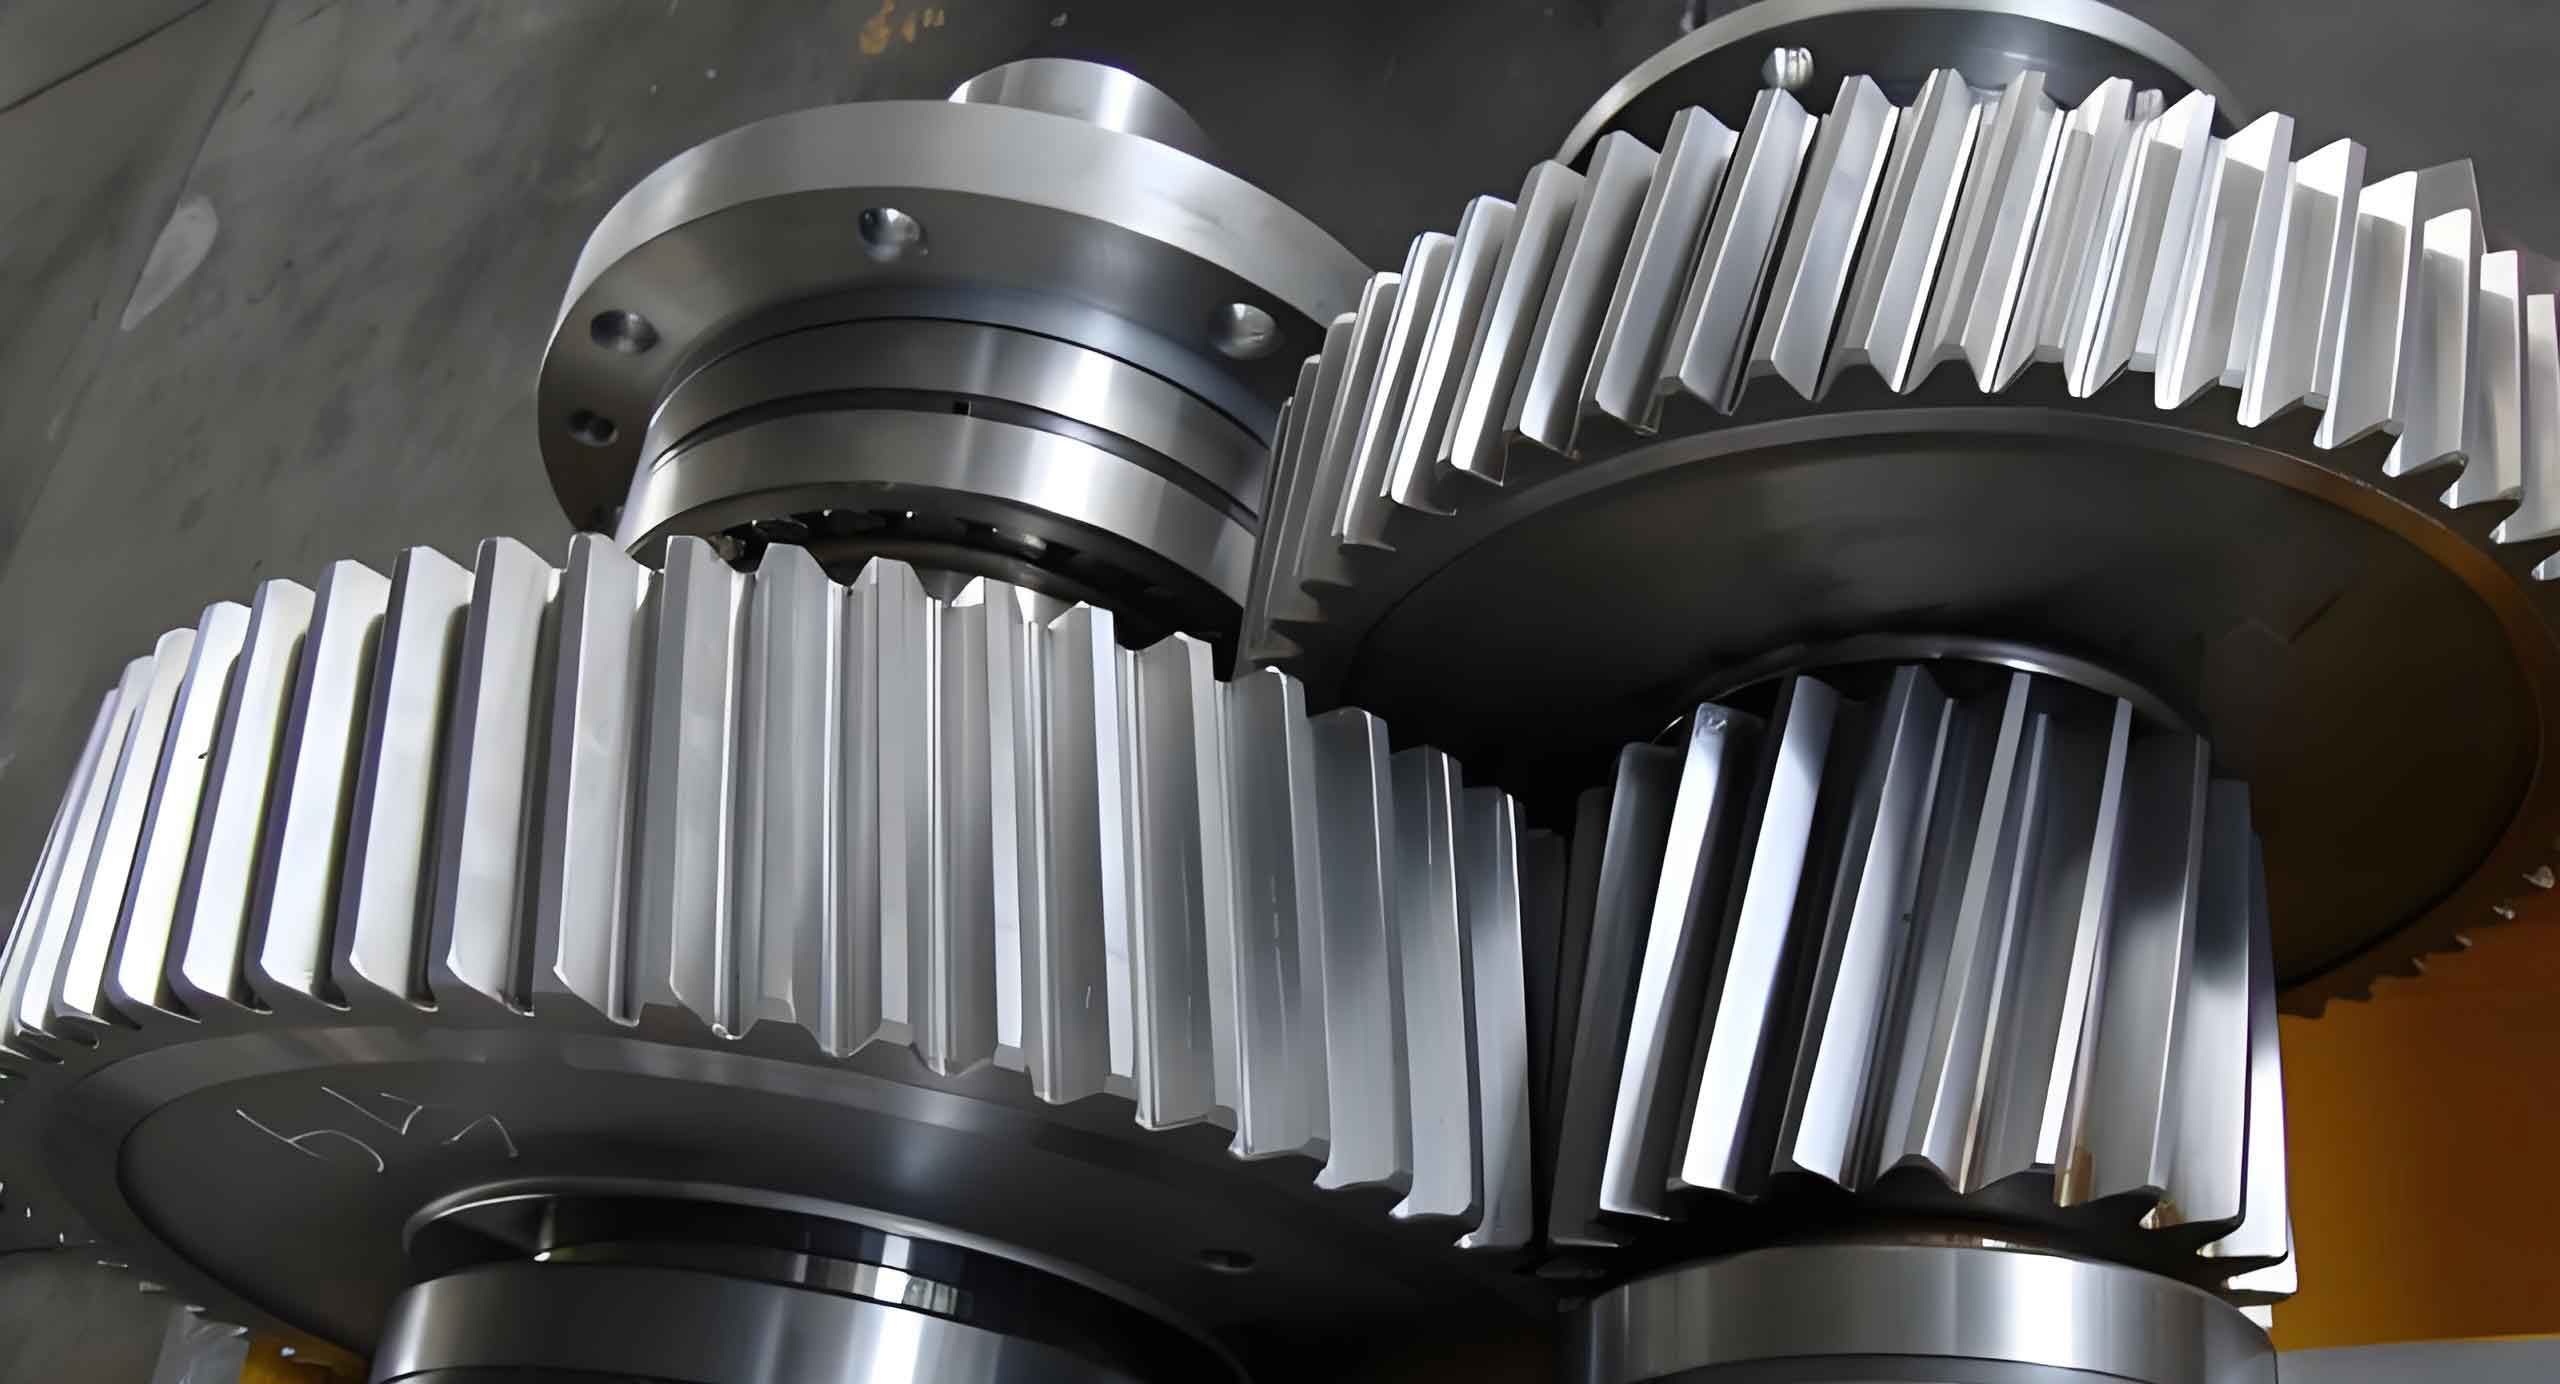
The reliable operation of metro vehicles is paramount for urban transportation networks. The gearbox, a critical component of the drivetrain, directly influences operational safety and efficiency. Among its elements, the helical gear pair is predominantly employed due to its smoother engagement and higher load capacity compared to spur gears. However, during long-term service under complex and variable loads, helical gears are susceptible to fatigue failure, with tooth root bending fatigue being a primary failure mode after significant advancements in surface treatment technologies for contact fatigue resistance. The initiation and propagation of a root crack can ultimately lead to catastrophic tooth breakage, posing a severe threat to vehicle safety. Therefore, a comprehensive investigation into the crack propagation mechanism in the tooth roots of metro helical gears is crucial for ensuring their service performance and enabling predictive maintenance strategies.
This analysis focuses on the specific operational conditions faced by helical gears within metro gearboxes. We investigate the crack propagation path and predict the residual life of a gear containing an initial flaw. The methodology integrates transient dynamic analysis to determine accurate operational stresses and the eXtended Finite Element Method (XFEM) to model the complex process of crack growth without requiring pre-defined mesh paths.
Transient Dynamic Stress Analysis of Helical Gears
Accurate determination of the stress state under dynamic loading is the foundation for fatigue and fracture analysis. For helical gears in metro applications, the load varies as different tooth pairs engage and disengage. A transient dynamic simulation is therefore necessary to capture the time-history of stress, particularly at the critical root fillet region.
Gear Parameters and Model Setup
The study considers a helical gear pair from a typical metro vehicle gearbox. The pinion, being the more critically loaded component due to its fewer teeth and higher engagement frequency, is selected for detailed analysis. The primary geometric and material parameters of the helical gears are summarized in Table 1.
| Parameter | Pinion | Gear |
|---|---|---|
| Normal Module (mm) | 5 | 5 |
| Number of Teeth | 22 | 133 |
| Normal Pressure Angle (°) | 20 | 20 |
| Helix Angle (°) | 20 | 20 |
| Face Width (mm) | 70 | 60 |
| Material | 20CrNiMo7-6 | |
| Young’s Modulus (MPa) | 2.1×10⁵ | |
A three-dimensional finite element model of three adjacent teeth of the pinion was constructed. A second-order tetrahedral element was used for meshing, with local refinement in the root fillet region to ensure stress accuracy. The Newmark time integration method was employed to solve the equations of motion for the transient analysis. The gear’s rotational degrees of freedom were constrained at its bore, and time-varying loads were applied to the tooth flanks to simulate the meshing process.
Load Application and Stress Calculation
The loading on a helical gear tooth is three-dimensional. The total normal force $F_n$ at the contact point can be resolved into three components: tangential ($F_t$), radial ($F_r$), and axial ($F_a$). For a pinion torque $T_1$, pitch diameter $d_1$, normal pressure angle $\alpha_n$, and helix angle $\beta$, these components are calculated as:
$$ F_t = \frac{2T_1}{d_1} $$
$$ F_r = \frac{F_t \tan \alpha_n}{\cos \beta} $$
$$ F_a = F_t \tan \beta $$
The resultant normal force is:
$$ F_n = \frac{F_t}{\cos \alpha_n \cos \beta} $$
For the given operational torque, the maximum $F_n$ was calculated. A multi-step loading profile was applied across the three modeled teeth to simulate the progression of contact across the face width, with the main carrying tooth experiencing the full load and the adjacent teeth experiencing partial loads representing engagement and disengagement. The load curve over the 0.1s analysis time is shown in Table 2.
| Time Step (s) | Load on Main Tooth (N) | Load State |
|---|---|---|
| 0.00 | 0 | Start |
| 0.05 | 287.5 | Ramp-up |
| 0.10 | 575.0 | Peak Load |
Stress Results and Model Validation
The transient analysis yielded the time-history of the first principal stress (the maximum tensile stress) at every node. The node experiencing the highest first principal stress throughout the cycle was identified at the root fillet. The stress at this critical location varies with the applied load, reaching its maximum value of approximately 329.5 MPa at the peak load instant (T=0.1s).
To validate the finite element model, the computed maximum bending stress was compared with the result from the standardized calculation method per GB/T 3480.5-2008 (ISO 6336). The bending stress at the tooth root $\sigma_F$ according to the standard is given by:
$$ \sigma_F = \frac{2 K_F T_1 Y_{Fa} Y_{Sa} Y_{\epsilon} Y_{\beta} \cos^2 \beta}{\phi_d m_n^3 z_1^2} $$
where $K_F$ is the load factor for bending strength, $Y_{Fa}$ is the tooth form factor, $Y_{Sa}$ is the stress correction factor, $Y_{\epsilon}$ is the contact ratio factor, $Y_{\beta}$ is the helix angle factor, $\phi_d$ is the face width coefficient, $m_n$ is the normal module, and $z_1$ is the number of pinion teeth. Substituting the parameters of the studied helical gears yields $\sigma_F \approx 340$ MPa.
The close agreement between the FE result (329.5 MPa) and the standardized calculation (340 MPa) confirms the accuracy of the transient dynamic model and the applied boundary conditions. This validated stress field serves as the fundamental input for the subsequent crack propagation analysis.
Further analysis of the stress tensor at the critical node revealed the nature of the stress state. The stresses in the local coordinate system—$S_{11}$ (through-thickness), $S_{22}$ (along the tooth root line), and $S_{33}$ (radial direction)—were examined. It was found that $S_{33}$ was negligible, while $S_{11}$ and $S_{22}$ were significant. This indicates that the bending fatigue failure in these metro helical gears is dominated by a mixed-mode (I and II) crack, with the opening mode (Mode I, driven by $S_{11}$) being predominant.
Crack Propagation Analysis Using XFEM
Traditional Finite Element Methods require the mesh to conform to the crack geometry, making the simulation of growing cracks computationally expensive and complex. The eXtended Finite Element Method (XFEM) overcomes this limitation by allowing the crack to traverse through elements, independent of the mesh.
Fundamentals of XFEM for Helical Gear Analysis
XFEM is based on the partition of unity concept. The displacement field $u^h(\mathbf{x})$ around a crack is enriched to capture the discontinuity and the singular stress field at the crack tip:
$$
u^h(\mathbf{x}) = \underbrace{\sum_{I \in \mathcal{S}} N_I(\mathbf{x}) u_I}_{\text{Standard FEM}} + \underbrace{\sum_{J \in \mathcal{S}_h} N_J(\mathbf{x}) H(f(\mathbf{x})) a_J}_{\text{Heaviside Enrichment}} + \underbrace{\sum_{K \in \mathcal{S}_c} N_K(\mathbf{x}) \Phi(\mathbf{x}) b_K}_{\text{Crack-tip Enrichment}}
$$
where:
- $N_I(\mathbf{x})$ are the standard nodal shape functions.
- $u_I$ are the standard nodal displacements.
- $H(f(\mathbf{x}))$ is the Heaviside step function, creating a jump in displacement across the crack face. The function $f(\mathbf{x})$ is a level set function defining the crack surface.
- $a_J$ are the additional degrees of freedom for nodes whose support is cut by the crack (set $\mathcal{S}_h$).
- $\Phi(\mathbf{x})$ are the crack-tip asymptotic enrichment functions, which describe the singularity and angular variation of the displacement field near the crack tip. For linear elastic fracture mechanics, these are functions of $\sqrt{r}$ and angular terms $\sin(\theta/2), \cos(\theta/2)$, etc.
- $b_K$ are the additional degrees of freedom for nodes around the crack tip (set $\mathcal{S}_c$).
This formulation allows for an accurate representation of the crack’s geometry and its associated mechanical fields without remeshing, making it highly suitable for simulating crack growth in complex three-dimensional components like helical gears.
Initial Crack Location and Propagation Simulation
Observations from field failures of metro helical gears indicate that bending fatigue cracks often originate at the tooth root on one of the end faces, not at the center of the face width where the nominal bending stress is highest. This is attributed to edge effects, potential slight misalignments, and the specific load distribution on helical gears. Therefore, the initial crack was seeded on the tooth root at one end face.
An initial semi-elliptical surface crack with a length of 4 mm (along the tooth root line) and a width of 2 mm (into the tooth thickness) was defined. The maximum principal stress criterion was used as the damage initiation law, and the fracture energy-based criterion governed the propagation direction and rate. A static load equivalent to the peak operational load identified in the transient analysis was applied to the tooth flank. The XFEM-based crack propagation analysis was run for 50 increments.
| Propagation Increment | Crack Growth Behavior | Primary Growth Direction |
|---|---|---|
| 1-10 | Slow, stable growth initiated both along the tooth width (face width direction) and into the tooth thickness. | Mixed (I/II) |
| 11-30 | Asymmetric growth becomes pronounced. Faster propagation along the tooth width compared to growth into the thickness. | Along width (Combined Modes) |
| 31-40 | Crack along the width direction reaches a critical length. A distinct change in the propagation path occurs. | Transition |
| 41-50 | Rapid, unstable growth at an angle of approximately 60° relative to the initial direction, leading towards final fracture. | Unstable (Mode I dominated) |
The simulation revealed a crucial insight: although the maximum tensile stress occurs at the mid-width of the tooth root, the crack propagation under fatigue loading initiates from the edge. The crack initially extends both along the face width and into the tooth body. The propagation along the face width is dominant. After propagating a certain distance, the crack path kinks significantly, changing direction to cut through the tooth, which aligns with typical fracture surfaces observed in failed helical gears. This path is governed by the evolving mixed-mode stress intensity factors at the crack front, which are influenced by the complex three-dimensional geometry and loading of the helical gear tooth.
Fatigue Life Prediction for Cracked Helical Gears
Predicting the remaining useful life of a component containing a crack is essential for condition-based maintenance. The crack growth life is calculated by integrating the crack growth rate from the initial crack size to a critical size that causes unstable fracture.
Driving Load Spectrum
The load history on metro helical gears is not constant. It follows the traction, coasting, and braking cycles of the vehicle. A typical driving torque profile for a gearbox over one inter-station run was obtained, as shown in Figure 14b of the source material. The torque varies with time: rising during traction, dropping to near zero during coasting, and becoming negative during braking. For life prediction, the torque-time history is converted into a series of stress cycles at the crack location using the relationship between applied load and stress intensity factor.
| Operational Phase | Duration (s) | Approx. Peak Torque (Nm) |
|---|---|---|
| Traction | ~40 | ~5000 |
| Coasting | ~30 | ~0 |
| Braking | ~30 | ~ -2000 (Resistive) |
Crack Growth Integration and Life Calculation
The crack growth rate under cyclic loading is commonly described by the Paris law:
$$ \frac{da}{dN} = C (\Delta K)^m $$
where $da/dN$ is the crack growth per cycle, $\Delta K$ is the range of the stress intensity factor in a cycle, and $C$ and $m$ are material constants. For mixed-mode growth in a three-dimensional crack, an equivalent $\Delta K_{eq}$ is often used.
The stress intensity factor range for a given crack size $a_i$ and applied stress range $\Delta \sigma_i$ is:
$$ \Delta K_i = Y \Delta \sigma_i \sqrt{\pi a_i} $$
where $Y$ is the geometry correction factor, which is a function of crack shape and component geometry. For complex 3D cracks in helical gears, $Y$ is determined numerically from the FE/XFEM analysis.
The life prediction process is iterative:
- For the $i$-th load cycle, calculate $\Delta K_i$ and $K_{max,i}$ for the current crack size $a_{i-1}$.
- Check if $K_{max,i} \geq K_{IC}$ (fracture toughness). If true, unstable fracture occurs.
- Check if $\Delta K_i \leq \Delta K_{th}$ (threshold). If true, no growth occurs in this cycle.
- Otherwise, calculate the crack growth increment: $\Delta a_i = C (\Delta K_i)^m$.
- Update the crack size: $a_i = a_{i-1} + \Delta a_i$.
- Repeat for the next load cycle until failure.
Applying this methodology to the helical gear pinion with the initial 4×2 mm edge crack and subjecting it to the repeated metro operational torque spectrum, the crack growth curve was obtained. The crack length was monitored in two key directions: depth into the tooth and extension along the tooth width.
| Stage | Final Crack Size (Along Width) | Number of Load Cycles (×105) | Remarks |
|---|---|---|---|
| Stable Propagation | ~15 mm | Up to ~16 | Paris law integration |
| Unstable Fracture | Critical (>15 mm) | >16 | Fast, final failure |
The analysis predicted that the stable crack propagation life for the helical gear with the specified initial defect is approximately $16 \times 10^5$ load cycles. The unstable fracture phase is very brief; thus, the stable propagation life constitutes the predictable remnant life. This life corresponds to a specific number of metro run intervals, providing a quantitative basis for inspection and replacement schedules.
Conclusion
This integrated analysis of transient dynamics, fracture mechanics, and operational loading provides a robust framework for assessing the durability of metro helical gears. The key findings are:
- The transient dynamic FE model accurately replicates the bending stress state in helical gear teeth under operational loading, as validated against international standard calculations.
- The bending fatigue failure in these helical gears is characterized as a mixed-mode (I/II) crack growth process, with Mode I (opening) being dominant.
- Contrary to the location of maximum static stress, fatigue cracks in helical gears are prone to initiate at the tooth root on the end face. The propagation path is asymmetric, initially growing along the face width before undergoing a significant directional change leading to final fracture. XFEM is an effective tool for simulating this complex 3D growth.
- By combining the XFEM-derived crack growth behavior with a realistic metro drive cycle, a predictive life model was established. For a helical gear pinion with an initial 4 mm by 2 mm edge crack, the predicted stable crack propagation life is about 1.6 million load cycles.
This methodology enables the transition from time-based maintenance to condition-based maintenance for critical gearbox components. By understanding the crack propagation paths and quantifying life based on actual operating conditions, maintenance intervals for metro helical gears can be optimized, enhancing operational safety and reliability while potentially reducing lifecycle costs. Future work could involve incorporating the effects of residual stresses from manufacturing, variable amplitude loading sequences more precisely, and environmental factors to further refine the life predictions for helical gears.