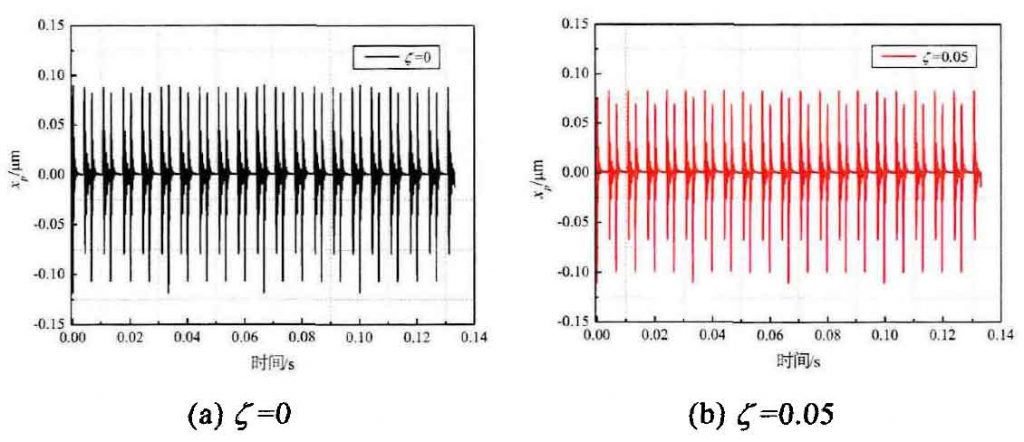
The displacement response of driving gear xp under different damping ratios (ζ = 0, 0.05, 0.10, 0.15) is plotted in Fig. 1. It can be seen in Fig. 1 that the amplitude of displacement response decreases slightly with the increase of damping ratio. In order to show the change of displacement response more clearly, the local periodic displacement change curve under each damping ratio is selected to draw the local displacement response diagram in Fig. 2 The change shows that under the same input condition, the increase of damping ratio can reduce the gear displacement amplitude, and the response signal attenuation to the equilibrium position is more stable. The smaller the damping ratio is, the more obvious the displacement response signal is. The displacement response under different damping ratios can quickly decay to the equilibrium position of the system, which further indicates the stability of the system, but it will affect the amplitude characteristics of the signal response.
The time-domain response signals of DTE under different damping ratios are plotted in Fig. 3. The time-domain response signals of DTE in Fig. 3 can not directly reflect the influence of damping ratio on DTE. The time-domain response signals of DTE in Fig. 4 are further plotted. The change of DTE curve in Fig. 4 shows that the increase of damping ratio reduces the amplitude of DTE curve, and the attenuation effect of displacement amplitude is the same as that of DTE The curve change of XP in Figure 2 is consistent. It further shows that the damping ratio can not change the stability of the system, but can change the amplitude response characteristics of DTE.


