
In my work on metro vehicle gearbox reliability, I treated the lubricating oil as a critical protective element for the pinion gear, the main gear, the bearings, and the bearing cages. The conventional maintenance rule requires annual oil replacement, but my field observations showed that oil reaching the nominal replacement interval often remained clear and transparent, with low wear-metal content and acceptable physicochemical condition. This mismatch led me to ask whether the annual replacement rule actually protects the pinion gear and gearbox as well as it could, or whether it wastes useful oil life. I therefore designed a data-driven threshold framework for metro gearbox lubricating oil, with particular attention to the pinion gear contact environment, and I validated it with operational samples collected from 0 to 200,000 vehicle-km.
My objective was not merely to describe oil degradation, but to calculate defensible warning and abnormal thresholds for a set of condition indicators. The thresholds had to be useful for condition-based maintenance, for pinion gear wear surveillance, and for optimizing the oil change interval without reducing safety. I used the three-line value method and the maximum entropy method, compared their behavior for different indicator directions, and constructed a linear regression model of lubricating oil performance degradation. The evidence supports the conclusion that oil performance remains good at 200,000 vehicle-km under the observed metro duty cycles, and that the same data-driven procedure can be extended to higher mileages to build a full-life degradation model for the pinion gear lubricating oil system.
1. Problem Statement and Research Logic
I began from a practical contradiction. Metro gearboxes contain highly loaded gears, including the pinion gear, which operates under repeated contact stress, sliding, and rolling. The lubricating oil must form a durable film on the pinion gear teeth, remove heat, carry away wear particles, and protect bearings from corrosion and fatigue. If the oil degrades too far, the pinion gear can suffer scuffing, pitting, and accelerated wear. If the oil is replaced too early, the operator loses the remaining useful life of a still-functional lubricant and incurs unnecessary cost, downtime, and material consumption.
The existing rule is time-based: replace the oil every year. My sampling evidence indicated that many oils at the end of that period still had good appearance and performance. This does not mean that the oil never degrades; rather, it means that calendar time alone is a poor proxy for the actual state of the pinion gear lubricant. A better approach is to monitor the oil condition, define thresholds for key indicators, and replace the oil when the indicators approach a meaningful limit. That is the logic of my study.
The core research questions I addressed were as follows. First, which oil indicators best represent pinion gear wear, bearing wear, additive depletion, and oil oxidation? Second, how should threshold values be calculated when some indicators increase with mileage, some decrease, and some can move in both directions? Third, can the thresholds be linked to a degradation model that remains stable over 0–200,000 vehicle-km? Fourth, can the same method be extended to higher mileages to support a full-life model for metro gearbox lubricating oil? I answered these questions through controlled sampling, statistical distribution analysis, threshold computation, and regression modeling.
2. Sampling Design and Quality Control
I selected 14 metro operating lines to represent low, medium, and high passenger flow. Low-flow lines included routes with relatively gentle duty cycles, medium-flow lines represented typical urban service, and high-flow lines represented intense stop-start operation and high load factors. Within each line and each train type, I randomly selected eight gearboxes. I collected oil samples every 900 operating hours, producing 450 samples across the target mileage range. I recorded sampling time, operating hours, and operating mileage so that every result could be associated with a specific service exposure.
The quality of threshold calculation depends on sample representativeness. A poor sample can make a good pinion gear look worn, or make a degrading oil look healthy. I therefore controlled four aspects: sampling time, sampling tool, sampling depth, and storage. I prioritized hot-oil sampling when the oil temperature was at least 40 °C, or sampling within 30 minutes after the train returned to the depot. Hot oil has stronger thermal convection, so the sample is more likely to represent the bulk oil rather than a local layer. I used a self-developed automatic sampling device controlled by a programmable logic controller. The device uses negative pressure to draw oil, and except for the suction tube, it does not contact the oil sample. This reduces external contamination from manual handling and supports automatic quantitative sampling. I made a sampling conduit that inserts to 50% ± 5% of the oil level height, avoiding both the surface oxidation layer and the bottom sediment. I used disposable sample bottles, protected them from light, and sealed them to prevent oxidation before laboratory analysis.
| Sampling factor | Specification I used | Reason for the control |
|---|---|---|
| Operating lines | 14 lines covering low, medium, and high passenger flow | Captures different pinion gear duty cycles and load spectra |
| Gearboxes per train type | 8 randomly selected gearboxes | Reduces selection bias and represents within-line variation |
| Sampling interval | Every 900 operating hours | Provides repeated tracking rather than a single end-point measurement |
| Total samples | 450 samples | Supports distribution fitting and threshold stability |
| Mileage range | 0 to 200,000 vehicle-km | Defines the interval for the first-stage threshold model |
| Sampling time | Hot oil at ≥ 40 °C or within 30 minutes after depot return | Ensures bulk oil mixing and reduces stratification |
| Sampling tool | PLC-controlled negative-pressure automatic sampler | Reduces manual contamination and improves repeatability |
| Sampling depth | 50% ± 5% of oil level height | Avoids surface oxidation products and bottom sediment |
| Storage | Disposable bottle, dark, sealed | Prevents oxidation and photo-degradation before testing |
The following visual reference shows a representative pinion gear whose contact and wear behavior I associate with the lubricating oil indicators used in this study. The pinion gear is a central reason why I monitor iron, copper, phosphorus, boron, viscosity, and acid value together rather than relying on a single measurement.
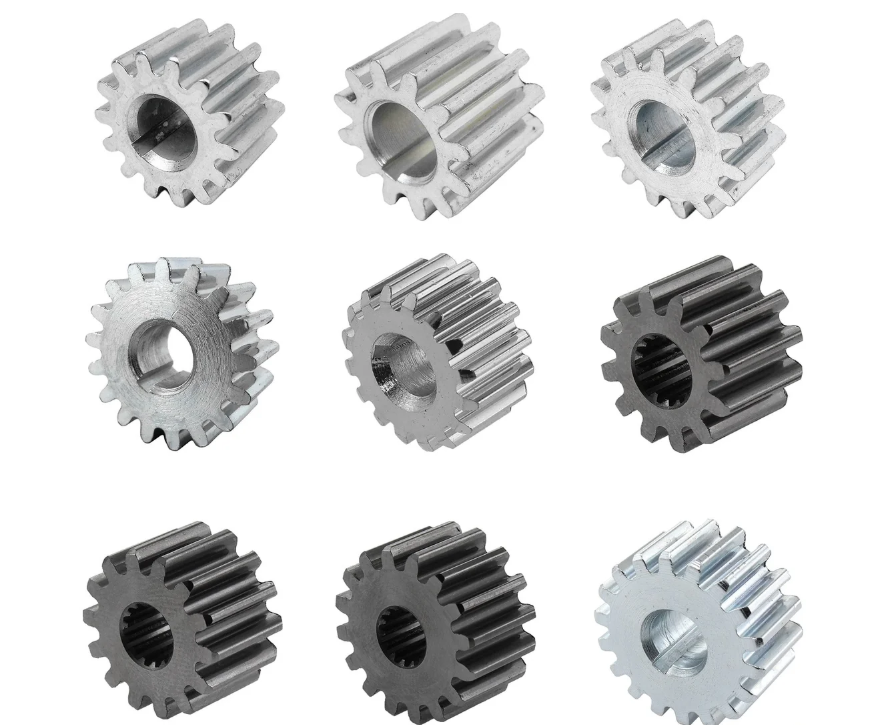
I selected the monitoring indicators because the pinion gear and gearbox form a multi-material tribological system. The pinion gear teeth, the main gear, the bearings, and the cages are not made of the same material and do not wear in the same way. A single indicator cannot describe the whole system. I therefore combined wear elements, additive elements, and physicochemical properties. Iron represents ferrous wear from the pinion gear, gears, and bearing surfaces. Copper represents wear from copper-containing bearings, bushings, or lubricant interaction with non-ferrous components. Phosphorus represents anti-wear and extreme-pressure additive content. Boron represents antioxidant and thermal-stability additive content. Acid value represents oxidation and acidic product accumulation. Kinematic viscosity at 40 °C and 100 °C represents the oil film formation ability and the flow behavior that protects the pinion gear under different temperatures.
| Indicator | Symbol | Unit | Expected direction with mileage | Role in pinion gear and gearbox protection |
|---|---|---|---|---|
| Iron | Fe | mg/kg | Increase | Ferrous wear from the pinion gear, gear teeth, shafts, and bearing races |
| Copper | Cu | mg/kg | Increase | Wear from copper-containing bearings, bushings, and cages |
| Phosphorus | P | mg/kg | Decrease | Anti-wear and extreme-pressure additive for pinion gear contact |
| Boron | B | mg/kg | Decrease | Antioxidant and thermal-stability additive |
| Acid value | TAN | mg KOH/g | Can increase or decrease | Oxidation state and corrosive potential of the oil |
| Kinematic viscosity at 40 °C | ν40 | cSt | Can increase or decrease | Low-temperature flow and oil film formation on the pinion gear |
| Kinematic viscosity at 100 °C | ν100 | cSt | Can increase or decrease | High-temperature film strength and shear stability |
3. Data Processing and Threshold Methods
I summarized the collected data into distribution histograms for each indicator. The histograms showed that, as the sample size increased, the values for iron, copper, phosphorus, boron, acid value, and kinematic viscosity at 40 °C and 100 °C tended toward a normal distribution. The samples came from the entire metro network, so the trains differed in route profile, passenger load, speed, station spacing, and gearbox condition. These differences produced some irregularities, but the distributions remained suitable for threshold estimation. I therefore used two methods: the three-line value method and the maximum entropy method.
The three-line value method is based on the Shewhart control chart and the central limit theorem. When the sample size is sufficiently large, the sample mean is assumed to follow a normal distribution. I divided equipment condition into normal, warning, and abnormal states. For a two-sided indicator, the warning threshold is the mean plus or minus two standard deviations, and the abnormal threshold is the mean plus or minus four standard deviations. I calculated the sample mean and sample standard deviation as follows:
$$ \bar{x}_n = \frac{\sum_{i=1}^{n} x_i}{n} $$
$$ s_n = \sqrt{\frac{\sum_{i=1}^{n}(x_i – \bar{x}_n)^2}{n-1}} $$
For indicators that can move in both directions, I used the two-sided form:
$$ y_a = \bar{x}_n \pm 2s_n $$
$$ y_b = \bar{x}_n \pm 4s_n $$
Here, \(\bar{x}_n\) is the sample mean in mg/kg, \(x_i\) is the value of the \(i\)-th sample, \(s_n\) is the sample standard deviation in mg/kg, \(y_a\) is the warning threshold, and \(y_b\) is the abnormal threshold. For wear elements such as iron and copper, only the upper boundary is meaningful because wear particles accumulate with mileage. I therefore used the following upper-bound formulas:
$$ y_{a1} = \bar{x}_n + 2s_n $$
$$ y_{b1} = \bar{x}_n + 4s_n $$
For additive elements such as phosphorus and boron, the concern is depletion. Their content decreases as the additives are consumed, so only the lower boundary is meaningful. I used the following lower-bound formulas:
$$ y_{a2} = \bar{x}_n – 2s_n $$
$$ y_{b2} = \bar{x}_n – 4s_n $$
For acid value and kinematic viscosity, the oil can degrade in either direction. Acid value can rise due to oxidation, but it can also change through additive consumption and chemical reactions. Viscosity can rise due to oxidation, soot, or insoluble material, and it can fall due to shear degradation or mixing with a lower-viscosity fluid. I therefore used the two-sided formulas for these indicators.
The maximum entropy method is based on the maximum entropy principle to obtain an unbiased and consistent probability distribution. For a given indicator, if the probability that the value is less than or equal to a threshold \(A\) is 0.9772, then \(A\) is the warning threshold. If the probability that the value is less than or equal to a threshold \(B\) is 0.9987, then \(B\) is the abnormal threshold. I wrote these conditions as:
$$ y_{a3} = A, \quad P(X \le A) = 0.9772 $$
$$ y_{b3} = B, \quad P(X \le B) = 0.9987 $$
Here, \(P(X \le A)\) is the probability that the random variable \(X\) is less than or equal to \(A\), \(y_{a3}\) is the maximum entropy warning value, and \(y_{b3}\) is the maximum entropy abnormal value. I found that the maximum entropy method is useful for upper-bound indicators such as iron and copper, but it cannot directly calculate lower-bound thresholds for additive depletion. It also cannot naturally produce two-sided thresholds for acid value and viscosity. Therefore, I used the maximum entropy method mainly as a cross-check for wear elements and used the three-line value method for the final integrated threshold system.
| Indicator type | Direction of concern | Three-line formula | Maximum entropy applicability |
|---|---|---|---|
| Wear elements: Fe, Cu | Upper bound | \(y_a = \bar{x}_n + 2s_n\), \(y_b = \bar{x}_n + 4s_n\) | Applicable as an upper-bound cross-check |
| Additive elements: P, B | Lower bound | \(y_a = \bar{x}_n – 2s_n\), \(y_b = \bar{x}_n – 4s_n\) | Not directly applicable for lower bound |
| Acid value | Two-sided | \(y_a = \bar{x}_n \pm 2s_n\), \(y_b = \bar{x}_n \pm 4s_n\) | Not directly applicable for two-sided limit |
| Viscosity at 40 °C | Two-sided | \(y_a = \bar{x}_n \pm 2s_n\), \(y_b = \bar{x}_n \pm 4s_n\) | Not directly applicable for two-sided limit |
| Viscosity at 100 °C | Two-sided | \(y_a = \bar{x}_n \pm 2s_n\), \(y_b = \bar{x}_n \pm 4s_n\) | Not directly applicable for two-sided limit |
4. Distribution Behavior of the Indicators
The iron distribution was broad but approximately normal, with a long right tail associated with a small number of gearboxes that experienced higher pinion gear wear. The copper distribution also approached normality, with occasional high values that I attributed to bearing or bushing wear. The phosphorus and boron distributions were roughly normal but shifted downward as mileage increased, which is consistent with additive depletion. The acid value distribution was centered near 2.99 mg KOH/g, with both lower and higher values. The 40 °C viscosity distribution centered near 111.72 cSt, and the 100 °C viscosity distribution centered near 15.33 cSt. These central values became the basis for the warning and abnormal limits.
The normality tendency became stronger as the sample size increased. This matters because both the three-line value method and the maximum entropy method depend on the shape of the distribution. When the sample size was small, individual high-wear gearboxes could distort the thresholds. When the sample size was large, the thresholds stabilized. The 450-sample dataset therefore provided a reasonable basis for threshold estimation. I also recognized that the network-wide variation is not noise to be eliminated; it is real service variation. A threshold system for metro pinion gear oil must tolerate differences between lines, train types, and operating profiles while still detecting abnormal wear and additive depletion.
5. Threshold Calculation Results
I calculated the thresholds using the three-line value method and the maximum entropy method. For iron and copper, the two methods produced similar results. The maximum entropy values were slightly higher for the warning threshold and somewhat higher for the abnormal copper threshold, but the overall agreement supported the robustness of the data. For phosphorus and boron, only the three-line lower-bound method was appropriate. For acid value and the two viscosity indicators, only the two-sided three-line method could represent the real risk of both increase and decrease. The resulting threshold set is shown in the following table.
| Monitoring indicator | Unit | Three-line warning threshold | Three-line abnormal threshold | Maximum entropy warning threshold | Maximum entropy abnormal threshold |
|---|---|---|---|---|---|
| Fe | mg/kg | 90.37 | 136.92 | 93.61 | 136.37 |
| Cu | mg/kg | 20.38 | 31.09 | 22.42 | 37.81 |
| P | mg/kg | 1,272.02 | 562.06 | Not applicable | Not applicable |
| B | mg/kg | 116.56 | 44.02 | Not applicable | Not applicable |
| Acid value | mg KOH/g | 2.99 ± 0.30 | 2.99 ± 0.60 | Not applicable | Not applicable |
| Kinematic viscosity at 40 °C | cSt | 111.72 ± 11.35 | 111.72 ± 22.70 | Not applicable | Not applicable |
| Kinematic viscosity at 100 °C | cSt | 15.33 ± 1.17 | 15.33 ± 2.34 | Not applicable | Not applicable |
The iron threshold is especially relevant to the pinion gear. A warning value of 90.37 mg/kg and an abnormal value of 136.92 mg/kg mean that the oil can tolerate a substantial amount of ferrous wear before the pinion gear contact is considered critical. The copper thresholds indicate that bearing and bushing wear should be watched, but the warning level of 20.38 mg/kg and abnormal level of 31.09 mg/kg are not so low that normal running-in produces false alarms. The phosphorus lower limits, 1,272.02 mg/kg for warning and 562.06 mg/kg for abnormal, define when the anti-wear additive has depleted enough to threaten the pinion gear film. The boron lower limits, 116.56 mg/kg for warning and 44.02 mg/kg for abnormal, define when the antioxidant and thermal-stability additive has fallen to a concerning level.
The acid value and viscosity limits are two-sided because the pinion gear and bearings can be harmed by both oxidation and shear degradation. For acid value, the normal center is 2.99 mg KOH/g, the warning band is ±0.30, and the abnormal band is ±0.60. For 40 °C viscosity, the normal center is 111.72 cSt, the warning band is ±11.35 cSt, and the abnormal band is ±22.70 cSt. For 100 °C viscosity, the normal center is 15.33 cSt, the warning band is ±1.17 cSt, and the abnormal band is ±2.34 cSt. These bands are wide enough to accommodate normal service variation but narrow enough to detect meaningful degradation.
6. Comparison of the Two Threshold Methods
I compared the three-line value method and the maximum entropy method for practical use. The two methods agreed well for iron and copper, which are the main wear indicators for the pinion gear and bearings. However, the maximum entropy method has a structural limitation: it calculates an upper probability limit. It cannot directly calculate a lower threshold for phosphorus or boron, and it cannot produce a two-sided threshold for acid value or viscosity. Since additive depletion and viscosity change in both directions are essential to pinion gear lubrication health, the maximum entropy method cannot serve as the sole threshold method. The three-line value method can handle upper, lower, and two-sided limits, and it becomes more stable as the sample size increases. I therefore selected the three-line value method as the final method for the integrated threshold system and used the maximum entropy results as a validation check for iron and copper.
| Comparison criterion | Three-line value method | Maximum entropy method |
|---|---|---|
| Upper-bound indicators | Applicable | Applicable |
| Lower-bound indicators | Applicable | Not directly applicable |
| Two-sided indicators | Applicable | Not directly applicable |
| Agreement for Fe | Warning 90.37, abnormal 136.92 mg/kg | Warning 93.61, abnormal 136.37 mg/kg |
| Agreement for Cu | Warning 20.38, abnormal 31.09 mg/kg | Warning 22.42, abnormal 37.81 mg/kg |
| Stability with large samples | Strong | Moderate |
| Final selection | Yes | Used as cross-check |
From the pinion gear perspective, the three-line method is more useful because it can express both the risk of too much wear metal and the risk of too little additive protection. A pinion gear can fail from wear, but it can also fail from scuffing or micropitting when the anti-wear additive is depleted. A threshold system that only checks upper limits would miss additive depletion. My integrated method therefore combines upper-bound wear thresholds, lower-bound additive thresholds, and two-sided physicochemical thresholds. This is a more complete representation of pinion gear oil health.
7. Degradation Modeling and Regression Results
After calculating the thresholds, I modeled how they evolve with operating mileage. I used iron as the primary example because iron is directly associated with pinion gear and gear tooth wear. I fitted a linear regression model to the relationship between the iron threshold and operating mileage. The resulting equations were:
$$ y_{w}(x) = 5.9003x $$
$$ y_{a}(x) = 8.9308x $$
In these equations, \(x\) is the operating mileage in units of 10,000 vehicle-km, \(y_w(x)\) is the warning threshold in mg/kg, and \(y_a(x)\) is the abnormal threshold in mg/kg. At 200,000 vehicle-km, the warning threshold is approximately 118.01 mg/kg and the abnormal threshold is approximately 178.62 mg/kg. These fitted values are consistent with the general trend that the iron threshold increases gradually with mileage. The pooled thresholds in the previous table represent the 0–200,000 vehicle-km window, while the regression equations describe the trend within that window. Together, they provide both a static limit for immediate decision-making and a dynamic model for trend monitoring.
| Model element | Expression | Interpretation |
|---|---|---|
| Warning threshold trend | \(y_w(x) = 5.9003x\) | Gradual increase in the iron warning limit with mileage |
| Abnormal threshold trend | \(y_a(x) = 8.9308x\) | Gradual increase in the iron abnormal limit with mileage |
| Mileage unit | 10,000 vehicle-km | Keeps the regression coefficients readable |
| Mileage range | 0 to 20 units | Equivalent to 0 to 200,000 vehicle-km |
| Warning at 20 units | 118.01 mg/kg | Estimated warning level at 200,000 vehicle-km |
| Abnormal at 20 units | 178.62 mg/kg | Estimated abnormal level at 200,000 vehicle-km |
The linear regression model showed stable degradation within 0–200,000 vehicle-km. This stability is important because it means that the oil is not approaching a sudden failure cliff in this interval. The pinion gear remains protected as long as the iron value stays below the warning threshold and the additive elements remain above their lower limits. When the oil eventually approaches the end of its useful life, I expect the degradation curve to deviate from the linear model. At that point, the measured indicator values will change faster than the linear prediction, producing a breakpoint or sudden change. I can use this deviation as an early sign that the oil has reached a critical state and that the pinion gear protection margin is shrinking.
I expressed the general piecewise degradation concept as follows:
$$ y(x) = \begin{cases} \beta_0 + \beta_1 x + \varepsilon, & x \le x_c \\ \beta_0 + \beta_1 x + \beta_2 (x – x_c)^2 + \varepsilon, & x > x_c \end{cases} $$
In this expression, \(y(x)\) is the indicator value, \(x\) is mileage, \(x_c\) is the critical mileage where the degradation rate changes, \(\beta_0\), \(\beta_1\), and \(\beta_2\) are model coefficients, and \(\varepsilon\) is the error term. For the 0–200,000 vehicle-km interval, the linear branch is sufficient. For higher mileages, the quadratic or breakpoint branch may become necessary. The same logic can be applied to Fe, Cu, P, B, acid value, and viscosity, creating a multi-indicator full-life degradation model for the pinion gear lubricating oil.
8. Interpretation for Pinion Gear Health
The pinion gear is not an isolated component. Its health depends on the oil film, the additive package, the wear particle load, and the thermal state of the gearbox. I therefore interpreted each threshold in relation to the pinion gear. Iron is the most direct indicator of ferrous wear on the pinion gear teeth and the mating gear. When iron rises toward the warning threshold, I inspect the pinion gear contact pattern, the tooth surface, and the bearing condition. When iron approaches the abnormal threshold, I treat the oil as a carrier of active wear and consider oil replacement plus a pinion gear inspection. Copper is associated with bearings and cages, so a copper increase prompts me to check bearing clearances and lubricant flow. Phosphorus depletion affects the anti-wear film on the pinion gear, so a phosphorus value below the warning threshold means that the pinion gear may be less protected under high load. Boron depletion affects oxidation stability, so a low boron value means that the oil may oxidize faster and produce acids that corrode the pinion gear and bearings. Acid value and viscosity define the chemical and physical state of the oil. If acid value rises above the abnormal limit, the oil may corrode metal surfaces. If viscosity falls below the lower limit, the pinion gear film may become too thin. If viscosity rises above the upper limit, the oil may become too resistant to flow and may not reach the pinion gear contact efficiently.
| Indicator state | Possible meaning for the pinion gear | Action I would take |
|---|---|---|
| Fe above warning | Increasing ferrous wear on the pinion gear or mating gear | Increase sampling frequency, inspect pinion gear contact, check magnetic plug |
| Fe above abnormal | Active or severe pinion gear wear | Replace oil, inspect pinion gear and bearings, review load and alignment |
| Cu above warning | Bearing or bushing wear beginning | Check bearing temperature, vibration, and clearance |
| Cu above abnormal | Significant non-ferrous wear | Inspect bearings and cages, replace oil, investigate root cause |
| P below warning | Anti-wear additive depletion affecting pinion gear protection | Shorten sampling interval and consider oil replacement |
| P below abnormal | Severe depletion of anti-wear protection | Replace oil and inspect pinion gear for scuffing or micropitting |
| B below warning | Reduced oxidation stability | Monitor acid value and oil color more frequently |
| B below abnormal | High oxidation risk | Replace oil and check for sludge or varnish |
| Acid value outside warning band | Chemical degradation or additive imbalance | Check oil oxidation, corrosion risk, and additive package |
| Acid value outside abnormal band | Corrosive oil condition | Replace oil and inspect metal surfaces for corrosion |
| Viscosity outside warning band | Film thickness or flow behavior changing | Check contamination, shear degradation, and oil mixing |
| Viscosity outside abnormal band | Oil no longer meets pinion gear lubrication requirements | Replace oil and verify correct lubricant grade |
9. Full-Life Model and Higher Mileage Extension
The 0–200,000 vehicle-km model is the first stage of a full-life degradation model. I found that the oil performance remains good at 200,000 vehicle-km under the observed conditions. This does not mean that the oil can be used indefinitely. It means that the linear degradation region extends at least to that mileage. To build a full-life model, I would continue sampling beyond 200,000 vehicle-km and classify the data by line, train type, and duty cycle. I would then refit the thresholds and look for the critical point \(x_c\) where the degradation rate changes. The full-life model would have three regions: a stable region, a transition region, and a critical region.
| Model region | Mileage condition | Behavior of indicators | Maintenance meaning for the pinion gear |
|---|---|---|---|
| Stable region | 0 to 200,000 vehicle-km | Linear and slow change; thresholds stable | Oil still protects the pinion gear; condition-based monitoring is sufficient |
| Transition region | Above 200,000 vehicle-km until \(x_c\) | Gradual deviation from linear trend | Increased sampling; watch additive depletion and wear metals |
| Critical region | Near and beyond \(x_c\) | Rapid change; breakpoint appears | Replace oil; inspect pinion gear, bearings, and seals |
I would use the same three-line value method for the higher-mileage data. For each monitoring interval, I would recalculate the mean and standard deviation, then establish warning and abnormal thresholds. For wear elements, I would use the upper bound. For additive elements, I would use the lower bound. For acid value and viscosity, I would use the two-sided bound. The result would be a sequence of threshold tables that trace the full-life degradation of the pinion gear lubricating oil. The regression model would then be updated from a single linear equation to a piecewise model, and the critical point would be estimated from the data rather than assumed.
10. Practical Decision Rules
I translated the statistical thresholds into practical decision rules. A single indicator outside a warning threshold does not automatically require oil replacement. Instead, it requires confirmation, increased sampling, and a check of the pinion gear and gearbox condition. A single indicator outside an abnormal threshold requires immediate action. When multiple indicators cross their thresholds together, the confidence in the diagnosis increases. For example, if iron rises above the abnormal threshold and phosphorus falls below the warning threshold, the pinion gear is likely experiencing wear while losing anti-wear protection. If copper rises and 100 °C viscosity falls, bearing wear and shear degradation may be occurring together. If acid value rises and boron falls, oxidation is likely accelerating.
| Condition pattern | Likely interpretation | Recommended action |
|---|---|---|
| Fe ↑, P ↓ | Pinion gear wear with anti-wear additive depletion | Replace oil, inspect pinion gear and mating gear |
| Fe ↑, Cu ↑ | Combined gear and bearing wear | Inspect bearings, cages, and gear contact pattern |
| Cu ↑, ν100 ↓ | Bearing wear and shear degradation | Check bearing clearance and oil shear stability |
| TAN ↑, B ↓ | Oxidation and antioxidant depletion | Replace oil, check for sludge and varnish |
| ν40 ↑, TAN ↑ | Oxidation and insoluble accumulation | Replace oil, check oil cooler and breather |
| ν40 ↓, ν100 ↓ | Shear degradation or wrong oil mixing | Verify oil grade, check for contamination |
| P ↓, B ↓, TAN ↑ | Advanced additive depletion and oxidation | Replace oil immediately and inspect pinion gear |
I also defined a three-level state model for the pinion gear lubricating oil. The normal state means all indicators are within the warning bands. The warning state means at least one indicator is outside the warning band but not outside the abnormal band. The abnormal state means at least one indicator is outside the abnormal band. The action level depends on the state and on the number of indicators involved. This model supports condition-based maintenance and avoids unnecessary annual replacement.
| State | Definition | Sampling action | Maintenance action |
|---|---|---|---|
| Normal | All indicators within warning bands | Continue normal sampling | No oil replacement required |
| Warning | At least one indicator outside warning band | Reduce sampling interval and confirm the result | Inspect pinion gear, bearings, and oil system |
| Abnormal | At least one indicator outside abnormal band | Immediate resampling and laboratory confirmation | Replace oil and perform targeted pinion gear inspection |
11. Economic and Operational Implications
The data-driven threshold method changes the maintenance logic from calendar-based replacement to condition-based replacement. In my dataset, the oil at 200,000 vehicle-km still showed good performance, which means that the annual replacement rule may be conservative for many metro gearboxes. Extending the oil change interval can reduce lubricant consumption, labor, downtime, and waste. It can also improve the availability of the fleet because fewer maintenance interventions are needed. At the same time, the threshold system protects the pinion gear by ensuring that oil is replaced before wear or additive depletion reaches a harmful level.
The economic benefit is not merely the price of oil. It includes the cost of disposal, the risk of maintenance-induced contamination, the labor required for oil changes, and the operational impact of taking trains out of service. The safety benefit is the early detection of pinion gear wear, bearing wear, and oil degradation. A threshold system that is too tight creates false alarms and unnecessary maintenance. A threshold system that is too loose allows pinion gear damage to develop. My three-line value method provides a balanced approach because the warning threshold is set at two standard deviations and the abnormal threshold at four standard deviations. This creates a buffer between normal variation and true abnormality.
| Dimension | Traditional annual replacement | Data-driven threshold method |
|---|---|---|
| Replacement trigger | Calendar time | Condition indicators and thresholds |
| Use of oil life | Often incomplete | Uses available oil life |
| Pinion gear protection | Time-based, not condition-based | Directly monitors wear and additive state |
| Maintenance cost | Higher due to unnecessary changes | Lower through optimized replacement |
| Safety | Conservative but not diagnostic | Early warning of wear and degradation |
| Data use | Limited | Continuous improvement through sampling |
12. Limitations and Further Work
I recognize several limitations. The dataset covers 0–200,000 vehicle-km, so the full-life model beyond that range is based on extrapolation rather than observation. The metro network includes different lines and train types, and although I sampled 14 lines, some rare duty cycles may not be fully represented. The maximum entropy method cannot directly handle lower-bound and two-sided indicators, so its role is limited to cross-checking wear elements. The oil samples were collected every 900 operating hours, which is frequent enough for trend analysis but may miss very short-term events. The pinion gear condition was inferred from oil indicators rather than directly inspected in every case. Further work should include higher-mileage sampling, direct pinion gear inspection data, and line-specific threshold adjustment.
I would also refine the degradation model by including covariates such as average passenger load, station spacing, maximum speed, ambient temperature, and gearbox oil temperature. These variables influence pinion gear contact stress and oil oxidation rate. A covariate-adjusted model could produce more precise thresholds for different operating conditions. I would also compare the three-line value method with additional methods such as robust regression, Bayesian updating, and machine learning anomaly detection. The goal is not to replace engineering judgment but to support it with quantitative evidence.
13. Conclusions
I developed a data-driven threshold method for metro vehicle gearbox lubricating oil, with direct relevance to pinion gear protection. I controlled sampling time, tooling, depth, and storage to ensure representative samples. I selected iron, copper, phosphorus, boron, acid value, and kinematic viscosity at 40 °C and 100 °C as the main monitoring indicators. I used distribution histograms to confirm the tendency toward normal distribution as the sample size increased. I applied the three-line value method and the maximum entropy method, compared their strengths and limitations, and selected the three-line value method for the final integrated threshold system. The thresholds I obtained provide warning and abnormal limits for each indicator, with upper bounds for wear elements, lower bounds for additive elements, and two-sided bounds for acid value and viscosity.
The linear regression model for iron threshold evolution was stable within 0–200,000 vehicle-km. The oil performance at 200,000 vehicle-km remained good under the observed conditions, which supports extending the gearbox oil change interval. The pinion gear remains protected as long as iron stays below the warning threshold, copper stays below its warning threshold, phosphorus and boron remain above their lower limits, and acid value and viscosity remain within their two-sided bands. When an indicator deviates from the linear model, the deviation can be treated as a critical-point signal that the oil is approaching the end of its useful life.
The same method can be extended to higher mileages. By continuing to collect samples, recalculating thresholds, and fitting a piecewise degradation model, I can construct a full-life degradation model for metro gearbox lubricating oil. This model would support condition-based oil replacement, reduce unnecessary maintenance, and maintain pinion gear reliability. The practical outcome is a maintenance strategy that uses data rather than calendar time, protects the pinion gear with targeted indicators, and supports safe, economical, and sustainable metro operations.
| Final element | Result from my study | Practical meaning for the pinion gear |
|---|---|---|
| Sampling plan | 14 lines, 8 gearboxes per train type, 450 samples, 0–200,000 vehicle-km | Representative evidence across duty cycles |
| Main indicators | Fe, Cu, P, B, TAN, ν40, ν100 | Combined wear, additive, and physicochemical surveillance |
| Threshold method | Three-line value method with maximum entropy cross-check | Handles upper, lower, and two-sided limits |
| Fe threshold | Warning 90.37 mg/kg; abnormal 136.92 mg/kg | Detects ferrous pinion gear and gear wear |
| Cu threshold | Warning 20.38 mg/kg; abnormal 31.09 mg/kg | Detects bearing and cage wear |
| P threshold | Warning 1,272.02 mg/kg; abnormal 562.06 mg/kg | Detects anti-wear additive depletion for pinion gear protection |
| B threshold | Warning 116.56 mg/kg; abnormal 44.02 mg/kg | Detects antioxidant and thermal-stability depletion |
| Acid value threshold | 2.99 ± 0.30 mg KOH/g warning; 2.99 ± 0.60 mg KOH/g abnormal | Detects oxidation and corrosion risk |
| 40 °C viscosity threshold | 111.72 ± 11.35 cSt warning; 111.72 ± 22.70 cSt abnormal | Maintains low-temperature flow and pinion gear film formation |
| 100 °C viscosity threshold | 15.33 ± 1.17 cSt warning; 15.33 ± 2.34 cSt abnormal | Maintains high-temperature film strength |
| Degradation model | Linear stable region up to 200,000 vehicle-km | Supports extended oil life with continuous monitoring |
| Full-life extension | Piecewise model with critical point \(x_c\) | Allows higher-mileage threshold development |
In summary, my data-driven threshold method gives metro maintenance teams a quantitative basis for judging when gearbox lubricating oil still protects the pinion gear and when it should be replaced. It replaces a fixed annual rule with an evidence-based rule. It uses the pinion gear as a focal point for interpreting wear metals, additive elements, and physicochemical changes. It supports safe operation, lower life-cycle cost, and continuous improvement through sampling. The next stage is to extend the same method to higher mileages and build a complete full-life degradation model for metro gearbox lubricating oil.