
Due to the varying degrees of degradation of the meshing stiffness of helical gears at different meshing stages, it is difficult to accurately analyze the stiffness degradation characteristics under this working condition solely by comparing the amplitude of the meshing stiffness curve. Therefore, this article uses the stiffness degradation rate as an indicator to quantitatively and intuitively describe the degradation characteristics of meshing stiffness. The stiffness degradation rate refers to the average stiffness under crack free conditions minus the average stiffness under crack failure conditions divided by the average meshing stiffness under crack free conditions. Its mathematical expression is as follows:
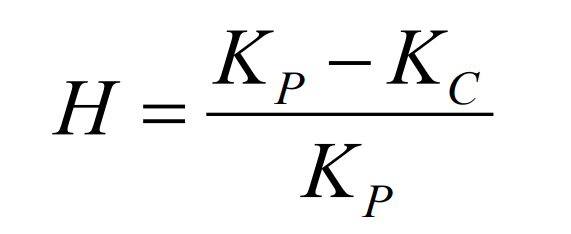
In the formula: H is the stiffness degradation rate; KP is the average stiffness under the condition of no cracks; KC is the average stiffness under crack failure conditions
From Tables 1 and 2, it can be seen that when a through type crack appears at the root of the helical gear, the time-varying meshing stiffness of the helical gear is more affected than that of the non through type. For example, the degradation rate of the 80% through type crack in the depth direction is 24.233%, while the degradation rate of the non through type crack in the 80% depth direction and the 100% width direction is 17.694%. From Table 3, it can be seen that the degradation rate of the stiffness of through-type cracks increases sharply with the propagation in the depth direction, indicating that for through-type cracks, the propagation in the depth direction of the crack has a significant impact on the stiffness.
| Depth direction | No cracks | 10% | 20% | 50% | 80% |
| Mean stiffness (10^8N/mm) | 3.314 | 3.056 | 2.941 | 2.808 | 2.727 |
| Deterioration rate/% | 0 | 7.777 | 11.250 | 15.266 | 17.694 |
Table 1 shows the mean stiffness and degradation rate of non penetrating cracks with varying degrees in the width direction of 100% and depth direction. This table shows that the 10% depth degradation rate increases by 7.777% compared to no crack, the 20% width ratio increases by 3.473% compared to 10%, and the 80% width ratio increases by 2.428% compared to 50%. This indicates that when the width direction is the same for non penetrating types, the degradation rate also increases but the increase amplitude slows down as the crack depth increases.
| Depth direction | No cracks | 25% | 50% | 75% | 100% |
| Mean stiffness (10^8N/mm) | 3.314 | 3.254 | 3.185 | 3.046 | 2.727 |
| Deterioration rate/% | 0 | 1.792 | 3.885 | 8.087 | 17.694 |
Table 2 shows non penetrating cracks with a depth direction of 80% and different widths. Similarly, it can be seen that when the depth direction of the non penetrating type is the same, the degradation rate also increases with the increase of crack width, but the increase amplitude accelerates.