
The pursuit of advanced automation across industries such as manufacturing, aerospace, and automotive has propelled robotics to the forefront of technological development. A critical component enabling the precise and reliable motion of industrial robots is the transmission system within its joints. Among the various options, the RV reducer, derived from the Rotating Vector transmission principle, has become the predominant choice due to its exceptional characteristics: a high reduction ratio, minimal backlash, high torsional stiffness, and compact structure. As a core component in precision robotics, the performance of the RV reducer directly influences the robot’s positioning accuracy, load capacity, and operational smoothness. Consequently, the research, development, and quality verification of RV reducers have garnered unprecedented attention. While significant theoretical research exists concerning their kinematics, dynamics, and error analysis, comprehensive experimental validation of their overall performance under realistic operating conditions remains a crucial and somewhat underexplored area. This article details the development and application of a multi-purpose test bench designed specifically for the exhaustive evaluation of RV reducer performance, including mechanical property assessment, fault diagnosis, and fatigue life testing.
Fundamental Principles and Performance Metrics of the RV Reducer
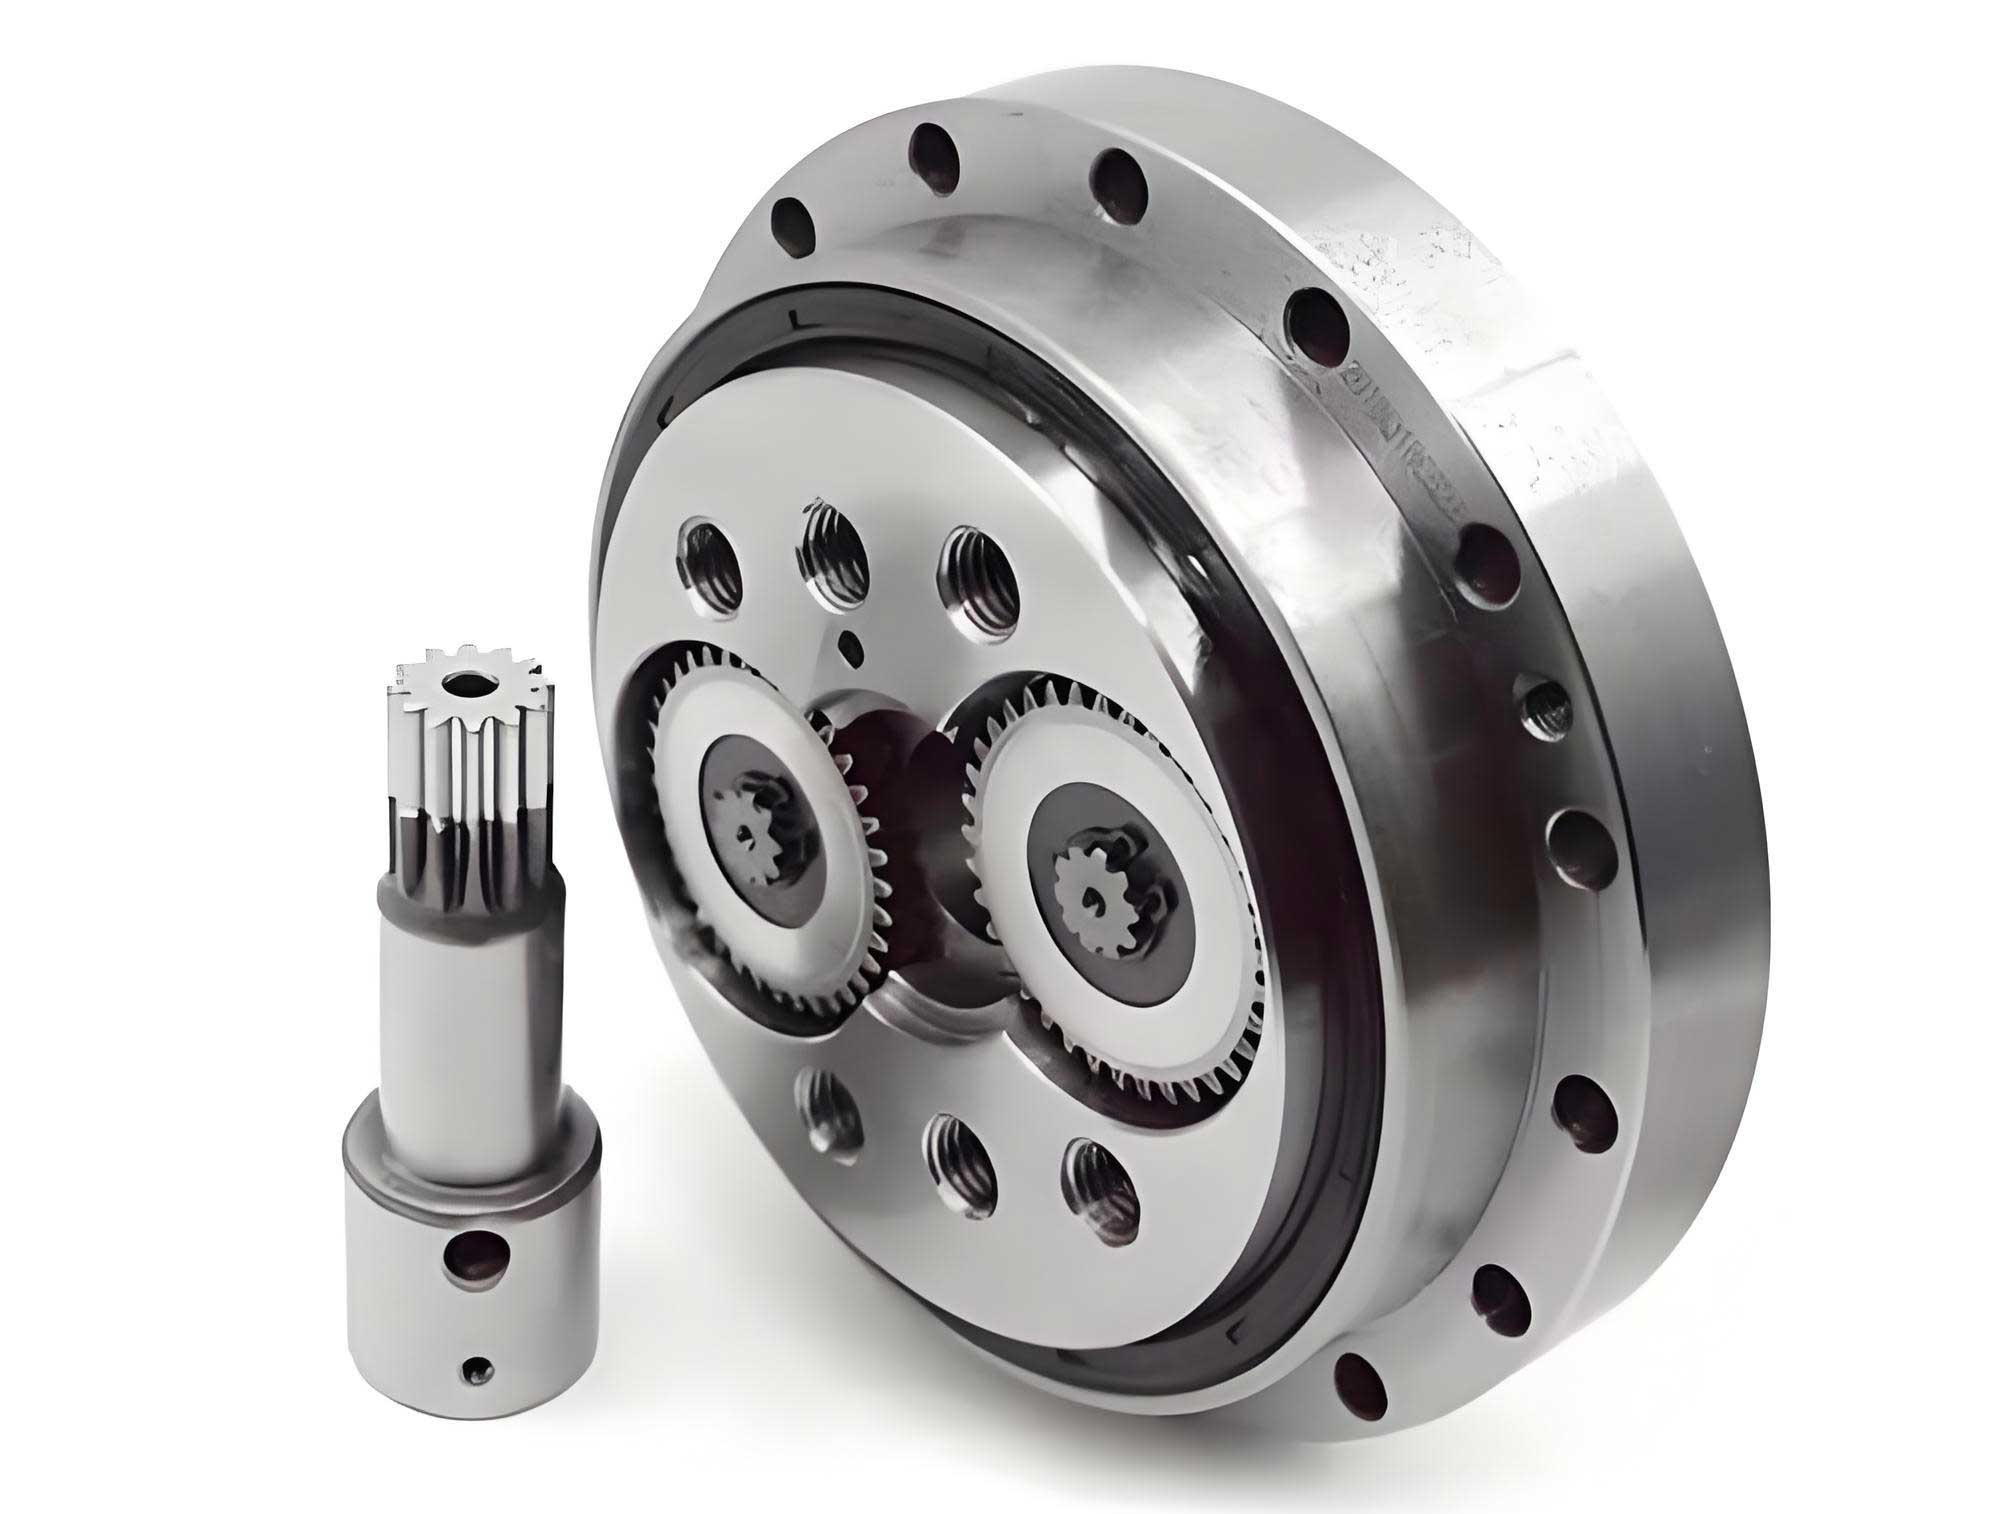
The RV reducer is a two-stage precision transmission device. The first stage typically consists of a spur gear differential, while the second stage employs a cycloidal pinwheel mechanism. This unique combination is responsible for its outstanding properties. The high reduction ratio is primarily achieved through the cycloidal stage. Its compact design results from the coaxial arrangement of the input and output shafts. Most importantly, the multi-tooth simultaneous meshing in the cycloidal stage provides high load-bearing capacity and stiffness, while the optimized design minimizes backlash and transmission error. To quantitatively assess the quality and performance of an RV reducer, several key metrics are universally employed:
- Transmission Efficiency (η): This measures the power loss during operation and is defined as the ratio of output power to input power. For a reducer, it can be calculated from the input torque ($T_1$), output torque ($T_2$), and the reduction ratio ($i$):
$$
η = \frac{T_2}{i \times T_1} \times 100\%
$$
- Transmission Error (TE): This is a critical measure of positional accuracy. It is defined as the difference between the actual output shaft rotation angle ($\phi_2$) and the theoretically expected output angle based on the input angle ($\phi_1$) and reduction ratio.
$$
TE = \frac{\phi_1}{i} – \phi_2
$$
The transmission accuracy is often specified as the peak-to-peak value of the transmission error over one revolution of the output shaft.
- Backlash or Lost Motion (j): This refers to the angular displacement lost when the direction of rotation is reversed, caused by gaps between mating components. For an RV reducer, it can be measured by comparing the output shaft’s lag when the input shaft is reversed under a small, bi-directional load. A common testing method involves measuring the input shaft movement while the output shaft is held fixed, with the output backlash calculated as the input movement divided by the reduction ratio.
Architecture of the Multi-Functional RV Reducer Test Bench
The developed test bench is designed to be a versatile, precise, and automated platform. It adopts an open-loop power flow configuration, which is preferred for its stability, reliability, and suitability for measuring absolute efficiency and other performance parameters. The bench is structured into three integrated subsystems: the Mechanical System, the Measurement and Control System, and the Software System.
1. Mechanical System Design and Construction
The mechanical framework is the foundation that ensures precise alignment, minimal external vibration, and reliable operation. The core structure is built upon a heavy-duty cast iron base, which provides excellent mass and damping characteristics to absorb vibrations and maintain stability during high-speed or high-torque tests. Mounted on this base are adjustable support blocks and risers for the drive, load, and sensor components. These adjustable elements are critical for achieving precise coaxial alignment of the entire driveline, which includes the servo motor, input torque/angle sensor, the RV reducer under test, the output torque/angle sensor, and the loading device. Misalignment is a primary source of additional noise, vibration, and measurement error; therefore, the ability to finely adjust the position of each component in the X and Y planes is essential. High-precision diaphragm couplings are used to connect the shafts between components. These couplings compensate for small residual misalignments and angular offsets while transmitting torque with minimal backlash and high torsional stiffness, ensuring that the measured signals accurately reflect the performance of the RV reducer itself and not the test bench connections.
2. Measurement and Control System Configuration
The measurement and control system is the “nervous system” of the test bench, responsible for providing controlled inputs, applying loads, and capturing a wide array of performance data. It is subdivided based on its functional role.
Drive Unit: This consists of a high-performance AC servo motor coupled with a matching servo drive and a Programmable Logic Controller (PLC). The PLC allows for fully automated test sequences: starting/stopping, precise control of input speed (from 0 to 3000 RPM in this configuration), and smooth direction reversal. This programmability is key for executing standardized test cycles for efficiency, backlash, and life testing.
Loading Unit: To simulate real-world operational loads, a magnetorheological (MR) brake or a precision electromagnetic powder brake is employed. These devices offer rapid response times, excellent controllability, and a wide torque range (0 to 500 N·m in this setup). A dedicated programmable controller adjusts the brake’s excitation current to apply the desired load torque accurately. Since braking generates significant heat, an integrated water cooling system is used to maintain stable operating temperatures and prevent performance drift.
Sensor Suite for Mechanical Performance:
- Torque/Speed Sensors: Non-contact, high-precision rotary torque sensors are installed on both the input and output shafts of the RV reducer. They measure instantaneous torque ($T_1$, $T_2$) and rotational speed.
- Angular Position Sensors: High-resolution absolute encoders (e.g., 18-bit or higher) are mounted on both shafts. They provide precise angular position data ($\phi_1$, $\phi_2$) for calculating transmission error and backlash.
Sensor Suite for Condition Monitoring & Diagnostics:
- Vibration Sensors: Tri-axial accelerometers are mounted at strategic points on the RV reducer housing (e.g., near the input bearing, output bearing, and cycloidal disc housing). They capture vibration signals in the X, Y, and Z directions, which are rich in information about the mechanical health of gears, bearings, and other internal components.
- Acoustic Sensor: A calibrated microphone is positioned at a standardized distance from the RV reducer in a semi-anechoic environment to measure sound pressure levels, providing data on noise emission, a key quality and wear indicator.
- Temperature Sensors: Non-invasive infrared sensors or embedded thermocouples monitor the temperature at critical points on the RV reducer housing. Temperature rise under load is an important indicator of efficiency loss and potential lubrication issues.
All sensor signals are fed into a high-speed, multi-channel data acquisition (DAQ) system, which digitizes the analog signals and streams the data to a host industrial computer for processing and analysis.
3. Software System and Data Analysis Framework
The software system, developed using virtual instrumentation concepts, serves as the user interface and analytical brain of the test bench. It is responsible for test sequence control, real-time data visualization, signal processing, and report generation.
Control and Data Acquisition Module: This module interfaces with the PLC and DAQ hardware. It allows the user to define test profiles (e.g., speed ramp, load steps, cyclical fatigue patterns) and automates their execution. During a test, it logs all sensor data synchronously.
Performance Analysis Module: This module processes the raw sensor data to compute key performance indicators in real-time or post-test.
- It calculates instantaneous and average transmission efficiency using the torque and speed data.
- It processes the encoder data to plot transmission error over one or multiple revolutions and computes the peak-to-peak accuracy.
- It analyzes the hysteresis curves from bi-directional rotation tests to quantify backlash.
Diagnostics and Signal Processing Module: This is a powerful suite of tools for condition monitoring.
- Time-Domain Analysis: Plots raw vibration, acoustic, and temperature signals versus time. Calculates statistical parameters like root mean square (RMS), peak value, kurtosis, and crest factor, which are sensitive to impulsive faults.
- Frequency-Domain Analysis: Performs Fast Fourier Transforms (FFT) on vibration and acoustic signals to generate frequency spectra. This is crucial for identifying fault characteristic frequencies associated with specific components (e.g., bearing ball-pass frequency, gear meshing frequency and its sidebands).
- Advanced Processing: Includes capabilities for order analysis (useful for variable speed tests), cepstrum analysis (for detecting periodic structures in spectra), and time-frequency analysis (like Wavelet Transform) for non-stationary signals.
The software can establish baseline signatures for a healthy RV reducer and then monitor for deviations during life tests, enabling proactive fault diagnosis and failure mode analysis.
Application of the Test Bench: Performance Evaluation of an RV Reducer
To demonstrate the capability of the test bench, a series of standard performance tests were conducted on a commercially available SHP series RV reducer with a rated torque of 168 N·m and a reduction ratio of 141.
1. Transmission Efficiency Test
The test was performed by running the RV reducer at a constant input speed (e.g., 500 rpm) and sequentially applying load steps from 0% to 100% of the rated output torque. At each load step, the system was allowed to reach thermal equilibrium before data was recorded over a sustained period. The input and output torque values were averaged to calculate the overall system efficiency. To isolate the efficiency of the RV reducer itself ($η_{RV}$), the losses from couplings ($η_1$) and support bearings ($η_2$) on the test bench were estimated and subtracted:
$$
η_{RV} = \frac{η_{measured}}{η_1 η_2}
$$
The results clearly show the load-dependent characteristic of efficiency, typically rising with load until reaching a plateau or peak near the rated torque.
| Load Level (% of Rated Torque) | Output Torque, $T_2$ (N·m) | Input Torque, $T_1$ (N·m) | Measured System Efficiency, η (%) | Estimated RV Reducer Efficiency, $η_{RV}$ (%) |
|---|---|---|---|---|
| 0% (Running-in) | ~5.84 | ~0.250 | N/A | N/A |
| 25% | 42.58 | 0.541 | ~56.9 | ~59.8 |
| 50% | 84.36 | 0.842 | ~70.9 | ~74.5 |
| 75% | 125.62 | 1.162 | ~76.5 | ~80.4 |
| 100% | 168.41 | 1.523 | ~78.2 | ~82.2 |
Note: The 0% load data represents system friction. The estimated RV reducer efficiency values assume coupling and bearing efficiencies of 98.5% each. Actual values require precise calibration of the test bench itself.
2. Transmission Error Test
The input shaft was commanded to rotate in precise angular increments. For each increment of the input shaft, the corresponding output shaft angle was measured using the high-resolution encoders. The transmission error was calculated for one full revolution of the output shaft (requiring 141 input shaft revolutions). The resulting data provides a detailed map of the RV reducer’s kinematic accuracy.
| Output Shaft Angle Segment (Degrees) | Sample TE Measurements (Arc-minutes) | Output Shaft Angle Segment (Degrees) | Sample TE Measurements (Arc-minutes) |
|---|---|---|---|
| 0 – 90 | -0.905 to +1.105 | 180 – 270 | -1.12 to +1.045 |
| 90 – 180 | -1.17 to +1.12 | 270 – 360 | -1.025 to +0.935 |
Key Result: The peak-to-peak transmission error (maximum TE – minimum TE) for this unit was calculated as approximately 2.275 arc-minutes. This value is a direct measure of the RV reducer’s transmission accuracy.
3. Backlash Test
Using the method where the output shaft is prevented from rotating, the input shaft was slowly rotated forward and then backward. The angular displacement of the input shaft required to take up the slack in the system was measured by the input encoder. The output backlash is this measured input angular displacement divided by the reduction ratio ($i=141$).
| Test Trial | Measured Input Shaft Angular Displacement (Arc-minutes) | Calculated Output Shaft Backlash (Arc-minutes) |
|---|---|---|
| 1 | ~108.6 | ~0.77 |
| 2 | ~145.2 | ~1.03 |
| 3 | ~138.2 | ~0.98 |
Average Backlash: The average measured backlash for this RV reducer sample was approximately 0.93 arc-minutes, which meets common specifications for precision robotics.
Comprehensive Application: From Performance Grading to Lifecycle Analysis
Beyond basic performance grading, the true power of this integrated test bench lies in its ability to support advanced engineering activities.
Comparative Analysis and Benchmarking: The bench allows for direct, apples-to-apples comparison between different RV reducer models or manufacturers. By testing a domestic RV reducer and comparing its efficiency (peak ~82%), transmission error (2.275′), and backlash (0.93′) against a high-end imported counterpart (which might exhibit efficiency >90%, TE < 1′, and backlash < 0.5′), clear quantitative gaps can be identified. This data is invaluable for guiding R&D efforts towards specific performance improvements in design, material selection, and manufacturing processes.
Fault Diagnosis and Condition Monitoring: The integrated vibration, acoustic, and temperature sensors transform the bench into a diagnostic station. By running a RV reducer to failure under accelerated life testing, one can collect the “birth-to-death” sensor data. Early-stage wear in a crankshaft bearing or a slight chip on a cycloidal tooth will manifest as specific changes in the vibration spectrum (e.g., emergence of bearing fault frequencies or increased sidebands around the gear mesh frequency). Machine learning algorithms can be trained on this data to develop automated diagnostic and prognostic models for RV reducers in the field.
Fatigue Life and Reliability Testing: The bench can execute programmed duty cycles that simulate years of robot operation in a compressed timeframe. By applying dynamic loads (e.g., following a robot pick-and-place force profile) and monitoring performance degradation (increasing backlash, decreasing efficiency, rising vibration levels), engineers can identify the dominant failure modes—whether it’s bearing spalling, tooth pitting on the cycloidal disc, or wear in the needle bearings. This information is critical for validating design life predictions, improving lubrication strategies, and conducting failure mode, effects, and criticality analysis (FMECA).
Conclusion
The development of a comprehensive, multi-functional test bench is a fundamental step towards mastering the technology of precision RV reducers. The described system successfully integrates mechanical engineering design, advanced sensor technology, and sophisticated software analytics into a single platform. It moves beyond simple pass/fail testing to enable deep performance characterization, objective benchmarking against international standards, root-cause fault diagnosis, and empirical life testing. The automated and data-rich nature of the testing process not only enhances accuracy and repeatability but also significantly speeds up the evaluation cycle. For manufacturers, this tool is essential for quality control, continuous product improvement, and gaining a competitive edge. For researchers, it provides the empirical data needed to validate theoretical models and explore new design frontiers. As the demand for higher precision and reliability in robotics continues to grow, such advanced test systems will play an increasingly vital role in driving innovation and ensuring the superior performance of the critical RV reducer component.