
The advent of the Fourth Industrial Revolution, embodied by initiatives like “Industry 4.0” and “Made in China 2025,” has fundamentally transformed global manufacturing. At the heart of this transformation lies the widespread adoption of industrial robots, where precision and reliability are paramount. A critical component dictating the performance of these robotic arms is the rotary vector (RV) reducer. This compact, high-ratio speed reducer is responsible for transmitting motion and torque from the servo motor to the robot joint with exceptional accuracy, minimal backlash, and high stiffness.
Despite the growing demand, a significant technological gap exists, with many core robotic components, including high-performance RV reducer units, heavily reliant on imports. This dependence not only increases costs but also hinders independent innovation in advanced robotics. Therefore, the development and refinement of domestic high-performance RV reducer technology is a pressing national industrial priority. A crucial enabler for this development is a robust, accurate, and comprehensive testing methodology. While theoretical research on RV reducer design is abundant, dedicated research on standardized, holistic performance testing platforms remains relatively scarce. Moving beyond manual data recording or basic computer-aided testing, modern automated test systems utilizing virtual instrumentation offer superior speed, precision, data handling, and flexibility. However, many existing platforms focus on isolating single performance parameters. The design and construction of a versatile, integrated test stand capable of evaluating all key performance indicators of an RV reducer under various operational conditions is therefore of immense practical value. This article details the design philosophy, component selection, and implementation of such a comprehensive test platform, built with a balance between measurement accuracy, functional versatility, and cost-effectiveness.
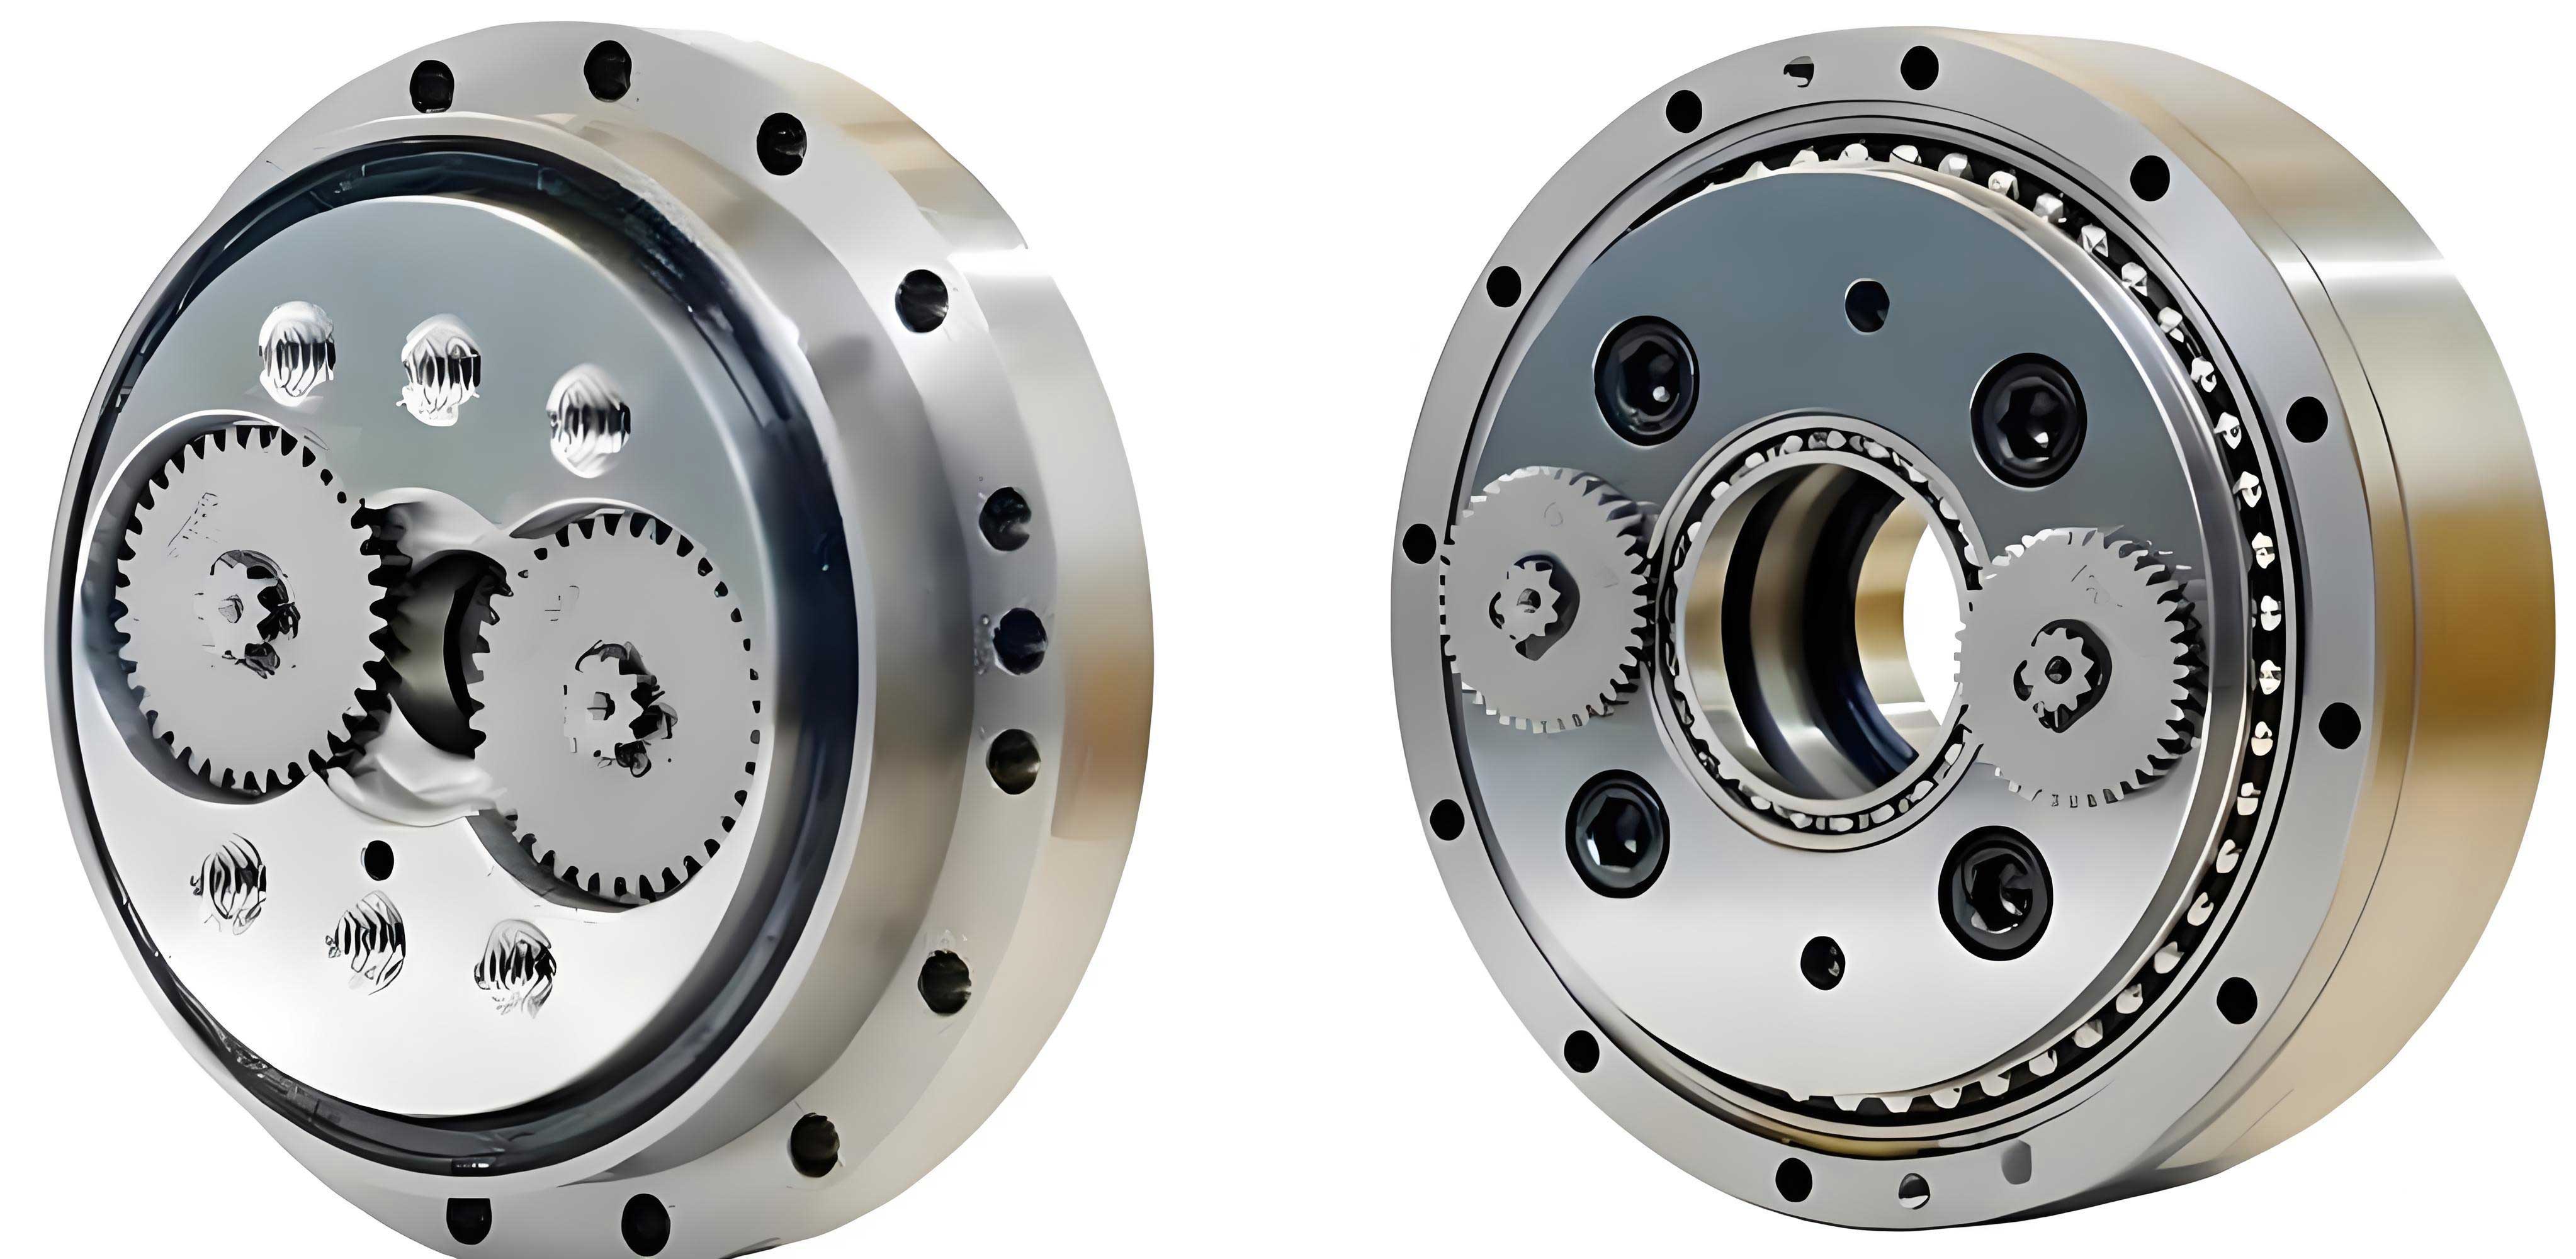
The primary objective was to design and build a modular test platform that can quickly and accurately assess the comprehensive performance of an RV reducer. Key design requirements included: facilitating rapid installation and disassembly of the unit under test (UUT), ensuring high alignment accuracy during mounting, and covering all critical performance metrics as defined by relevant industry standards. The platform is designed to be adaptable, allowing for the testing of various RV reducer models and similar transmission components with minimal reconfiguration.
Fundamental Measurement Principles for RV Reducer Performance
To fully characterize an RV reducer, several key performance parameters must be measured. The following section outlines the fundamental principles and formulas used to calculate each parameter from raw sensor data. A consolidated view is presented in Table 1.
| Parameter | Symbol | Formula | Description |
|---|---|---|---|
| Transmission Ratio | $$i$$ | $$i = \frac{n_1}{n_2}$$ | Ratio of input speed ($$n_1$$) to output speed ($$n_2$$). |
| Transmission Efficiency | $$\eta$$ | $$\eta = \frac{T_2}{i \cdot T_1} \times 100\%$$ | Ratio of output power to input power, calculated from output torque ($$T_2$$), input torque ($$T_1$$), and ratio ($$i$$). |
| Transmission Error | $$E$$ | $$E = \frac{\phi_1}{i} – \phi_2$$ | Difference between theoretical output rotation ($$\phi_1 / i$$) and actual output rotation ($$\phi_2$$). |
| Transmission Accuracy | $$\theta$$ | $$\theta = E_{max} – E_{min}$$ | Peak-to-peak value of the transmission error over one cycle, indicating precision. |
| Torsional Stiffness | $$K$$ | $$K = \frac{i \cdot T_1}{(\phi_1 / i) – \Delta \phi_2}$$ | Resistance to elastic deformation under load, calculated from input torque ($$T_1$$), input rotation ($$\phi_1$$), output twist compensation ($$\Delta \phi_2$$), and ratio ($$i$$). |
Transmission Ratio (i): This is a fundamental geometric property of the RV reducer, defined as the ratio of the input rotational speed to the output rotational speed. It is verified dynamically during operation using speed sensors on both the input and output shafts.
$$i = \frac{n_1}{n_2}$$
where $$n_1$$ is the input shaft speed and $$n_2$$ is the output shaft speed.
Transmission Efficiency (η): This parameter quantifies the power loss within the RV reducer due to factors like friction, lubrication, and meshing losses. It is calculated as the ratio of output power to input power. Since power is the product of torque and angular speed, and considering the transmission ratio, the efficiency can be derived from torque measurements alone under steady-state conditions.
$$\eta = \frac{P_{out}}{P_{in}} = \frac{T_2 \cdot \omega_2}{T_1 \cdot \omega_1} = \frac{T_2 \cdot (2\pi n_2)}{T_1 \cdot (2\pi n_1)} = \frac{T_2}{T_1} \cdot \frac{n_2}{n_1} = \frac{T_2}{i \cdot T_1}$$
Therefore, the final calculation formula is:
$$\eta = \frac{T_2}{i \cdot T_1} \times 100\%$$
where $$T_1$$ is the input torque and $$T_2$$ is the output torque.
Transmission Error (E): This is a critical measure of the kinematic accuracy of the RV reducer. It represents the deviation between the actual position of the output shaft and its theoretical position based on a perfect, error-free transmission of the input motion.
$$E = \phi_{2_{theoretical}} – \phi_{2_{actual}} = \frac{\phi_1}{i} – \phi_2$$
where $$\phi_1$$ is the actual input shaft angular position and $$\phi_2$$ is the actual output shaft angular position, both measured by high-resolution encoders.
Transmission Accuracy (θ): Often reported as the positioning accuracy or repeatability, this is defined as the peak-to-peak value of the transmission error over one complete cycle or a specified measurement interval. It indicates the precision and consistency of the RV reducer.
$$\theta = E_{max} – E_{min}$$
Torsional Stiffness (K): This parameter reflects the resistance of the RV reducer to elastic deformation under load, which directly impacts the servo stiffness and dynamic response of a robot joint. It is defined as the applied torque per unit of angular deflection. To measure it, the output shaft is locked (or heavily braked), and a known torque is applied to the input shaft. The resulting angular displacement of the input shaft is measured, and the effective angular deflection at the output is calculated, accounting for the theoretical reduction and any residual twist in the locked output.
$$K = \frac{T_{output}}{\Delta \theta_{output}}$$
Since $$T_{output} = i \cdot T_1$$ and the theoretical output rotation for the input $$\phi_1$$ is $$\phi_1 / i$$, the actual residual twist at the output (due to compliance) is $$\Delta \phi_2$$. Therefore, the effective output angular deflection is $$(\phi_1 / i) – \Delta \phi_2$$.
$$K = \frac{i \cdot T_1}{(\phi_1 / i) – \Delta \phi_2}$$
where $$\Delta \phi_2$$ is a compensation angle measured at the output under load, representing the system’s elastic deformation.
Detailed Design of the Comprehensive Test Platform
The test platform was conceived as a modular, horizontal-axis system. A horizontal layout was chosen over a vertical one because it simplifies the alignment of the drive motor, sensors, UUT, and loading device along a common axis. While it introduces radial loads on the support bearings, the ease of achieving and maintaining precise coaxiality outweighs this drawback. The system is constructed on a heavy-grade, precision-machined cast iron surface plate (2.5m x 1.0m x 0.3m), providing the necessary mass, stability, and flatness to minimize vibrations and ensure measurement fidelity.
The overall architecture, as shown in the system layout diagram, follows a sequential chain: Drive Unit → Input Measurement Module → Unit Under Test (UUT) → Output Measurement Module → Loading Unit. All modules are mounted on linear guide rails with T-slots on the baseplate, allowing for swift positional adjustment and secure locking to accommodate different sizes of RV reducer units. The specific model targeted for initial development and validation was a ZKRV-80E type RV reducer.
Critical Component Selection and Rationale
The selection of each component was driven by the performance specifications of the target RV reducer and the need for high-precision measurement.
1. Main Drive Motor: A high-performance AC servo motor (Model: 210MD09Y33C) was selected as the prime mover. Its key specifications include a continuous duty (S1) rating of 33 kW and a high maximum speed of 9,000 rpm, which covers and exceeds the operational range of typical RV reducer inputs. It provides a rated torque of 35.02 N·m, ensuring sufficient power for testing under full load. The motor employs water cooling and oil-mist lubrication, essential for managing heat dissipation during prolonged high-speed or high-torque testing cycles.
2. Programmable Loading Unit: To simulate the wide range of loads experienced by a robot joint, a magnetic powder brake (Model: CZ-500) was chosen. This device offers several advantages: it provides a smooth, controllable torque that is linearly proportional to its excitation current, allows for dynamic load simulation, and can maintain a stable torque even at near-zero speed—crucial for stiffness testing. With a maximum torque capacity of 5,000 N·m and water cooling, it is well-suited for applying the rated output torque (800 N·m for the ZKRV-80E) and beyond.
3. Torque and Speed Sensors: Accurate measurement of input and output dynamics is the cornerstone of the platform. Two non-contact, phase-shift torque sensors with integrated speed detection were selected:
- Input Side (ZJ-100AG): Chosen for a range of ±100 N·m, comfortably covering the maximum input torque of the RV reducer (approx. 16.5 N·m for ZKRV-80E at rated output). Its high-speed capability aligns with the 9,000 rpm motor.
- Output Side (ZJ-5000A): Selected for a range of ±5,000 N·m to handle the high output torque (up to 800 N·m rated, with overload capacity).
These sensors provide the critical $$T_1$$, $$n_1$$, $$T_2$$, and $$n_2$$ data for calculating efficiency, ratio, and serving as inputs for other derived parameters.
4. High-Resolution Angular Encoders: To measure transmission error and angular positions for stiffness calculation, ultra-high-resolution absolute encoders (64-bit) are installed on both the input and output shafts. These directly provide the $$\phi_1$$ and $$\phi_2$$ data with exceptional precision.
5. Coupling System: To connect the various modules while accommodating minor misalignments and ensuring torque transmission without backlash, flexible jaw-type couplings were used. Different models were selected based on shaft diameters and torque requirements:
- Between motor, input sensor, and RV reducer input: MJC-30C-GR-type couplings.
- Between RV reducer output, output sensor, and brake: MJB-55-RD-type couplings with clamping sleeves for a more robust connection.
6. Auxiliary Systems: Reliable operation of the high-speed motor and brake necessitates dedicated support systems:
- Oil-Mist Lubrication Unit (HL0A-03): Provides a precise, continuous feed of lubricant to the main drive motor’s bearings.
- Water Chiller (CW-5200): Circulates coolant to manage the heat generated by the servo motor and the magnetic powder brake.
- Pneumatic System: Comprising an air compressor (V-1.6/8), receiver tank (0.3 m³), and filters, this system provides clean, dry air primarily for operating pneumatic clutches or actuators in the setup and for general cleaning to prevent contamination.
7. Control and Data Acquisition: A centralized manual control console (HY-3A type) houses the controllers for the servo drive and the magnetic brake. While not fully automated, this setup offers precise manual control over speed and load setpoints. Sensor signals (torque, speed, angle) are routed to a high-speed data acquisition (DAQ) card in an industrial PC. Custom-developed software, potentially using platforms like LabVIEW or a similar engineering environment, is used for real-time data logging, visualization, and post-processing calculations according to the formulas in Table 1.
The key technical parameters defining the platform’s operational envelope are summarized in Table 2.
| Parameter | Specification |
|---|---|
| Target UUT | RV Reducer (e.g., ZKRV-80E Series) |
| Input Speed Range | 0 – 9,000 rpm |
| Loading Torque Range | 0 – 5,000 N·m |
| Input Torque Sensor Range | ±100 N·m |
| Output Torque Sensor Range | ±5,000 N·m |
| Angular Encoder Resolution | 64-bit |
Platform Assembly and Integration
The physical integration of the platform followed a systematic process on the baseplate:
- Axis Alignment: The linear guide rails were first meticulously aligned and secured to the cast iron baseplate to establish the primary mechanical axis.
- Module Mounting: Each functional module—drive motor, input sensor cradle, UUT mounting bracket, output sensor cradle, and magnetic brake—was then positioned on the slides. Their alignment was finely adjusted using dial indicators to ensure coaxiality along the entire driveline.
- Mechanical Linking: The modules were interconnected using the selected flexible couplings. Care was taken during this step to avoid imposing any pre-load or misalignment stress on the sensitive torque sensors.
- Auxiliary System Connection: The lubrication lines from the oil-mist generator were connected to the drive motor. Hoses from the water chiller were attached to the cooling jackets of the motor and the brake. Pneumatic lines were run from the filter-regulator unit to their points of use.
- Sensor and Electrical Integration: All sensors (torque, encoders) were wired to the DAQ system. Power and control cables for the servo drive and magnetic brake were connected to the manual control console. The control console itself was interfaced with the industrial PC for setpoint control and data integration.
- Software Configuration: The final step involved calibrating the sensor channels in the software, configuring the data sampling rates, and programming the calculation algorithms for real-time and post-processed analysis of the five key RV reducer performance parameters.
Representative Test Procedures and Results
With the platform fully assembled and calibrated, a series of tests can be conducted on any installed RV reducer. Below are examples of test procedures and the type of results generated for some key parameters.
1. Breakaway Torque Test: This test measures the static friction of the RV reducer. The output shaft is held stationary by the brake. The input motor is very slowly commanded to increase torque from zero. The precise moment the input shaft begins to rotate (detected by the input encoder) is recorded, and the corresponding input torque value from the sensor at that instant is the breakaway torque. This value, when multiplied by the transmission ratio, gives the output breakaway torque. A sample result might show an average breakaway torque of approximately 500 N·m at the output, indicating the initial resistance that must be overcome.
2. Transmission Ratio Verification Test: The RV reducer is operated at a constant output speed (e.g., 15 rpm) under a constant load (e.g., 800 N·m). The software continuously records the input speed ($$n_1$$) and output speed ($$n_2$$) and calculates the instantaneous ratio $$i = n_1 / n_2$$. A real-time plot of this ratio against time should show a stable, nearly constant value. For a ZKRV-80E with a theoretical ratio of 121, the measured dynamic ratio might average 133.9, with minor fluctuations due to measurement noise and cyclical error.
3. Torsional Stiffness Test: This is a quasi-static test. The output shaft of the RV reducer is firmly locked by applying the maximum holding current to the magnetic brake. The input motor is then controlled to apply a slowly increasing torque in the positive direction up to the rated input torque, then back to zero, then in the negative direction, and back to zero, completing a load cycle. Throughout this process, the input torque ($$T_1$$) and the corresponding input angular position ($$\phi_1$$) are recorded with high resolution. Any minute rotation detected at the output encoder under this locked condition represents the system’s elastic twist ($$\Delta \phi_2$$). The data is plotted as Torque vs. Angular Deflection (often converting $$\phi_1/i$$ to effective output rotation). The slope of the linear portion of this hysteresis curve is the torsional stiffness $$K$$. A typical plot would show a slight hysteresis loop, and the stiffness is calculated from the loading curve’s slope.
4. Transmission Efficiency Test: The RV reducer is run at its rated input speed while the magnetic brake applies the rated output torque. The system reaches thermal equilibrium. The data acquisition system continuously logs the input torque ($$T_1$$) and output torque ($$T_2$$). Using the known (or dynamically measured) transmission ratio ($$i$$), the software computes the instantaneous efficiency $$\eta$$. A graph of efficiency over time for a unit with a nominal 121:1 ratio might show an average value of 0.822 (or 82.2%). This curve can reveal how efficiency varies with running-in time or temperature.
Conclusion and Platform Merits
The designed and implemented comprehensive performance test platform successfully addresses the need for a versatile, accurate, and cost-effective system for evaluating RV reducer units. Compared to existing solutions, this platform offers several distinct advantages:
- Multi-Model Testing Capability: The modular “building-block” design based on linear slides allows for quick reconfiguration to accommodate different sizes and models of RV reducers and other precision gearboxes, significantly enhancing its utility and return on investment.
- Holistic Performance Assessment: By integrating high-fidelity torque, speed, and angle sensors with a robust loading mechanism, the platform can measure all five critical performance parameters—transmission ratio, efficiency, error, accuracy, and torsional stiffness—on a single setup, providing a complete performance profile.
- Simplified UUT Changeover: The procedure for swapping the unit under test is straightforward. By simply disengaging two flexible couplings and sliding the central module out, the RV reducer can be replaced without the need to realign the entire drive train, as the modules retain their pre-aligned positions on the slides.
- High-Power, Controllable Drive: The use of a high-power AC servo motor enables testing under demanding load and speed conditions representative of real robotic applications. Its excellent controllability allows for precise simulation of dynamic motion profiles.
This platform serves as a vital tool for research and development, quality assurance, and comparative analysis. By generating precise, repeatable data on domestic RV reducer prototypes and comparing them directly against benchmark imported units, engineers can identify design weaknesses, validate improvements, and accelerate the development cycle. The insights gained from comprehensive testing are indispensable for closing the technological gap in high-precision robotic core components and advancing the field of advanced manufacturing.